Abstract
Activation of mammalian target of rapamycin (mTOR) signaling pathway is associated with poor prognosis of epithelial ovarian cancer. The TSC1-TSC2 complex is a critical negative regulator of mTOR signaling. Here, we demonstrated that TSC1 was frequently downregulated in high-grade serous ovarian carcinoma (HGSOC) and low TSC1 expression level is associated with advanced tumor stage. We next identified miR-130a to be a negative regulator of TSC1 by targeting its 3’UTR. miR-130a was overexpressed in HGSOC and could drive proliferation and invasion/metastasis of ovarian cancer cells. miR-130a could also attenuate rapamycin/starvation-induced autophagy. Ectopic TSC1 expression could block the effects of miR-130a on cell proliferation, migration and autophagy. Finally, we found that miR-130a expression could be upregulated by inflammatory factors and was transactivated by NF-κB. Therefore, our findings establish a crosstalk between inflammation and mTOR signaling that is mediated by miR-130a, which might have a pivotal role in the initiation and progression of HGSOC.
The target of rapamycin (TOR) signaling pathway regulates many major cellular processes and is implicated in an increasing number of pathological conditions, including cancer, obesity, type 2 diabetes and neurodegeneration.1 Regulation of mTOR signaling is altered in many human cancers.2 mTORC1 activation is common in human epithelial ovarian cancers.3 According to The Cancer Genome Atlas (TCGA), mTOR mutations were identified in 1.9% of ovarian cancers.3 Activation of mTOR signaling pathway is associated with adverse prognostic factors of epithelial ovarian cancer.4
The tuberous sclerosis 1 (TSC1)/TSC2 tumor suppressor complex serves as a repressor of the mTOR pathway.TSC1 stabilizes TSC2 by excluding the HERC1 ubiquitin ligase from the TSC2 complex.5 TSC1/TSC2 mutations or low expression of TSC1/TSC2 results in dysfunction TSC1-TSC2 complex and activation of mTORC1. Mutations in TSC1 and TSC2 genes are the cause of a genetic disorder known as tuberous sclerosis.6 The TSC1+/− and TSC2+/− mice are tumor prone and develop malignancies in multiple organs, which confirms the tumor suppressor functions of the TSC1 and TSC2 genes.7 Loss of heterozygosity (LOH) of TSC1 and TSC2 was detected in lung cancer.8 LOH and promoter methylation are two important mechanisms for downregulation of TSC genes in oral squamous cell carcinoma.9 However, although downregulation of TSC1 and TSC2 can be found in many solitary malignancies, it is not always accompanied by LOH and methylation.8 One of the possible mechanisms is TSC2 is inactivation by Akt-dependent phosphorylation, which destabilizes TSC2 and disrupts its interaction with TSC1.10 The IKKb-mediated TSC1 suppression activates the mTOR pathway, enhances angiogenesis, and results in tumor development.11 The role of microRNA-mediated TSC gene repression remains undetermined. Recently, one study showed that miR-451 regulates cardiac hypertrophy and cardiac autophagy by targeting TSC1.12
In this study, we report that miR-130a, which is upregulated in high-grade serous ovarian carcinoma (HGSOC), activates the mTOR pathway through directly targeting TSC1. Furthermore, the expression of miR-130a was activated by NF-κB signaling. Our findings suggest that inflammatory response can drive the oncogenesis of HGSOC by upregulating mTOR signaling pathway.
Results
TSC1 is downregulated in HGSOC and low TSC1 expression level is associated with advanced tumor stage
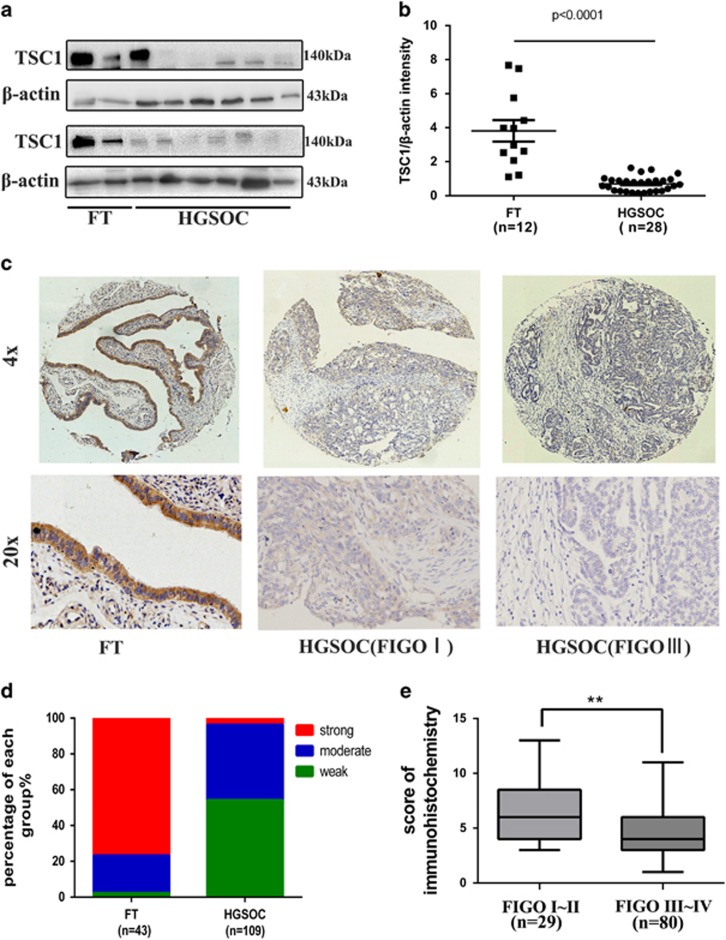
Several components of the mTOR signaling pathway are known to be dysregulated in a wide spectrum of human cancers.2 Low level of TSC1 was associated with the aggressive nature of breast cancer and poor clinical outcome.13 To investigate the expression of TSC1 in HGSOC, the expression of TSC1 was analyzed by western blot in HGSOC and in fallopian tube epithelia (FT). As shown in Figures 1a and b and Supplementary Figure S1a, TSC1 showed loss or decreased expression in HGSOC tissues (n=28) compared with FT (n=12). We then examined TSC1 expression in HGSOC (n=109) and FT (n=43) by immunohistochemistry and analyzed the clinicopathologic parameters. It was shown that TSC1 had significantly lower intensity of immunostaining in HGSOC than in fallopian tubes (Figures 1c and d). Low TSC1 expression level was significantly correlated with advanced tumor stage and CA125 (Figure 1e; Supplementary Table 2). However, low TSC1 expression was not associated with other clinicopathological factors of HGSOC patients (Supplementary Table 2).
Figure 1.
Expression analysis of TSC1 in high-grade serous ovarian carcinoma. (a, b) Western blot analysis of TSC1 in HGSOC tissue samples (n=28) compared with normal fimbria (n=12). (c) Representative images of immunohistochemical staining of TSC1 in tissue microarray. (d) The expression level distribution of TSC1 (quantified by immunohistochemical score) in HGSOC compared with FT. (e) Association analysis between TSC1 expression and tumor stages. **P<0.01
miR-130a suppresses TSC1 expression by targeting 3’UTR of TSC1
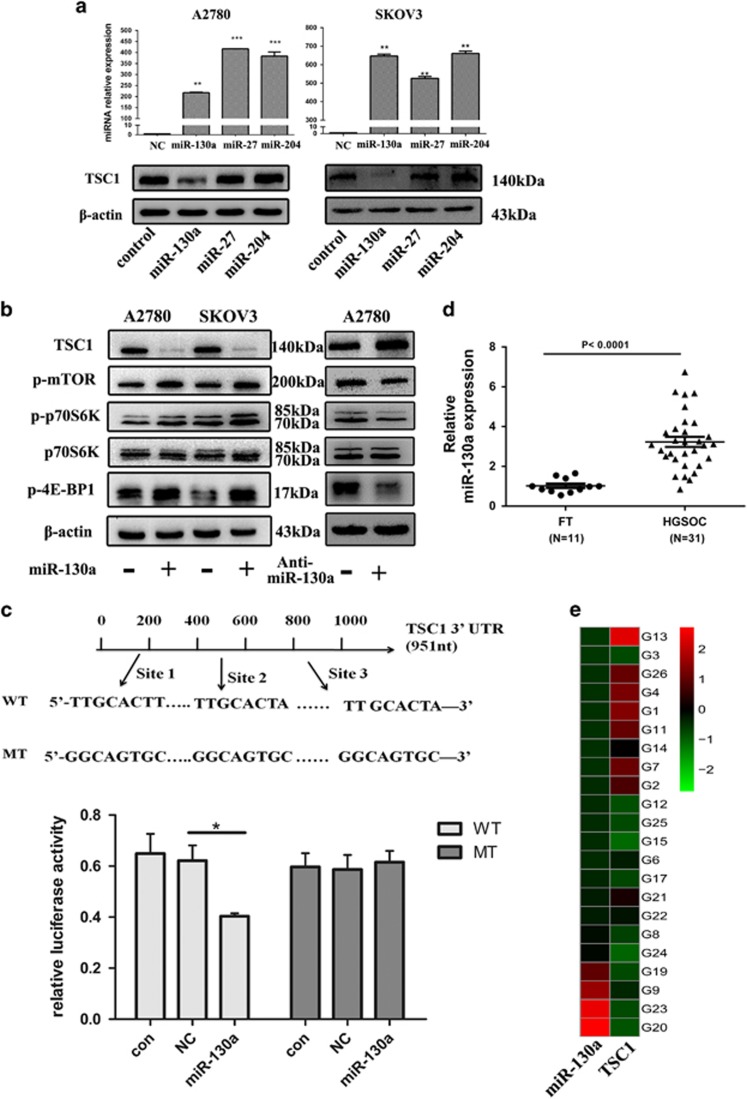
Based on TCGA data analysis, TSC1 gene mutations or promoter methylation seem to be uncommon in HGSOC. TSC1 contains a longer 3’UTRs (4887 nt) than TSC2 (117 nt) (Supplementary Fig.S1c), suggesting a possible negative regulation by miRNAs. To explore the possibility that miRNAs might regulate TSC1 expression, TargetScan 5.1, miRDB and microrna.org were used to search for the potential miRNAs for TSC1 regulation. Several miRNAs, including miR-130a, miR-204 and miR-27a, were predicted to target TSC1. We then respectively transfected each of those miRNA mimics into A2780 cells and determined whether TSC1 could be regulated by any of those miRNAs. As shown in Figure 2a, overexpression of miR-130a, but not miR-27 or miR-204, significantly reduced TSC1 expression. In contrast, miR-130a inhibitor restored the expression levels of TSC1 (Figure 2b). Moreover, overexpression of miR-130a significantly increased levels of p-mTOR, p-p70S6K and p-4E-BP1 whereas miR-130a inhibitor suppressed mTOR and its downstream signaling effectors (Figure 2b). To confirm that TSC1 is a direct target of miR-130a, we then introduced TSC1 3′UTR (containing three putative miR-130a-binding sites) and corresponding mutant counterparts into pmiRGLO vector. These reporter vectors were then transfected into cells with and without miR-130a expression. We found that miR-130a overexpression reduced the luciferase activity in cells transfected with the wild-type 3′UTR of TSC1 but not in cells with mutant 3′UTR in A2780 cell lines (Figure 2c). Furthermore, we measured miR-130a expression level in ovarian cancer tissues and found that miR-130a is significantly higher in HGSOC tissues (n=31) than normal FT tissues (n=11) (Figure 2d). Importantly, a significant correlation between high miR-130a and low TSC1 levels was detected in the same collection of HGSOC specimens (Figure 2e). Collectively, these data suggest that miR-130a can suppress TSC1 expression by targeting its 3’UTR and the decreased expression of TSC1 in HGSOC could be partly due to the overexpression of miR-130a.
Figure 2.
miR-130a activates mTOR pathway and suppresses TSC1 expression by targeting its 3’UTR. (a) A2780 and SKOV3 cells were transfected with miR-130a, miR-27 and miR-204 mimics. Then miRNAs and TSC1 expression were measured by qPCR and western blot, respectively. (b) Western blot analysis of TSC1 and phosphorylation of mTOR, p70S6K, 4E-BP1in A2780 and SKOV3 cells transfected with miR-130a mimics or inhibitor. (c) The schematic graph shows three predicted binding sites of miR-130a in TSC1 3’UTR. The relative luciferase activity in A2780 cells with and without miR-130a overexpression was measured when transfected with WT and MT luciferase plasmids (mean±S.E.). (d) Relative expression of miR-130a in HGSOC (n=31) compared with normal fimbria (n=11) measured by qPCR. (e) Association analysis between TSC1 and miR-130a in HGSOC tissues. *P<0.05; **P<0.01;***P<0.001
miR-130a promotes proliferation/invasion and induces EMT of ovarian cancer cells in vitro
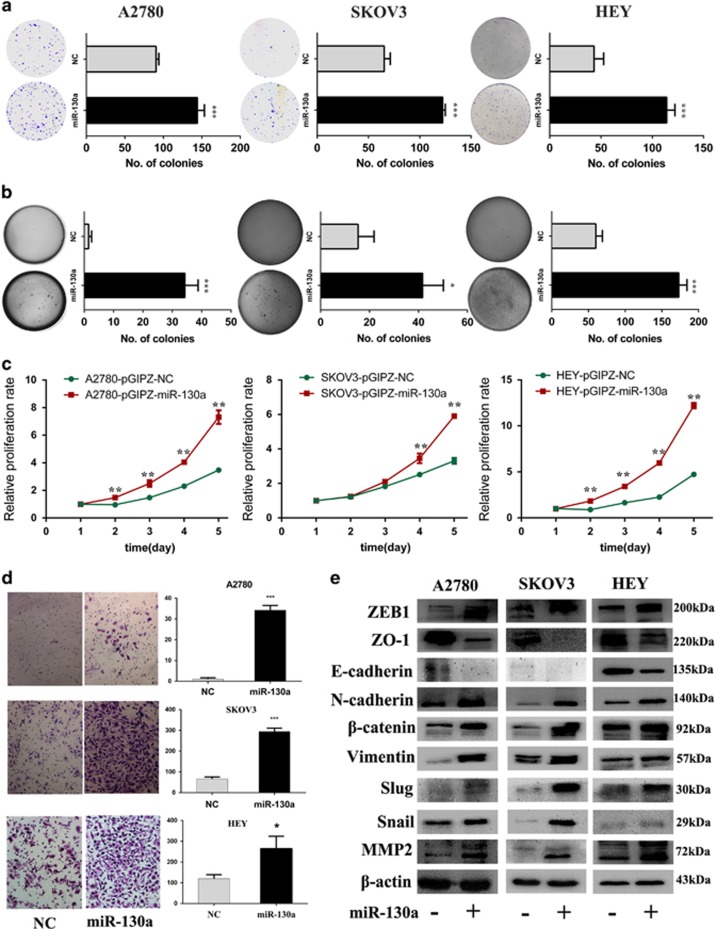
To investigate the functional role of miR-130a in ovarian cancers, we established three cell lines with stable miR-130a overexpression (Supplementary Figure S1b). We then evaluated the oncogenic properties of miR-130a on ovarian cancer cells. Overexpression of miR-130a significantly increased the colony-forming efficiency and anchorage-independent cell growth in ovarian cancer cells (Figures 3a and b), whereas miR-130a inhibitor reduced the clonogenicity in A2780 cells (Supplementary Figure S3a). Overexpression of miR-130a could also significantly enhance the proliferation of ovarian cancer cells (Figure 3c). Moreover, miR-130a dramatically enhanced the invasive capacity of ovarian cancer cell lines (Figure 3d), and inhibition of miR-130a decreased invasion potential in HEY cells (Supplementary Figure S3b). In addition, we measured epithelial-mesenchymal transition (EMT) markers by western blot. As shown in Figure 3e, overexpression of miR-130a decreased epithelial markers (E-cadherin and ZO-1) and elevated the levels of mesenchymal markers (Vimentin, N-cadherin, β-catenin, MMP2, ZEB1, Snail and Slug). Inhibition of miR-130a in HEY cells reduced the levels of mesenchymal markers (Supplementary Figure S3c). Our findings support the view that miR-130a overexpression enhances proliferation/invasion and induces EMT in ovarian cancer cell lines.
Figure 3.
miR-130a promotes proliferation/invasion and induces EMT of ovarian cancer cells in vitro. (a, b) The clonogenic assay and soft agar assay were performed to measure the effect of miR-130a on clonogenic ability and anchorage-independent growth in A2780, SKOV3 and HEY cell lines respectively. (c) Growth curves illustrated the cell proliferation from day 1 to 5 in A2780, SKOV3 and HEY cell lines. (d) Matrigel invasion was performed in A2780, SKOV3 and HEY cell lines with and without miR-130a overexpression. (e) EMT-related markers were detected by western blot in A2780, SKOV3 and HEY cells lines with and without miR-130a overexpression. *P<0.05; **P<0.01;***P<0.001
miR-130a attenuates rapamycin and starvation-induced autophagy in ovarian cancer cells
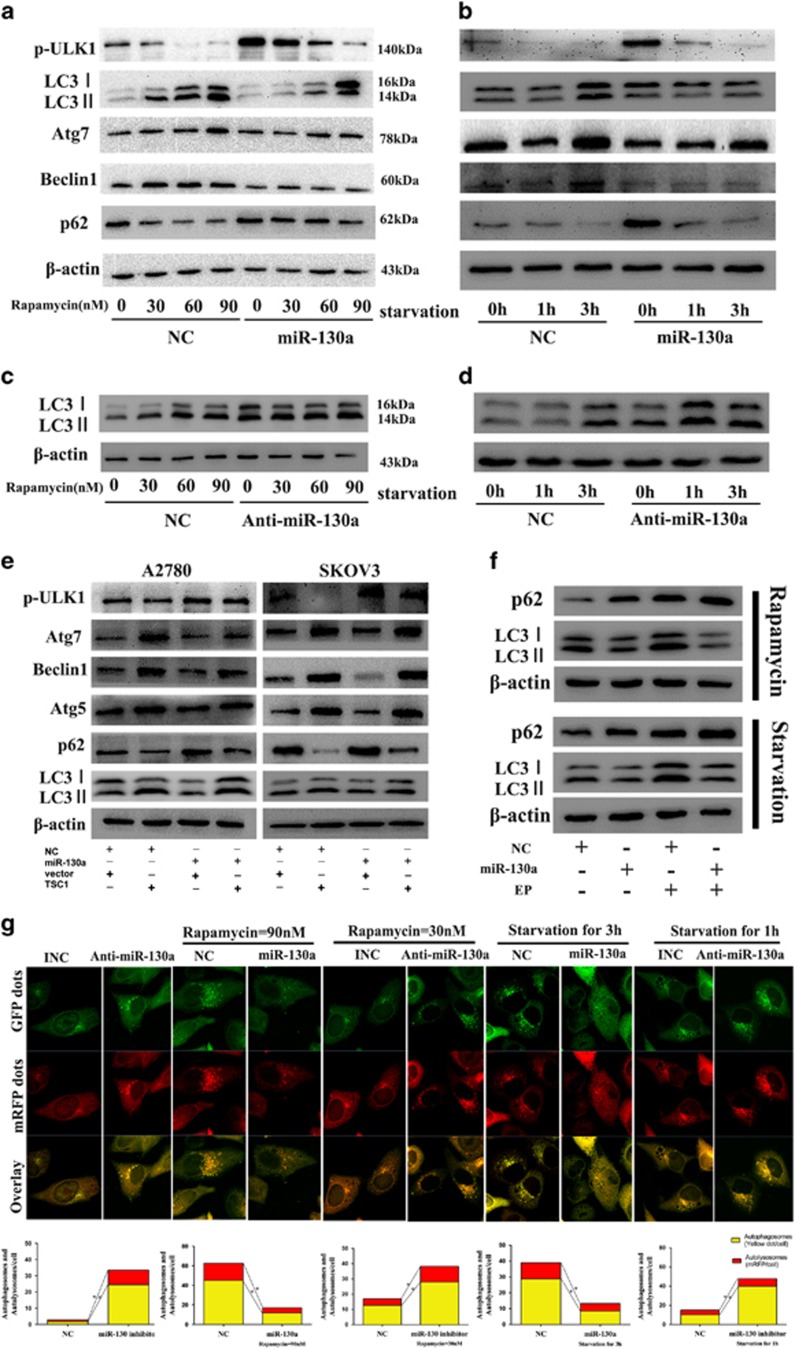
As miR-130a could activate mTOR signaling pathway by targeting TSC1, we speculated that miR-130a might affect mTOR-dependent autophagy. We first measured the expression of autophagy-related proteins by western blot. As shown in Figures 4a and b, overexpression of miR-130a significantly impaired LC3-II accumulation induced by rapamycin and starvation. Upregulation of ATG7, Beclin1, p-ULK1 and downregulation of p62 caused by rapamycin and starvation were attenuated as well. miR-130a inhibitor induced LC3-II accumulation in A2780 cells (Figure 4c and Supplementary Figure S2c). Inhibition of miR-130a expression could also enhanced LC3-II accumulation induced by rapamycin or starvation (Figures 4c and d). We then tested whether restoration of TSC1 could reduce the autophagy-blocking effect of miR-130a. As shown in Figure 4e, TSC1 expression partly offset the effect of miR-130a. We next measured the level of LC3-II and p62 in the presence or absence of lysosomal protease inhibitor E64D and PepA. As shown in Figure 4f, E64D and PepA treatment led to accumulation of LC3-II and p62 in A2780 cells without miR-130a. Overexpressing miR-130a significantly blocked LC3-II accumulation compared with control cells in the presence of E64D and PepA. Moreover, we monitored autophagic flux by confocal microscopy in A2780 cells infected with GFP-RFP-LC3 adenovirus. As shown in Figure 4g, overexpression of miR-130a significantly blocked rapamycin (90 nM) or starvation (3 h) induced autophagic flux. While inhibition of miR-130a, on the other hand, increased both yellow and red puncta number in rapamycin (30 nM) or starvation (1 h) induced autophagy. These findings suggest that miR-130a can block rapamycin or starvation induced autophagy in ovarian cancer cells.
Figure 4.
miR-130a attenuates rapamycin and starvation-induced autophagy in ovarian cancer cells. (a, b) Autophagy-related markers (p-ULK1, LC3, Atg 7 and Beclin1 and p62) were tested by western blot in rapamycin/starvation treated A2780 cells with and without miR-130a overexpression. (c,d) Western blot analysis of LC3 expression in rapamycin or starvation treated A2780 cells transfected with miR-130a inhibitor or not. (e) Restoration of TSC1 could partly rescued miR-130a blocked autophagy in A2780 and SKOV3 cells treated with rapamycin (60 nM). (f) LC3-II and p62 expression was measured by western blot in A2780 cells with and without miR-130a overexpression in the presence or absence of lysosomal protease inhibitor E64D and PepA. (g) After transfection of A2780 cells with NC or miR-130a/anti-miR-130a, cells were infected with GFP-RFP-LC3 adenovirus for 24 h, then cells were dealt with starvation or rapamycin. Autophagic flux was monitored by confocal microscopy. The mean number of autophagosomes per cell (yellow puncta in merged images) and autolysosomes (red puncta in merged images) were counted. *P<0.05
Restoration of TSC1 expression reverses miR-130a driven ovarian cancer cell proliferation and migration
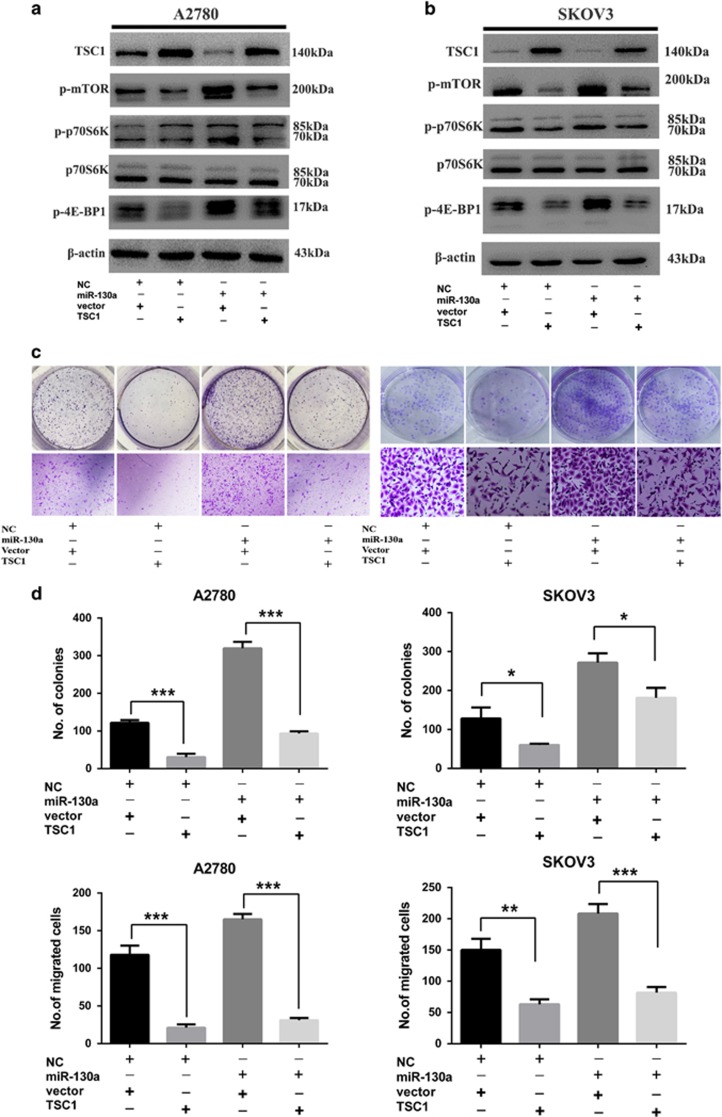
To further prove TSC1 downregulation as a mediator of miR-130a in ovarian cancer cells, we performed rescue experiment by co-transfecting miR-130a and TSC1 overexpression construct without 3’UTR into A2780 and SKOV3 cells, respectively. The transfection efficiency was evaluated by quantitative real-time PCR (qPCR) and western blot (Figures 5a and b and Supplementary Figure S2a-b). Ectopic TSC1 expression attenuated the increase in colony-forming efficiency and the invasiveness caused by miR-130a mimics in A2780 and SKOV3 cells (Figures 5c and d). These data demonstrate that TSC1 is a direct functional target of miR-130a in human ovarian cancer and downregulation of TSC1 in HGSOC may be due to the overexpression of miR-130a.
Figure 5.
Restoration of TSC1 expression reverses miR-130a driven ovarian cancer cell proliferation and invasion. (a, b) Western blot showed the activation of the mTOR pathway can be rescued by TSC1 overexpression in A2780 and SKOV3 cell lines. (c,d) The colony formation assay and Transwell assay revealed that the promotion effect of proliferation and migration caused by miR-130a could be suppress by introduction of TSC1. *P<0.05; **P<0.01; ***P<0.001
NF-κB transactivates miR-130a in ovarian cancer cells
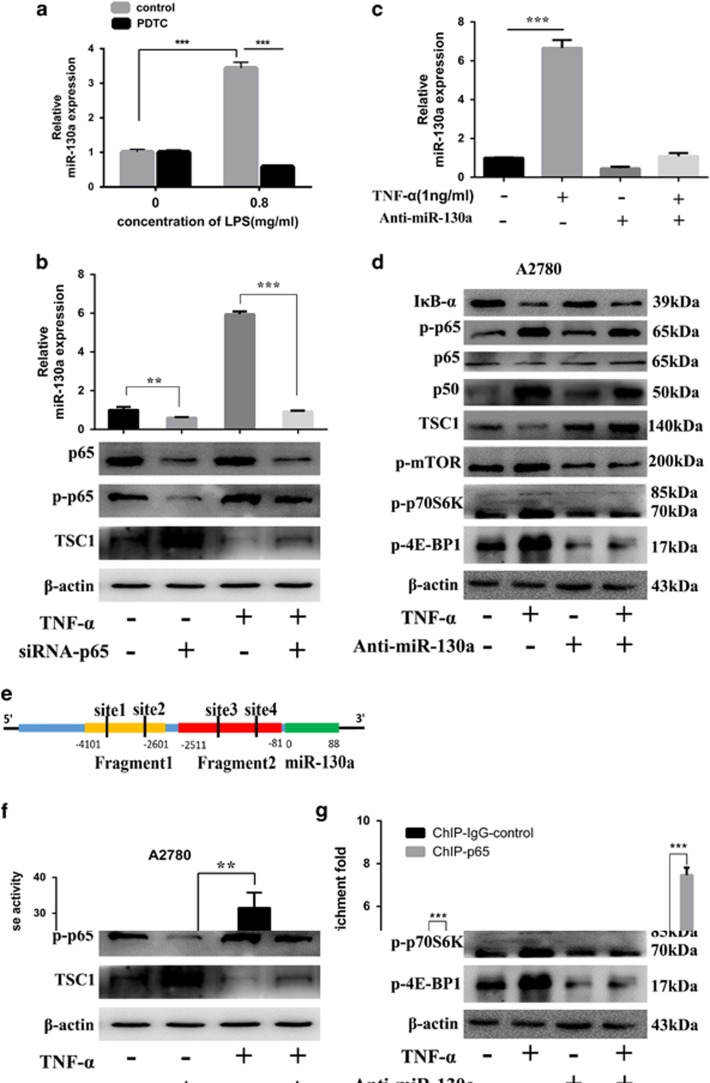
miR-130a has been shown to be transcriptionally upregulated by NF-κB in human biliary epithelial cells and cervical cancer cells. We next determined whether overexpression of miR-130a in HGSOC was regulated by NF-κB. LPS stimulation significantly increased miR-130a expression in A2780 cells whereas inhibition of NF-κB activation by pyrrolidine dithiocarbamate significantly reduced miR-130a expression triggered by LPS (Figure 6a). NF-κB p65 siRNA was used to further evaluate the role of NF-κB in regulation of miR-130a expression. As shown in Figure 6b, p65 inhibition significantly repressed miR-130a expression and attenuated TNF-α induced miR-130a expression. Importantly, TNF-α (1 ng/ml) treatment increased miR-130a expression (Figure 6c), suppressed TSC1 expression and activated mTOR signaling pathway in A2780 cells (Figure 6d). Inhibition of miR-130a rescued the downregulation of TSC1 and activated mTOR signaling pathway caused by TNF-α (Figure 6d). We next investigated whether the miR-130a pri-miRNA is directly regulated by NF-κB. We examined the role of the predicted transcriptional binding sites (Figure 6e) in induction of miR-130a expression by promoter constructs (PGL4.21) in a luciferase reporter assay. As shown in Figure 6f, fragment 2, which is located close to the transcriptional start site, yielded a robust transcriptional activity induced by TNF-α. To further confirm miR-130a expression is dependent on NF-κB, we performed chromatin immunoprecipitation (ChIP) analysis using anti-NF-κB p65 antibody in A2780 cells in the presence or absence of TNF-α treatment. As shown in Figure 6g, Treatment with TNF-α significantly induced NF-κB binding to miR-130a promoter region (site1, site3 and site 4). Site 4 showed significant NF-κB binding in the absence of TNF-α. Taken together, the above data suggest that NF-κB transcriptionally upregulates miR-130a expression and consequently activates mTOR signaling pathway in response to inflammatory stimuli.
Figure 6.
NF-κB transcriptionally upregulates miR-130a in ovarian cancer cells. (a) Relative expression of miR-130a in A2780 cells after treatment with LPS at different concentrations in the presence or absence of PDTC (40 μM). (b) NF-κB p65 siRNA was used to examine the relationship between NF-κB and the expression of miR-130a. (c,d) miR-130a inhibitor suppressed TNF-α induced miR-130a expression and rescued the downregulation of TSC1 caused by TNF-α. (e) miR-130a genomic structure: miR-130a promoter is in blue and pri-miR-130a encoding region is in green. The four sites in black were predicted by PROMO. (f) Luciferase activity was measured in A2780 cells transfected with PGL4 plasmid containing NF-κB response elements (Fragment 1 or 2) in the presence or absence of TNF-α. (g) Binding of NF-κB to the promoter region of miR-130a was analyzed by ChIP assays in A2780 cells with or without TNF-α. **P<0.01; ***P<0.001
miR-130a promotes primary tumor growth and metastasis of xenografts
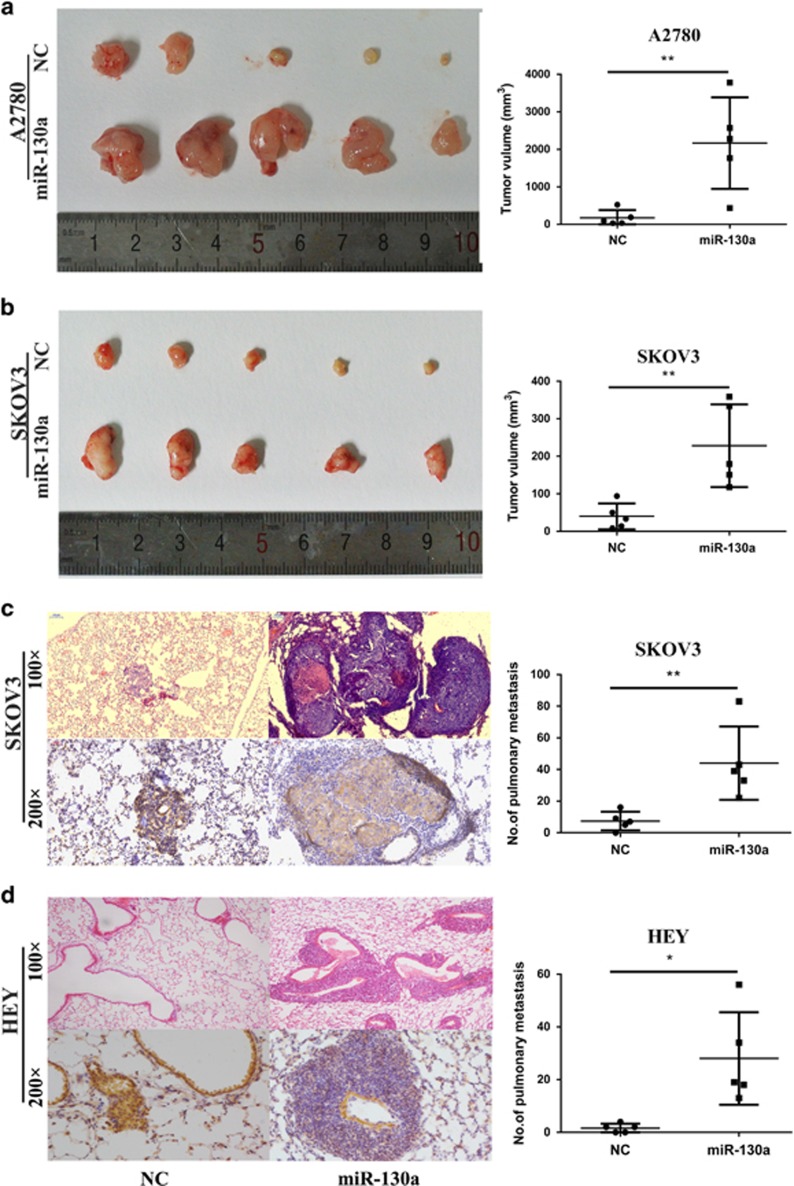
To further explore the role of miR-130a in tumor growth in vivo, A2780 and SKOV3 cells with and without miR-130a overexpression were subcutaneously inoculated in nude mice (five mice in each group). After 2 weeks, the mice were killed under anesthesia and tumor volumes were calculated. We found that the average tumor size of miR-130a overexpression groups was much bigger than that of the control groups in two injected cell lines (Figures 7a and b). To further evaluate the effect of miR-130a on tumor metastasis in vivo, SKOV3 and HEY cells with stable miR-130a overexpression and control cells were injected into nude mice through tail vein (five mice in each group). The numbers and size of lung metastasis nodules were examined 6–8 weeks after injections. As shown in Figures 7c and d, both the number and volume of lung metastatic nodules were increased in miR-130a overexpression groups compared with control groups. Meanwhile we examined the level of TSC1 by immunohistochemical staining in metastatic tumors. Accordingly, SKOV3 and HEY metastatic tumors with miR-130a overexpression showed reduced TSC1 expression. Our findings indicate that miR-130a overexpression in ovarian cancer cell lines enhances tumor growth and metastasis in vivo.
Figure 7.
miR-130a overexpression promotes tumor growth and metastasis in xenograft. (a, b) Photographs illustrated tumors in xenografts of A2780 and SKOV3 cell lines with or without miR-130a overexpression (n=5). (c,d) The representative images of hematoxylin and eosin (HE)-staining and immunohistochemical staining of TSC1 in lungs isolated from mice that received tail vein injection of SKOV3 and HEY cell lines with and without miR-130a overexpression (n=5). Plot graph illustrates the total numbers of pulmonary metastatic nodules under microscope. *P<0.05; **P<0.01
Discussion
The TSC1/TSC2 tumor suppressor complex serves as a repressor of the mTOR pathway, and disruption of TSC1/TSC2 complex function may contribute to tumorigenesis.11 Low levels of TSC1 are associated with poor clinical outcome in breast cancer13 and gastric cancer.14 In this study, we showed that TSC1 was frequently downregulated in HGSOC. Low TSC1 expression level is associated with advanced tumor stage. Previous studies have shown that inactivation of TSC1 may be caused by multiple ways including mutation, LOH and methylation.8 Here we identified that miR-130a suppressed TSC1 expression at post-transcriptional level and activated mTOR pathway. miR-130a has been shown to be upregulated in gastric cancer and non-small cell lung cancer tissues and high level of miR-130a is associated with poor prognosis.15, 16 miR-130a activates YAP and promotes tumorigenesis by repressing VGLL4.17 Our previous study showed that miR-130a was significantly upregulated in HGSOC.18 In this study, we demonstrated that overexpression of miR-130a promotes ovarian cancer proliferation and invasion/metastasis in vitro and in vivo. However, miR-130a was reported to be downregulated in prostate carcinoma19 and squamous cell lung carcinoma.20 Therefore, the role of miR-130a in oncogenesis could be cancer type-dependent.
Recently, it is reported that TNF-α activates mTOR signaling through phosphorylation and inactivation of TSC1 by IKKβ, and enhances angiogenesis.11 Other study showed that TNF-α could activate AKT to inactivate TSC1 and TSC2 and then results in mTOR activation.21 IKKα is shown to phosphorylate mTOR at serine 1415 in a manner dependent on Akt to promote mTORC1 activity.22 On the other hand, the TSC1-TSC2 complex modulates NF-κB activity by regulating Akt and ERK1/2 signaling cascades that lead to NF-κB activation.23 Our study identified a new mechanism by which TNF-α activates mTOR. TNF-α upregulates miR-130a, which activates mTOR signaling pathway by suppressing TSC1 expression. However, another study demonstrated that miR-99a inhibited the mTOR expression, suppressed the nuclear translocation of NF-κB, and resulted in the attenuation of inflammation.24
miRNAs are involved in regulation of autophagy. miR-30a could negatively regulate autophagic activity through targeting Beclin1.25 miR-376b modulated autophagy through its effects on ATG4C and BECN1 levels.26 Other miRNAs involved in autophagy regulation include miR-181a,27 miR-10128 and miR-17 family.29 miR-130a inhibited autophagy by reducing autophagosome formation via downregulation of ATG2B and DICER1.30 Our results showed that miR-130a blocked rapamycin-induced autophagy by targeting TSC1.Therefore, miR-130a may modulate autophagy by targeting different autophagy-related genes.
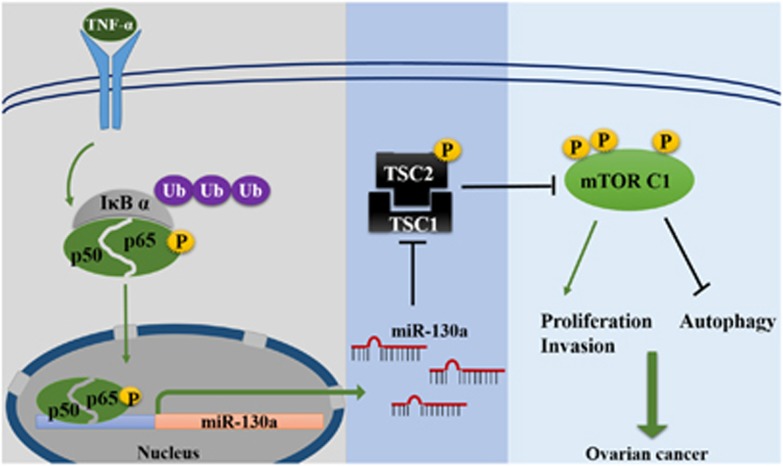
Taken together, our results show that TSC1 is frequently downregulated in HGSOC and low TSC1 expression level is associated with advanced tumor stage. miR-130a is overexpressed in HGSOC and suppresses TSC1 expression by targeting its 3’UTR. Furthermore, in response to inflammatory stimuli, NF-κB transcriptionally upregulates miR-130a expression in ovarian cancer cells. The proposed miR-130a signaling in HGSOC s is summarized in Figure 8. Therefore, our findings establish a new link between inflammation and mTOR signaling pathway in HGSOC.
Figure 8.
Proposed model of miR-130a mediated dysregulation of mTOR pathway in HGSOC. NF-κB transcriptionally upregulates miR-130a expression and consequently activates mTOR signaling pathway in response to inflammatory stimuli
Materials and methods
Patients and tissue samples
The retrospective study included 109 cases of HGSOC, 43 cases of fallopian tube tissues which were collected in Qilu Hospital from April 2009 to July 2015. The HGSOC specimens were from primary ovarian cancer patients with no surgery or chemotherapy previously. Fallopian tube tissues were from patients who received a total hysterectomy and bilateral salpingo-oophorectomy for uterine diseases or benign neoplastic adnexal pathologic changes. Ethics Committee of Shandong University approved the study and all participants gave written informed consent. The clinic pathologic characteristics were shown in Supplementary Table 1.
Cell lines and cell culture
A2780 and HEK293T cell lines were purchased from China Type Culture Collection (Shanghai, China) and HEY, SKOV3 cell lines were purchased from American Type Culture Collection. They were all cultured in Dulbecco’s modified Eagle’s medium (Gibco, Grand Island, NY, USA). All media contained 10% FBS. All cells were cultured at 37 °C with 5% CO2 in a humidified incubator (Thermo Fisher Scientific, Waltham, MA, USA).
RNA isolation and qPCR
Total RNA was extracted from cultured cells or fresh tissues with Trizol reagents (Invitrogen, Carlsbad, CA, USA) following the manufacturer’s instructions. qPCR was performed to test miRNA and mRNA expression using the Bio-Rad CFX96 real-time PCR detection system. Primer information used in the study are shown in Supplementary Table 3.
Oligonucleotide transfection
Mimics and inhibitor (Gene pharma, Shanghai, China) of miRNA and the corresponding negative control were transfected into ovarian cancer cells using lipofectamine 2000 (Invitrogen) according to the manufacturer’s protocol. Transfection was performed at 50 nM for mimics and 100 nM for inhibitor. NF-κB p65 siRNA transfection was performed as described previously.31
Western blot analysis
The samples were lysed and protein concentration was determined using the BCA assay (Beyotime Institute of Biotechnology, China). Protein samples were separated by SDS–PAGE and electro-transferred onto PVDF membrane. The membrane was incubated overnight with primary antibodies at 4°C. Proteins of interest were detected with appropriate horseradish peroxidase-conjugated secondary antibodies and developed using ECL system (GE Healthcare, Little chalfont, Buckinghamshire, UK). Antibodies in this study included: anti-TSC1 (Abcam, Cambridge, MA, USA, ab40872), anti-p70S6K (CST, 2708), anti-phospho-p70S6K (Thr389, CST, 9234), anti-phospho-mTOR (Ser2448, CST, 5536), anti-phospho-4E-BP1 (Thr37/46, CST, 9459 S), anti-p50 (CST,12540), anti-p65 (CST, 8242), anti-phospho-NF-κB p65 (Ser536, CST, 8214), anti-IκB-α (SANTA, SC1643), anti-LC3 (CST, 1274ES), anti-Beclin1 (CST, 3495 P), anti-Atg 7 (CST, 8558 P), anti-Atg5 (Proteintech, Wuhan, Hubei province, China, D1903990025), anti-p62 (CST, 5114 S), anti-phospho-ULK1 (Ser757, CST, 14202), anti-E-Cadherin (CST, 3995), anti-N-Cadherin (CST, 13116), anti-Vimentin (CST, 5741), anti-β-Catenin (CST, 8480), anti-ZO-1(CST, 8193), anti-Snail (CST, 3879), anti-Slug (CST, 9585), anti-ZEB1 (CST, 3396), anti-MMP2 (CST, 13132).
Lentiviral vector construction, viral production and infection
A 573- bp fragment containing pre-miR-130a was cloned into pGIPZ vector. Lentivirus expressing miR-130a or negative control was produced in HEK293T cells packaged by pMD2G and psPAX2. For stable infection, cells were infected with lentivirus for 24 h and then selected for 2 weeks in medium containing 2 μg/ml puromycin (Merck Millipore, Billerica, MA, USA) to acquire stable expression cells.
Clonogenic assay
The cells were seeded in a six-well plate (500–1000 cells per well) and cultured for 2–3 weeks. The colonies were fixed with methanol, and stained with 0.1% crystal violet, and the number of clonies containing >50 cells was counted. The data presented are the mean±S.E. and represents three independent experiments.
Soft agar colony formation assay
Cells were suspended in a low density (0.75 × 10⁴cells) in 3 ml of culture medium containing 0.7% agar (USB Corporation, Cleveland, OH, USA) and seeded onto a base layer of 3 ml of 1% agar bed in 60-mm tissue culture dishes. After 2–4 weeks, colonies were stained with 0.05% crystal violet, photographed and scored.
Matrigel invasion assay
Matrigel invasion assay was performed in 24-well matrigel coated chambers with 8 μm pores (BD falcon, Bedford, MA, USA). A total of 10–15 × 104 cells were plated into the upper chambers in medium containing no FBS, and lower chambers were filled with culture media containing 20% FBS as a chemo-attractant. The chambers were incubated at 37 °C for 12–48 h depending on different cell lines. Successfully invaded cells were fixed and stained with 0.1% crystal violet for 15 min, and counted under a light microscope.
Cell proliferation assay
MTT assay was used to examine cell viability. Cells were seeded in 96-well plates in triplicate at densities of 1 × 10³ cells per well. Cell proliferation was monitored at different times (1–5 days). After incubation at designated times, 10 μl MTT reagent (5 mg/ml) was added to each well and continued to incubate for 4 h at 37 °C. Subsequently, 100 μl of DMSO was added to each well. The absorbance at 490 nm was measured using a microplate reader (Bio-Rad, Hercules, CA, USA). All experiments were repeated at least three times.
Confocal imaging
Autophagic flux was monitored by confocal microscopy. In brief, after transfected with miR-130a mimics or inhibitor, A2780 cells were then infected with GFP-RFP-LC3 adenovirus. Confocal microscopy (Carl Zeiss, LSM780, Jena, Germany) analysis was used to measure autophagosomes (yellow puncta in merged images) and autolysosomes (red puncta in merged images) treated with rapamycin or starvation.
In vivo nude mice tumorigenesis and metastasis assay
For xenograft experiment, A2780 and SKOV3 cells with and without miR-130a overexpression (5 × 10⁶ cells in 100 μl PBS) were injected subcutaneously into 4–5 weeks-old BALB/c nu/nu female mice (n=5). After 2 weeks, the mice were killed under anesthesia and tumor volume was calculated according to the formula TV (cm3) =a × b2 × π/6, where ‘a’ is the longest diameter, and ‘b’ is the shortest diameter. For lung metastasis experiments, SKOV3 and HEY cells with and without miR-130a overexpression (5 × 10⁶ cells) were injected via tail veins of 6–8 weeks-old NOD/SCID mice (n=5). After 8 weeks, mice were killed under anesthesia. The lungs were collected and fixed in 10% formalin and embedded in paraffin. Hematoxylin and eosin (H&E) staining and immunohistochemistry was performed on sections from embedded samples. The numbers of metastatic tumors and sizes were measured microscopically.
Immunohistochemistry staining
Formalin-fixed and paraffin-embedded tissues were sectioned at 4 μm. Tissue slides were deparaffinized in xylene and rehydrated in a graded series of ethanol. Antigen retrieval was performed by microwave heating. Nonspecific antigens were blocked with 1.5% normal goat serum. Primary antibody for TSC1 (1:300 dilution) was incubated on the slides overnight at 4 °C. Then the slides were incubated with secondary antibody and sections were then stained with diaminobenzidine and counterstained with hematoxylin. Both The H&E and Immunohistochemistry stained slides were scanned in totality on a Panoramic MIDI digital scanner (3DHISTECH Ltd., Budapest, Hungary) and representative areas were selected for images using the Panoramic viewer software. The final score of each sample was determined by two pathologists on the basis of intensity and extent of staining across the section.
Luciferase reporter assay
For 3′UTR sensor luciferase assay, 3’UTR of TSC1 containing three putative miR-130a-binding sites (951 nt) was cloned into pmirGLO vector (Promega Corporation, Madison, WI, USA). Mutant construct was generated by overlap extension PCR. A2780 cells were co-transfected with constructs and miR-130a mimics or negative control. After 48 h of transfection, luciferase activity was measured using the Dual-Glo Luciferase Assay System (Promega). For promoter reporter assay, PGL4 plasmids containing miR-130a promoter (generously provided by Dr Bin Zhao at Zhejiang University17) were transfected into A2780 cells. Twenty-four hours later, cells were treated with TNF-α (1 ng/ml) for 2 hours. Then cells were lysed and the intracellular luciferase activity was measured accordingly.
Chromatin immunoprecipitation assay
ChIP assay was performed using the ChIP kit (Millipore, Billerica, MA, USA) according to manufacturer’s protocol. Briefly, A2780 cells were treated with or without TNF-α for 2 hours. The cells were then cross-linked, lysed and sonicated. Cell extracts were then immunoprecipitated with anti-p65 antibody (mouse IgG as negative control). The purified DNA was analyzed by quantitative PCR. Sequences of all primer pairs used in this study are listed in Supplementary Table 3.
Statistics analysis
The software SPSS V20.0 was used for statistical analysis. Student’s t-test and one-way ANOVA analysis were used to determine significance. Results represent the mean±S.D. of three independent experiments. P<0.05 was considered statistically significant.
Acknowledgments
PGL4 plasmids containing miR-130a promoter was kindly provided by Dr. Bin Zhao at Zhejiang University. This study was supported by The National Natural Science Foundation of China (81472432, 81672578, 81272857, 81401145, 31571321).
Footnotes
Supplementary Information accompanies this paper on Cell Death and Differentiation website (http://www.nature.com/cdd)
Edited by M Piacentini
The authors declare no conflict of interest.
Supplementary Material
References
- Laplante M, Sabatini DM. mTOR signaling in growth control and disease. Cell 2012; 149: 274–293. [DOI] [PMC free article] [PubMed] [Google Scholar]
- Easton JB, Houghton PJ. mTOR and cancer therapy. Oncogene 2006; 25: 6436–6446. [DOI] [PubMed] [Google Scholar]
- Mabuchi S, Kuroda H, Takahashi R, Sasano T. The PI3K/AKT/mTOR pathway as a therapeutic target in ovarian cancer. Gynecol Oncol 2015; 137: 173–179. [DOI] [PubMed] [Google Scholar]
- No JH, Jeon YT, Park IA, Kim YB, Kim JW, Park NH et al. Activation of mTOR signaling pathway associated with adverse prognostic factors of epithelial ovarian cancer. Gynecol Oncol 2011; 121: 8–12. [DOI] [PubMed] [Google Scholar]
- Chong-Kopera H, Inoki K, Li Y, Zhu T, Garcia-Gonzalo FR, Rosa JL et al. TSC1 stabilizes TSC2 by inhibiting the interaction between TSC2 and the HERC1 ubiquitin ligase. J Biol Chem 2006; 281: 8313–8316. [DOI] [PubMed] [Google Scholar]
- Henske EP, Jozwiak S, Kingswood JC, Sampson JR, Thiele EA. Tuberous sclerosis complex. Nat Rev Dis Primers 2016; 2: 16035. [DOI] [PubMed] [Google Scholar]
- Tee AR, Manning BD, Roux PP, Cantley LC, Blenis J. Tuberous sclerosis complex gene products, Tuberin and Hamartin, control mTOR signaling by acting as a GTPase-activating protein complex toward Rheb. Curr Biol 2003; 13: 1259–1268. [DOI] [PubMed] [Google Scholar]
- Liang MC, Ma J, Chen L, Kozlowski P, Qin W, Li D et al. TSC1 loss synergizes with KRAS activation in lung cancer development in the mouse and confers rapamycin sensitivity. Oncogene 2010; 29: 1588–1597. [DOI] [PMC free article] [PubMed] [Google Scholar]
- Chakraborty S, Mohiyuddin SM, Gopinath KS, Kumar A. Involvement of TSC genes and differential expression of other members of the mTOR signaling pathway in oral squamous cell carcinoma. BMC Cancer 2008; 8: 163. [DOI] [PMC free article] [PubMed] [Google Scholar]
- Inoki K, Li Y, Zhu T, Wu J, Guan KL. TSC2 is phosphorylated and inhibited by Akt and suppresses mTOR signalling. Nat Cell Biol 2002; 4: 648–657. [DOI] [PubMed] [Google Scholar]
- Lee DF, Kuo HP, Chen CT, Hsu JM, Chou CK, Wei Y et al. IKK beta suppression of TSC1 links inflammation and tumor angiogenesis via the mTOR pathway. Cell 2007; 130: 440–455. [DOI] [PubMed] [Google Scholar]
- Song L, Su M, Wang S, Zou Y, Wang X, Wang Y et al. MiR-451 is decreased in hypertrophic cardiomyopathy and regulates autophagy by targeting TSC1. J Cell Mol Med 2014; 18: 2266–2274. [DOI] [PMC free article] [PubMed] [Google Scholar]
- Jiang WG, Sampson J, Martin TA, Lee-Jones L, Watkins G, Douglas-Jones A et al. Tuberin and hamartin are aberrantly expressed and linked to clinical outcome in human breast cancer: the role of promoter methylation of TSC genes. Eur J Cancer 2005; 41: 1628–1636. [DOI] [PubMed] [Google Scholar]
- Byeon SJ, Han N, Choi J, Kim MA, Kim WH. Prognostic implication of TSC1 and mTOR expression in gastric carcinoma. J Surg Oncol 2014; 109: 812–817. [DOI] [PubMed] [Google Scholar]
- Jiang H, Yu WW, Wang LL, Peng Y. miR-130a acts as a potential diagnostic biomarker and promotes gastric cancer migration, invasion and proliferation by targeting RUNX3. Oncol Rep 2015; 34: 1153–1161. [DOI] [PMC free article] [PubMed] [Google Scholar]
- Wang XC, Tian LL, Wu HL, Jiang XY, Du LQ, Zhang H et al. Expression of miRNA-130a in nonsmall cell lung cancer. Am J Med Sci 2010; 340: 385–388. [DOI] [PubMed] [Google Scholar]
- Shen S, Guo X, Yan H, Lu Y, Ji X, Li L et al. A miR-130a-YAP positive feedback loop promotes organ size and tumorigenesis. Cell Res 2015; 25: 997–1012. [DOI] [PMC free article] [PubMed] [Google Scholar]
- Liu Z, Liu J, Segura MF, Shao C, Lee P, Gong Y et al. MiR-182 overexpression in tumourigenesis of high-grade serous ovarian carcinoma. J Pathol 2012; 228: 204–215. [DOI] [PubMed] [Google Scholar]
- Boll K, Reiche K, Kasack K, Morbt N, Kretzschmar AK, Tomm JM et al. MiR-130a, miR-203 and miR-205 jointly repress key oncogenic pathways and are downregulated in prostate carcinoma. Oncogene 2013; 32: 277–285. [DOI] [PubMed] [Google Scholar]
- Gao W, Shen H, Liu L, Xu J, Xu J, Shu Y. MiR-21 overexpression in human primary squamous cell lung carcinoma is associated with poor patient prognosis. J Cancer Res Clin Oncol 2011; 137: 557–566. [DOI] [PMC free article] [PubMed] [Google Scholar]
- Ozes ON, Akca H, Mayo LD, Gustin JA, Maehama T, Dixon JE et al. A phosphatidylinositol 3-kinase/Akt/mTOR pathway mediates and PTEN antagonizes tumor necrosis factor inhibition of insulin signaling through insulin receptor substrate-1. Proc Natl Acad Sci USA 2001; 98: 4640–4645. [DOI] [PMC free article] [PubMed] [Google Scholar]
- Dan HC, Ebbs A, Pasparakis M, Van Dyke T, Basseres DS, Baldwin AS. Akt-dependent activation of mTORC1 complex involves phosphorylation of mTOR (mammalian target of rapamycin) by IkappaB kinase alpha (IKKalpha). J Biol Chem 2014; 289: 25227–25240. [DOI] [PMC free article] [PubMed] [Google Scholar]
- Ghosh S, Tergaonkar V, Rothlin CV, Correa RG, Bottero V, Bist P et al. Essential role of tuberous sclerosis genes TSC1 and TSC2 in NF-kappaB activation and cell survival. Cancer Cell 2006; 10: 215–226. [DOI] [PubMed] [Google Scholar]
- Bao MH, Li JM, Luo HQ, Tang L, Lv QL, Li GY et al. NF-kappaB-regulated miR-99a modulates endothelial cell inflammation. Mediators Inflamm 2016; 2016: 5308170. [DOI] [PMC free article] [PubMed] [Google Scholar]
- Zhu H, Wu H, Liu X, Li B, Chen Y, Ren X et al. Regulation of autophagy by a beclin 1-targeted microRNA, miR-30a, in cancer cells. Autophagy 2009; 5: 816–823. [DOI] [PMC free article] [PubMed] [Google Scholar]
- Korkmaz G, le Sage C, Tekirdag KA, Agami R, Gozuacik D. miR-376b controls starvation and mTOR inhibition-related autophagy by targeting ATG4C and BECN1. Autophagy 2012; 8: 165–176. [DOI] [PubMed] [Google Scholar]
- Tekirdag KA, Korkmaz G, Ozturk DG, Agami R, Gozuacik D. MIR181A regulates starvation- and rapamycin-induced autophagy through targeting of ATG5. Autophagy 2013; 9: 374–385. [DOI] [PMC free article] [PubMed] [Google Scholar]
- Frankel LB, Wen J, Lees M, Hoyer-Hansen M, Farkas T, Krogh A et al. microRNA-101 is a potent inhibitor of autophagy. EMBO J 2011; 30: 4628–4641. [DOI] [PMC free article] [PubMed] [Google Scholar]
- Meenhuis A, van Veelen PA, de Looper H, van Boxtel N, van den Berge IJ, Sun SM et al. MiR-17/20/93/106 promote hematopoietic cell expansion by targeting sequestosome 1-regulated pathways in mice. Blood 2011; 118: 916–925. [DOI] [PMC free article] [PubMed] [Google Scholar]
- Kovaleva V, Mora R, Park YJ, Plass C, Chiramel AI, Bartenschlager R et al. miRNA-130a targets ATG2B and DICER1 to inhibit autophagy and trigger killing of chronic lymphocytic leukemia cells. Cancer Res 2012; 72: 1763–1772. [DOI] [PubMed] [Google Scholar]
- Brisac C, Salloum S, Yang V, Schaefer EA, Holmes JA, Chevaliez S et al. IQGAP2 is a novel interferon-alpha antiviral effector gene acting non-conventionally through the NF-kappaB pathway. J Hepatol 2016; 65: 972–979. [DOI] [PMC free article] [PubMed] [Google Scholar]
Associated Data
This section collects any data citations, data availability statements, or supplementary materials included in this article.


