Abstract
The Hippo pathway plays essential roles in organ size control and cancer prevention via restricting its downstream effector, Yes‐associated protein (YAP). Previous studies have revealed an oncogenic function of YAP in reprogramming glucose metabolism, while the underlying mechanism remains to be fully clarified. Accumulating evidence suggests long noncoding RNAs (lncRNAs) as attractive therapeutic targets, given their roles in modulating various cancer‐related signaling pathways. In this study, we report that lncRNA breast cancer anti‐estrogen resistance 4 (BCAR4) is required for YAP‐dependent glycolysis. Mechanistically, YAP promotes the expression of BCAR4, which subsequently coordinates the Hedgehog signaling to enhance the transcription of glycolysis activators HK2 and PFKFB3. Therapeutic delivery of locked nucleic acids (LNAs) targeting BCAR4 attenuated YAP‐dependent glycolysis and tumor growth. The expression levels of BCAR4 and YAP are positively correlated in tissue samples from breast cancer patients, where high expression of both BCAR4 and YAP is associated with poor patient survival outcome. Taken together, our study not only reveals the mechanism by which YAP reprograms glucose metabolism, but also highlights the therapeutic potential of targeting YAP‐BCAR4‐glycolysis axis for breast cancer treatment.
Keywords: glycolysis, Hippo pathway, HK2, LncRNA, Yes‐associated protein
Subject Categories: Cancer, Metabolism, Signal Transduction
Introduction
Extensive genome profiling studies have identified hundreds of lncRNAs that are often aberrantly expressed in cancers. These lncRNAs play crucial roles in promoting and maintaining cancer cell characteristics, which makes them as attractive therapeutic targets (Fatica & Bozzoni, 2014; Xing et al, 2014; Lin et al, 2016, 2017). However, the cellular functions of lncRNAs in cancer development, especially their potential cross talk with cancer‐related signaling pathways, remain largely unknown. Our recent work identified one most upregulated lncRNA breast cancer anti‐estrogen resistance 4 (BCAR4) in triple negative breast cancer (TNBC) (Xing et al, 2014). Mechanistically, BCAR4 associates with SNIP1 and PNUTS to promote non‐canonical Hedgehog/GLI2 transcriptional program by modulating p300‐dependent histone acetylation, which eventually confers invasiveness and metastatic propensity for TNBC (Xing et al, 2014). However, how BCAR4 is regulated during breast cancer development is still unclear.
Over the past decades, the Hippo pathway has been established as a tumor suppressor pathway because it restricts proliferation and induces apoptosis (Pan, 2010; Zhao et al, 2010; Halder & Johnson, 2011; Zhou et al, 2015). Dysregulation of the Hippo pathway is associated with a broad spectrum of cancers (Pan, 2010; Harvey et al, 2013; Yu et al, 2015). However, the detailed tumor‐suppressive functions of the Hippo pathway have not yet been fully understood, owing to the lack of clear elucidation of its downstream effector Yes‐associated protein (YAP)'s oncogenic functions beyond proliferation and apoptosis. In mammalian systems, the Hippo pathway is composed of core kinases (MST1/2 and LATS1/2), adaptor proteins (WW45 for MST1/2 and MOB1 for LATS1/2), downstream effector (YAP/TAZ), and nuclear transcriptional factors (TEAD1/2/3/4). MST1/2 kinases phosphorylate and activate LATS1/2 kinases. Activated LATS1/2 kinases phosphorylate YAP at S127, which provides the docking site for 14‐3‐3 proteins to sequester YAP in cytoplasm. The dephosphorylated YAP translocates into the nucleus, associates with TEAD transcriptional factors, and promotes transcription of downstream genes, which are involved in cell proliferation and survival (Pan, 2010; Zhao et al, 2010; Halder & Johnson, 2011; Mo et al, 2015; Wang et al, 2015; Zhou et al, 2015).
Previous studies including ours revealed an intimate relationship between YAP and glucose homeostasis, where YAP was phosphorylated and suppressed by AMPK in glucose‐starved condition while active YAP promotes glycolysis featured with enhanced glucose uptake and lactate production (DeRan et al, 2014; Gailite et al, 2015; Mo et al, 2015; Wang et al, 2015). Most cancer cells majorly rely on aerobic glycolysis to generate energy to support their cellular activities instead of more efficient mitochondrial oxidative phosphorylation, a phenomenon known as the Warburg effect, resulting in an accelerated rate of glucose consumption with enhanced lactate production regardless of oxygen availability (Mihaylova & Shaw, 2011; Hardie et al, 2012; Lin et al, 2014, 2016). This uncovered function of YAP in promoting Warburg effect highlights the necessity to further explore its in‐depth mechanisms, since it will not only help to better understand the role of YAP in regulating nutrient availability, but more importantly assess the translational potential via targeting YAP‐dependent glycolysis.
In this study, we uncovered lncRNA BCAR4 as a downstream target of YAP. Together with Hedgehog effector GLI2, BCAR4 is involved in the YAP‐dependent glycolysis by promoting the transcription of two glycolysis activators, HK2 and PFKFB3. Intriguingly, targeting BCAR4/GLI2‐HK2/PFKFB3 axis by using either BCAR4 antisense‐locked nucleic acid (LNA) or HK2 and PFKFB3 inhibitors dramatically suppressed the YAP‐dependent glycolysis, cell proliferation, and tumorigenesis. Pathologically, the expression of BCAR4 is positively correlated to that of YAP in breast cancer patient samples, where low level of both BCAR4 and YAP favors the recurrence‐free survival ratio for breast cancer patients. Taken together, our study not only demonstrated lncRNA BCAR4 as an essential downstream target of YAP in reprogramming glucose metabolism, but also proposed YAP‐BCAR4‐glycolysis signaling axis as a potential therapeutic target for breast cancer treatment.
Results
LncRNA BCAR4 is a transcriptional target of YAP
To elucidate the YAP downstream target genes that could involve in breast cancer metabolism, we analyzed one published YAP microarray data, which was generated in the MCF10A stable cells overexpressing vector, wild‐type YAP, YAP active mutant (5SA), and YAP inactive mutant (S94A) (Zhao et al, 2008). Firstly, we established a group of genes, which are positively regulated by YAP by using the criteria that the gene transcription level in wild‐type YAP stable cell is lower than that in YAP‐5SA stable cell, but higher than that in YAP‐S94A and vector control stable cells. Secondly, we prioritized the genes highly expressed in cancers by referring to TCGA database and related publications (Fatica & Bozzoni, 2014; Xing et al, 2014; Lin et al, 2016). Unexpectedly, BCAR4, a lncRNA that orchestrates a non‐canonical Hedgehog cascade for breast cancer metastasis (Xing et al, 2014), was identified as a potential YAP downstream target (Fig EV1A).
Figure EV1. BCAR4 is a downstream target of YAP.
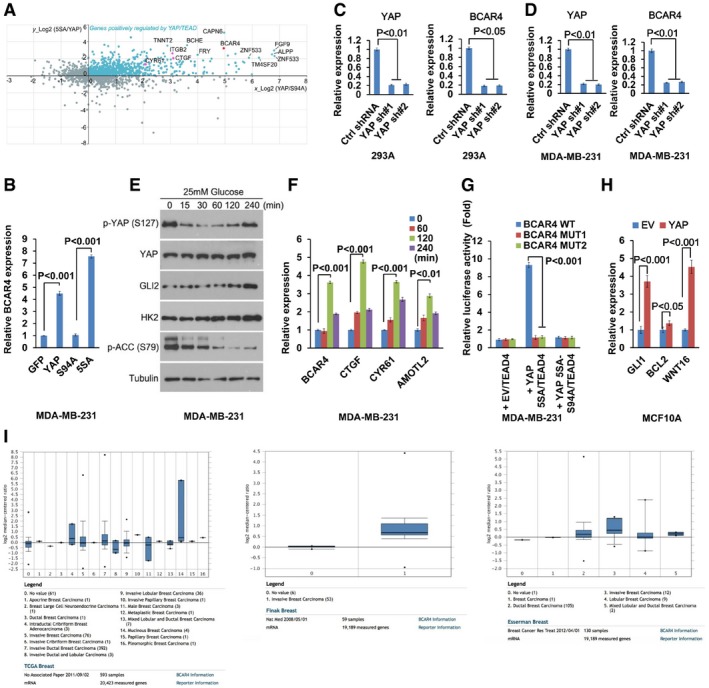
- BCAR4 was identified as one of the YAP downstream targets. Published YAP microarray data were analyzed and illustrated. Known YAP downstream genes are highlighted in purple. LncRNA BCAR4 is highlighted in red.
- The transcriptional activity of YAP was required for the upregulation of BCAR4. The transcription of BCAR4 was examined by quantitative PCR in the MDA‐MB‐231 cells expressing indicated YAP mutants (mean ± s.d., n = 3 biological replicates, Student's t‐test).
- The expression of BCAR4 was analyzed in control and YAP knockdown HEK293A cells (mean ± s.d., n = 3 biological replicates, Student's t‐test).
- The expression of BCAR4 was analyzed in control and YAP knockdown MDA‐MB‐231 cells (mean ± s.d., n = 3 biological replicates, Student's t‐test).
- GLI2, HK2, and phosphorylation of YAP were regulated by glucose deprivation and stimulation. HEK293A cells were glucose‐starved for 24 h and then stimulated with glucose (25 mM) for the indicated intervals.
- Glucose induced the expression of BCAR4. MDA‐MB‐231 cells were glucose‐starved for 24 h and then stimulated with glucose (25 mM) for the indicated intervals (mean ± s.d., n = 3 biological replicates, Student's t‐test).
- BCAR4 promoter luciferase reporter assay was performed by overexpressing YAP‐5SA or YAP‐5SA‐S94A, and TEAD4 in MDA‐MB‐231 (mean ± s.d., n = 3 biological replicates, Student's t‐test).
- YAP promotes the transcription of the Hedgehog downstream genes (mean ± s.d., n = 3 biological replicates, Student's t‐test).
- The expression of BCAR4 was analyzed in silico in human breast cancers by using the Oncomine database (http://www.oncomine.org). Representative data from three databases are shown. Box plot analysis is shown for each published breast cancer array database. Horizontal line, median value; box limits, value range between 25th and 75th percentile; whiskers, value range between 10th and 90th percentile; circles below and above whiskers, minimum and maximum values. The Oncomine analysis settings used were as follows: 10% gene rank, P‐value < 0.0001, fold change > 2.
Source data are available online for this figure.
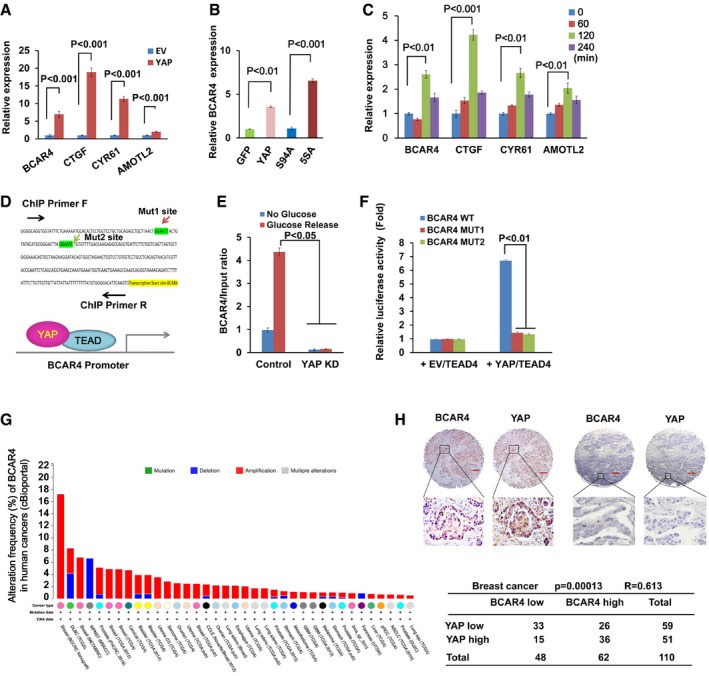
To confirm this finding, we examined the expression of BCAR4 in YAP‐overexpressing MCF10A cells. Indeed, overexpression of YAP significantly induced the transcription of BCAR4 as well as other YAP downstream target genes (CTGF, CYR61, and AMOTL2) (Fig 1A). The transcriptional activity of YAP is required in this process, since overexpression of YAP or YAP active mutant (YAP‐5SA), but not its inactive mutant (YAP‐S94A), significantly induced the transcription of BCAR4 (Figs 1B and EV1B). Moreover, loss of YAP suppressed the transcription of BCAR4 in both HEK293A and MDA‐MB‐231 cells (Fig EV1C and D). Previously, we and others demonstrated that glucose stimulation activates YAP (Mo et al, 2015; Wang et al, 2015). In consistent, the phosphorylation of YAP was decreased upon glucose stimulation (Fig EV1E). Similar to other YAP target genes (CTGF, CYR61, and AMOTL2), the expression of BCAR4 was increased upon glucose stimulation (Figs 1C and EV1F). These data suggested that BCAR4 is positively regulated by YAP.
Figure 1. BCAR4 is a downstream target of YAP .
-
AOverexpression of YAP induced the transcription of BCAR4. The transcription of BCAR4 and YAP downstream genes was examined in empty vector (EV) and YAP‐overexpressing MCF10A cells (mean ± s.d., n = 3 biological replicates, Student's t‐test).
-
BThe transcriptional activity of YAP was required for the upregulation of BCAR4. The transcription of BCAR4 was examined by real‐time PCR in HEK293A cells stably expressing indicated YAP mutants (mean ± s.d., n = 3 biological replicates, Student's t‐test).
-
CGlucose induced the expression of BCAR4. HEK293A cells were glucose‐starved for 24 h and then stimulated with glucose (25 mM) for the indicated intervals (mean ± s.d., n = 3 biological replicates, Student's t‐test).
-
DTwo YAP/TEAD‐binding elements were identified in the BCAR4 promoter region.
-
E, FYAP/TEAD directly regulates the transcription of BCAR4. Chromatin immunoprecipitation assay was performed by using YAP antibody in the glucose‐starved or stimulated MDA‐MB‐231 (E). BCAR4 promoter luciferase reporter assay was performed by overexpressing YAP‐5SA and TEAD4 in HEK293T (F) (mean ± s.d., n = 3 biological replicates, Student's t‐test).
-
GDistribution of alteration frequency of BCAR4 in multiple cancer types. Colors indicate different cancer types. Details in parentheses indicate the source of the corresponding tumor dataset. BCAR4 was analyzed in multiple cancers by using public database cBioportal (http://www.cbioportal.org).
-
HThe expressions of BCAR4 and YAP are positively correlated in breast cancer. RNAScope® detection of BCAR4 and immunohistochemical staining of YAP were performed by using breast cancer tissue arrays. Brown staining indicates positive immune reactivity. The region in each box is enlarged below. Scale bar, 200 μm. Correlations between YAP and BCAR4 levels in human breast tumors were analyzed as a table. Statistical significance was determined by the chi‐square test; R, correlation coefficient.
To determine whether YAP directly regulates BCAR4 transcription, we analyzed the BCAR4 promoter, where two YAP/TEAD‐binding sites were identified (Fig 1D). Moreover, YAP was directly associated with the BCAR4 promoter region, and their association was further enhanced in the glucose stimulated condition (Fig 1E). In addition, mutation of YAP/TEAD‐binding sites in the BCAR4 promoter significantly attenuated YAP/TEAD‐induced BCAR4 promoter luciferase activity (Figs 1F and EV1G). Given the oncogenic role of BCAR4 in activating non‐canonical Hedgehog/GLI2 transcriptional program (Xing et al, 2014), YAP may positively regulate Hedgehog pathway. Indeed, overexpression of YAP induced the transcription of Hedgehog downstream genes GLI1, BCL2, and WNT16 (Fig EV1H). Together, these results demonstrated that lncRNA BCAR4 is a direct transcriptional target of YAP.
Given the oncogenic roles of YAP in cancer development, we next examined whether BCAR4 and YAP are functionally related in human cancers. As shown in Fig 1G, the expression of BCAR4 is amplified in many types of human cancer (cBioportal), especially in breast cancer. This is consistent with our previous finding that BCAR4 is upregulated in TNBC (Xing et al, 2014). Additional public array databases (Oncomine) also confirmed this hypothesis, where BCAR4 is highly expressed in several types of breast carcinoma (Fig EV1I). Besides, we also examined the expressions of BCAR4 and YAP by using breast cancer tissue arrays (Table EV1, BC081120). As shown in Fig 1H, the expression of BCAR4 was positively correlated with that of YAP. Together, these data indicated that YAP‐BCAR4 axis could play an oncogenic role in breast cancer development.
BCAR4 is required for YAP‐induced glycolysis
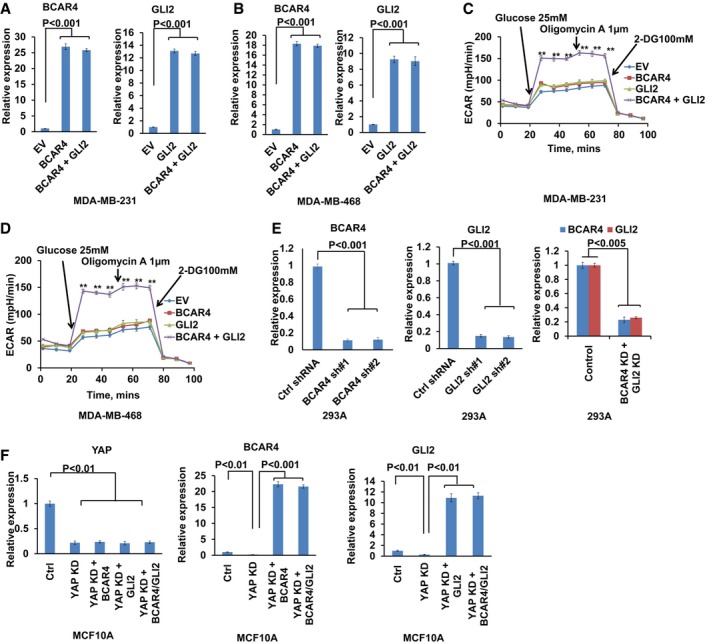
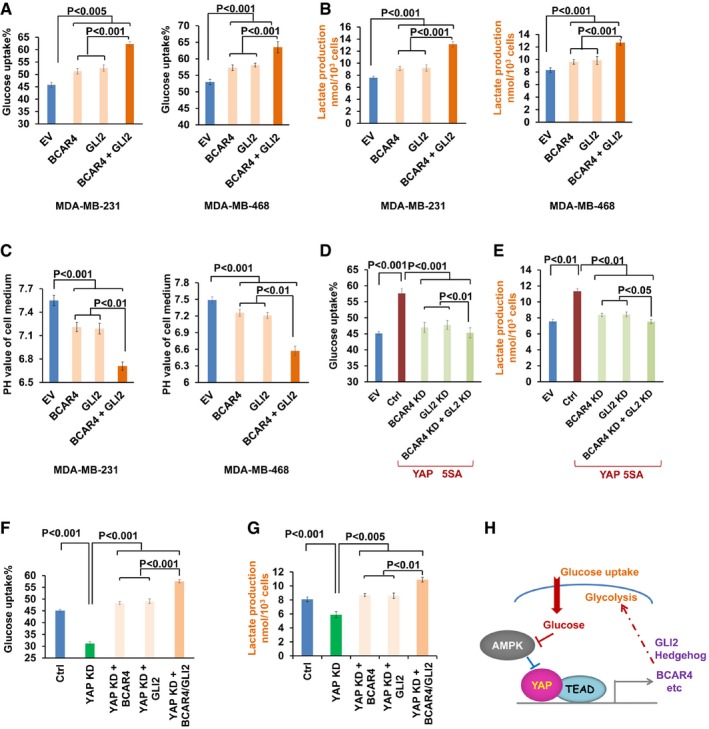
Our previous work demonstrated that BCAR4 was associated with GLI2 to activate Hedgehog signaling in TNBC (Xing et al, 2014). During that study, we noticed that overexpression of BCAR4 or GLI2 alone (Fig EV2A and B) increased glucose uptake (Fig 2A), lactate production (Fig 2B), and cell medium acidification (Fig 2C) in two TNBC cell lines MDA‐MB‐231 and MDA‐MB‐468, while overexpression of both of them (Fig EV2A and B) further enhanced these effects (Fig 2A–C). Extracellular acidification rate (ECAR, a measurement of lactate production and glycolysis) kinetic profiles further demonstrated the substantial increase in glycolytic activity in BCAR4 and GLI2‐overexpressing MDA‐MB‐231 and MDA‐MB‐468 cells (Fig EV2C and D). These data suggested that BCAR4 and GLI2 induced glycolysis.
Figure EV2. BCAR4/GLI2 upregulates HK2 and PFKFB3.
-
AQuantitative analysis of BCAR4 and GLI2 gene expression in MDA‐MB‐231 with control empty vector (EV), BCAR4, GLI2, or BCAR4/GLI2 overexpression (mean ± s.d., n = 3 biological replicates, Student's t‐test).
-
BQuantitative analysis of BCAR4 and GLI2 gene expression in MDA‐MB‐468 with control empty vector (EV), BCAR4, GLI2, or BCAR4/GLI2 overexpression (mean ± s.d., n = 3 biological replicates, Student's t‐test).
-
C, DKinetic extracellular acidification rate (ECAR) profiles were monitored with a Seahorse XF24 analyzer for 100 min. The metabolic inhibitors were injected sequentially at different time points as indicated (mean ± s.d., n = 3 biological replicates, Student's t‐test, **P < 0.01).
-
EshRNA‐mediated BCAR4, GLI2 knockdown efficiency was examined in YAP‐5SA‐overexpressing cells (mean ± s.d., n = 3 biological replicates, Student's t‐test).
-
FThe expressions of YAP, BCAR4, and GLI2 were examined in the indicated stable cells (mean ± s.d., n = 3 biological replicates, Student's t‐test).
Figure 2. BCAR4/ GLI2‐mediated YAP‐dependent glycolysis.
-
A–COverexpression of BCAR4/GLI2 induced glucose uptake (A), lactate production (B), and medium acidification (C) in MDA‐MB‐231 and MDA‐MB‐468 (mean ± s.d., n = 3 biological replicates, Student's t‐test).
-
D, EDownregulation of BCAR4/GLI2 rescued the YAP‐5SA‐induced glucose uptake (D) and lactate production (E) in YAP‐5SA‐overexpressing HEK293A cells (mean ± s.d., n = 3 biological replicates, Student's t‐test).
-
F, GOverexpression of BCAR4/GLI2 rescued the decrease in glucose uptake (F) and lactate production (G) in YAP knockdown MCF10A cells (mean ± s.d., n = 3 biological replicates, Student's t‐test).
-
HGraphic illustration of BCAR4/GLI2 signaling in YAP‐regulated glycolysis.
Given the roles of YAP in promoting both glycolysis (Wang et al, 2015) and BCAR4 transcription (Fig 1), it raised possibility that BCAR4/GLI2 signaling may involve in the YAP‐induced glycolysis. Indeed, downregulation of BCAR4 and GLI2 (Fig EV2E) significantly inhibited YAP‐5SA‐induced glucose uptake (Fig 2D) and lactate production (Fig 2E). Moreover, overexpression of BCAR4 and GLI2 in YAP‐deficient cells (Fig EV2F) rescued the decrease in glucose uptake (Fig 2F) and lactate production (Fig 2G). Since BCAR4 and GLI2 were highly expressed in human cancer cell cells (Xing et al, 2014), exogenously expressed BCAR4 or GLI2 could function together with its endogenous partner (GLI2 or BCAR4) to rescue the glucose uptake and lactate production in the YAP knockdown cells (Fig 2F and G). These results not only demonstrated the role of BCAR4/GLI2 signaling in promoting glucose uptake, but also highlighted their roles in YAP‐induced glycolysis (Fig 2H).
BCAR4/GLI2 promotes glycolysis by upregulating glycolytic enzymes HK2 and PFKFB3
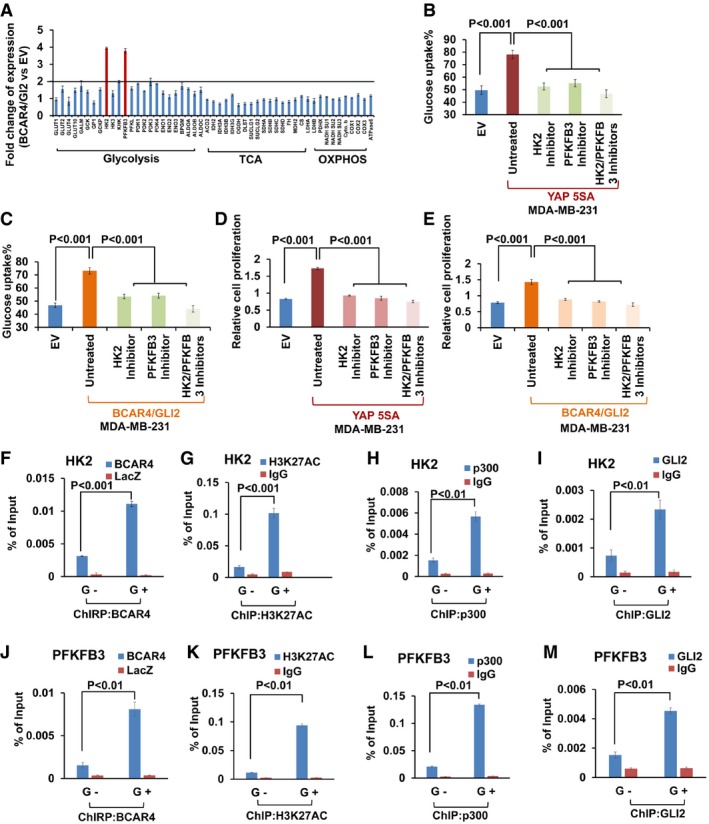
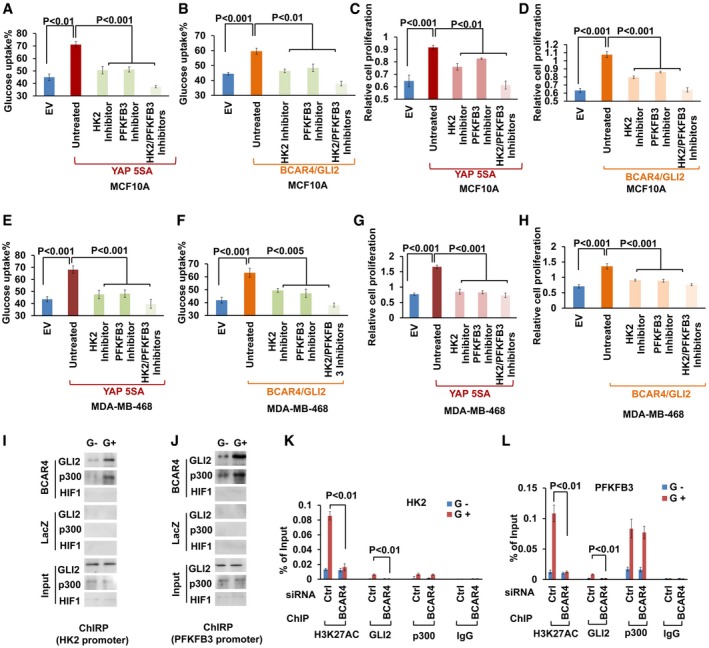
Since BCAR4/GLI2 signaling activates Hedgehog transcriptional program (Xing et al, 2014), it is highly possible that BCAR4/GLI2 promotes glycolysis through its downstream target genes. To identify such BCAR4/GLI2‐regulated genes that are involved in glucose metabolism, we examined transcription of a panel of glucose metabolism‐related genes in vector control and the BCAR4/GLI2‐overexpressing MDA‐MB‐231 cells (Fig 3A). Intriguingly, the expressions of HK2 and PFKFB3 were mostly enhanced by overexpressing BCAR4/GLI2 (Fig 3A). Consistently, our previous study also identified HK2 as a YAP‐regulated gene (Wang et al, 2015) (Fig EV1E), suggesting that YAP may regulate HK2 through BCAR4/GLI2. To validate the roles of HK2 and PFKFB3 in YAP‐ or BCAR4/GLI2‐induced glycolysis, the HK2 inhibitor (3‐BrPA) (Marrache & Dhar, 2015) and PFKFB3 inhibitor (AZ PFKFB3 67) (Boyd et al, 2015) were subjected to the treatment of YAP‐5SA or BCAR4/GLI2‐overexpressing breast cancer cells. As shown in Figs 3B–E and EV3A–H, inhibition of HK2 and PFKFB3 significantly suppressed the glucose uptake and cell proliferation in both YAP‐5SA and BCAR4/GLI2‐overexpressing cells. Since both of HK2 and PFKFB3 are known activators of glycolysis (Gershon et al, 2013; Bartucci et al, 2015), these results indicated that HK2 and PFKFB3 are potential downstream genes of YAP‐BCAR4/GLI2 axis and required for its role in promoting glycolysis.
Figure 3. BCAR4/ GLI2 directly regulated the transcription of HK2 and PFKFB3.
-
AHK2 and PFKFB3 were identified as BCAR4/GLI2‐regulated genes. The transcripts of glucose metabolism, TCA, and oxidative phosphorylation (OXPHOS)‐related genes were detected by quantitative PCR in BCAR4/GLI2‐overexpressing cells and control empty vector‐transfected cells. Fold increases are shown (mean ± s.d., n = 3 biological replicates).
-
B, CGlucose uptake was examined in YAP (B) or BCAR4/GLI2 (C) overexpressing MDA‐MB‐231 cells with or without treatment with HK2 inhibitor (3‐BrPA, 10 μM) and PFKFB3 inhibitor (AZ PFKFB3 67, 10 nM) as indicated (mean ± s.d., n = 3 biological replicates, Student's t‐test).
-
D, EYAP (D) or BCAR4/GLI2 (E) overexpressing MDA‐MB‐231 cells were treated with or without HK2 inhibitor (3‐BrPA, 10 μM) and PFKFB3 inhibitor (AZ PFKFB3 67, 10 nM) for 72 h, and cell proliferation was examined (mean ± s.d., n = 3 biological replicates, Student's t‐test).
-
F–IChIRP and ChIP assays to detect the association of BCAR4 (F), H3K27AC (G), p300 (H), and GLI2 (I) with HK2 promoter under glucose starved (G−) and glucose stimulated (G+) conditions (mean ± s.d., n = 3 biological replicates, Student's t‐test). G−, glucose starvation; G+, glucose stimulation.
-
J–MChIRP and ChIP assays to detect the association of BCAR4 (J), H3K27AC (K), p300 (L), and GLI2 (M) with PFKFB3 promoter under glucose starved (G−) and glucose stimulated (G+) conditions (mean ± s.d., n = 3 biological replicates, Student's t‐test). G−, glucose starvation; G+, glucose stimulation.
Figure EV3. BCAR4/GLI2 directly regulated the transcription of HK2 and PFKFB3.
-
A–DGlucose uptake and cell proliferation was examined in (A, C) YAP or (B, D) BCAR4/GLI2‐overexpressing MCF10A cells with or without treatment with HK2 inhibitor (3‐BrPA, 15 μM) and PFKFB3 inhibitor (AZ PFKFB3 67, 15 nM) as indicated (mean ± s.d., n = 3 biological replicates, Student's t‐test).
-
E–HGlucose uptake and cell proliferation were examined in (E, G) YAP or (F, H) BCAR4/GLI2‐overexpressing MDA‐MB‐468 cells with or without treatment with HK2 inhibitor (3‐BrPA, 10 μM) and PFKFB3 inhibitor (AZ PFKFB3 67, 10 nM) as indicated (mean ± s.d., n = 3 biological replicates, Student's t‐test).
-
I, JChIRP and immunoblot (IB) assay to detect the association of BCAR4, GLI2, and p300 with HK2 (I) or PFKFB3 promoter (J) under glucose starved (G−) and glucose stimulated (G+) conditions.
-
K, LChIP quantitative PCR detection of H3K27AC, GLI2, and p300 occupancy on HK2 (K) or PFKFB3 (L) promoter in MDA‐MB‐231 cells transfected with control or BCAR4 siRNAs (mean ± s.d., n = 3 biological replicates, Student's t‐test).
Source data are available online for this figure.
HK2 and PFKFB3 are direct downstream genes of BCAR4/GLI2
Our previous study indicated BCAR4 activates p300, which results in the acetylation of histone markers such as H3K27ac for gene activation (Xing et al, 2014). Through chromatin isolation by RNA purification (ChIRP) and chromatin immunoprecipitation (ChIP) assays, BCAR4/GLI2, as well as their associated epigenetic players p300 and H3K27ac, was found to be associated with the promoters of both HK2 (Figs 3F–I and EV3I) and PFKFB3 (Figs 3J–M and EV3J) upon glucose stimulation. Notably, BCAR4/GLI2‐induced histone acetylation and gene transcription require the release of inhibitory effect of SNIP1 on p300, but not the recruitment p300 to GLI2 (Xing et al, 2014). Indeed, downregulation of BCAR4 abolished the glucose‐induced H3K27 acetylation and the recruitment of GLI2 to the promoters of HK2 and PFKFB3, which was dispensable of the p300 recruitment (Fig EV3K and L). Together, these results demonstrated that BCAR4/GLI2/p300 complex directly activated the transcription of HK2 and PFKFB3 through acetylation of histones marked by H3K27ac.
BCAR4 facilitates YAP‐dependent tumorigenesis
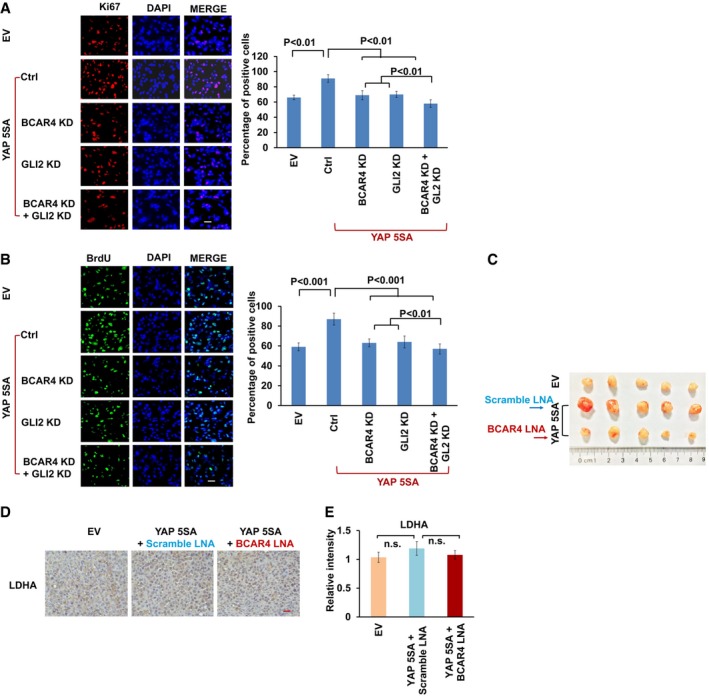
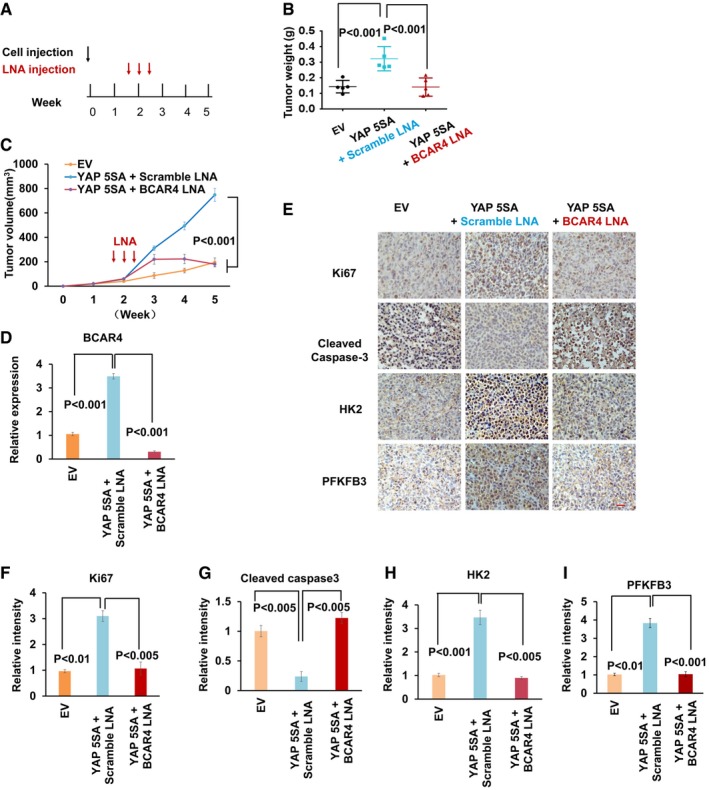
Next, we examined the role of BCAR4/GLI2‐regulated glycolysis in YAP‐dependent cell growth and tumorigenesis. Downregulation of BCAR4 and GLI2 significantly inhibited YAP‐5SA‐induced cell proliferation (Fig EV4A and B). Moreover, overexpression of YAP‐5SA increased the MDA‐MB‐231 xenograft tumor growth (Figs 4A–C and EV4C). Notably, depletion of BCAR4 by using in vivo‐optimized LNAs significantly reduced the YAP‐5SA‐induced tumor growth compared to the scramble LNA treatment (Figs 4A–C and EV4C). The LNA‐mediated BCAR4 downregulation was confirmed in the xenograft tumors (Fig 4D), which showed decreased proliferation and increased apoptosis as indicated by Ki67 and cleaved caspase‐3, respectively (Fig 4E–G). Notably, both HK2 and PFKFB3 were also significantly induced in the YAP‐5SA‐overexpressing xenograft tumors, which is consistent with our previous cell line findings (Figs 1, 3A, and EV1). Loss of BCAR4 rescued the upregulation of HK2 and PFKFB3 that were induced by YAP‐5SA (Fig 4E, H, and I). As a control, the expression of LDHA was not affected in the same tumor samples (Figs 3A and EV4D and E). Together, these results demonstrated that BCAR4 is required for YAP‐regulated tumorigenesis.
Figure EV4. Depletion of BCAR4 impaired YAP‐dependent tumorigenesis.
-
A, BKi‐67 (A) and BrdU (B) staining was performed as indicated. Scale bars, 100 μm. The percentages of positive cells are summarized on the right (mean ± s.d., n = 3 biological replicates, Student's t‐test).
-
CTumors excised from nude mice treated with scrambled LNA or BCAR4 LNA (25 mg/kg).
-
DRepresentative immunohistochemical images of LDHA are shown in the xenograft tumors. Scale bar, 200 μm.
-
EThe relative intensities of LDHA immunohistochemical staining were quantified by Image‐pro plus 6.0 software (Media Cybernetics) (mean ± s.d., n = 3 biological replicates, Student's t‐test, n.s., no significant difference).
Figure 4. Depletion of BCAR4 impaired YAP‐dependent tumorigenesis.
-
A–CSchematic illustration of LNA injection. 10 days after bearing breast tumors, nude mice were injected with scrambled LNA or BCAR4 LNA (25 mg/kg) every other day for three times (A). After 5 weeks, the tumors were excised and tumor weights (B) and bidimensional tumor measurements (C) were assessed (mean ± s.d., n = 5 tumor samples, Student's t‐test).
-
DExpression of BCAR4 was detected in the indicated xenograft tumors by quantitative PCR (mean ± s.d., n = 3 biological replicates, Student's t‐test).
-
ERepresentative immunohistochemical images of xenograft tumors are shown. Scale bar, 200 μm.
-
F–IThe relative intensities of immunohistochemical staining (E) were quantified by Image‐pro plus 6.0 software (Media Cybernetics) (mean ± s.d., n = 3 biological replicates, Student's t‐test).
High YAP/BCAR4 expression correlates with poor clinical outcomes in breast cancer patients
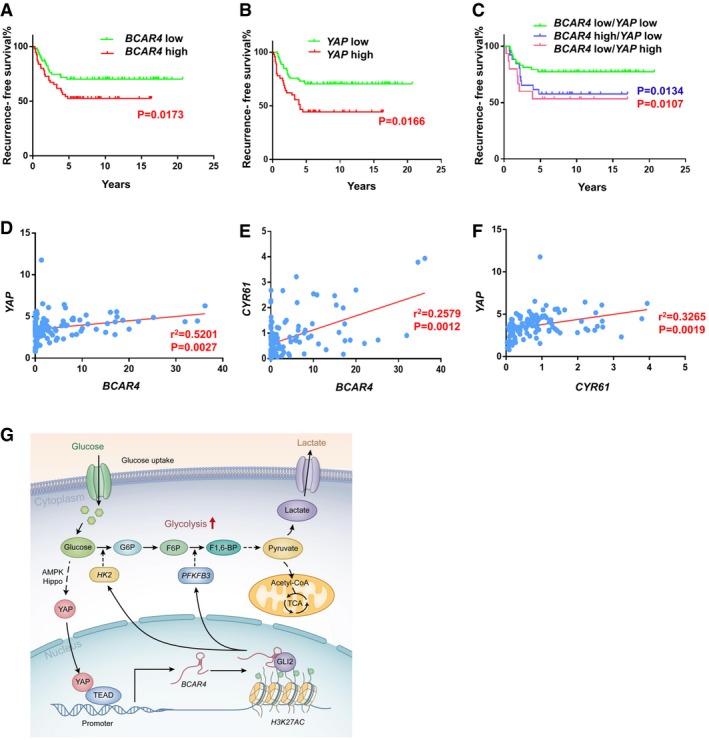
Since BCAR4 functions closely with YAP in promoting breast cancer glycolysis and tumor growth, they may be pathologically involved in breast cancer development. To test this hypothesis, we examined the expression of BCAR4 and YAP in a cohort of breast cancer tissues (Table EV2, Duke cohort) (Lin et al, 2016, 2017) and subsequently categorized them as YAP‐low, YAP‐high, BCAR4‐low, and BCAR4‐high groups by comparing their expression levels to the individual median. As shown in Fig 5A and B, high level of BCAR4 or YAP was correlated with unfavorable recurrence‐free survival for breast cancer patients. Low level of both BCAR4 and YAP benefited favorable recurrence‐free survival (Fig 5C). Notably, the expression of BCAR4 was positively correlated with that of YAP or its downstream gene CYR61 in breast cancer patient samples (Figs 5D–F). These data implicated that YAP‐BCAR4 axis is involved in breast cancer development by reprogramming glucose metabolism (Fig 5G).
Figure 5. Clinical relevance of YAP‐BCAR4 axis in breast cancers.
-
A, BRecurrence‐free survival analysis of BCAR4 status (A) or YAP status (B) alone was performed in breast cancer patients (n = 123, Gehan‐Breslow test).
-
CRecurrence‐free survival analysis of BCAR4 and YAP associated status were examined in breast cancer patients (n = 123, Gehan‐Breslow test).
-
D, EThe expression of BCAR4 was positively correlated with that of YAP (D) and CYR61 (E) by the chi‐square test; R, correlation coefficient (n = 123 patient samples).
-
FThe expression of YAP was positively correlated with that of CYR61 by the chi‐square test; R, correlation coefficient (n = 123 patient samples).
-
GThe graphic illustration of YAP‐BCAR4/GLI2 signaling axis in glycolysis.
Discussion
Over the past decades, lncRNAs have been identified as key players involved in multiple cellular events related to cancer development. LncRNAs are often aberrantly expressed in cancers, where they regulate chromatin‐binding proteins, nucleate signaling complex formation in the nucleus, control protein cellular localization, and modulate gene expression (Yang et al, 2011; Fatica & Bozzoni, 2014; Xing et al, 2014; Lin et al, 2016). Therefore, they were proposed as potential therapeutic targets in cancers (Gupta et al, 2010; Kogo et al, 2011; Gutschner & Diederichs, 2012). Recent studies highlighted the roles of lncRNAs in regulation of cell signaling pathways (Xing et al, 2014; Lin et al, 2016, 2017). However, detailed mechanisms by which lncRNAs coordinate with aberrant signaling pathways in cancer development remain largely unexplored.
Our recent work identified BCAR4 as one of the most upregulated lncRNAs in TNBC, which is required for the TNBC metastasis by promoting a GLI‐dependent non‐canonical Hedgehog signaling (Xing et al, 2014; Lin et al, 2016). Unexpectedly, we uncovered that BCAR4 was a direct target of YAP and required for the YAP‐promoted glycolysis through GLI2‐dependent Hedgehog signaling. Mechanistically, BCAR4/GLI2 reprogrammed glucose metabolism by upregulating two glycolytic enzymes, HK2 and PFKFB3. Despite well‐established association between aerobic glycolysis and tumor development, its relationship with cancer metastasis is much less clear. Since the enormous energy is required during the metastasis, cancer cells are expected to reprogramme their energy metabolism to facilitate this process. Indeed, previous study also indicated that specifically reduced glucose oxidation would increase tumor metastasis (Kamarajugadda et al, 2012). However, the signaling connection between tumor cell metabolism and metastasis is still largely unknown. Based on our findings, it would be expected that YAP‐BCAR4 axis could play an essential role in this process, since both YAP and BCAR4 favor both glycolysis and tumor metastasis. Whether YAP‐BCAR4 axis‐regulated glycolysis is required for the metastasis deserves further elucidation.
Previous study also demonstrated that the Hippo pathway is a downstream signaling controlled by GPER and suggested the role of YAP in tamoxifen‐resistant breast cancer (Zhou et al, 2015). Since BCAR4 is also upregulated in response to tamoxifen treatment (Godinho et al, 2011), the discovered YAP‐BCAR4‐glycolysis axis could also play a role in the tamoxifen resistance during breast cancer treatment.
Cancer development largely depends on the inactivation of tumor suppressors and the activation of oncogenes, which allow uncontrolled cell proliferation and survival that eventually result in neoplastic transformation. It is our hope that we will be able to identify additional molecular targets involved in cancer formation that will allow us to develop novel therapeutic strategies for cancer treatment. Given the critical role of lncRNA BCAR4 in modulating two key growth‐related signaling pathways, Hippo and Hedgehog, during breast cancer development, further investigating BCAR4 and its related oncogenic functions would allow us to establish a putative target for breast cancer treatment. Notably, the functional redundancy between oncogenic signaling pathways often results in poor application of oncological compounds in clinics. Identification of additional molecular targets, such as BCAR4, will provide us opportunities to expand the arsenal of current anti‐cancer agents to benefit their clinical outcomes. Intriguingly, our current study highlighted the LNA‐based therapy in targeting YAP‐dependent tumorigenesis through BCAR4 (Fig 4), suggesting its translational potential for other Hippo‐dysregulated cancers.
Materials and Methods
Tissue samples
Breast cancer tissue microarrays were purchased from US Biomax (BC081120, Biomax). Fresh frozen breast cancer tissues (Duke Cohorts) were obtained Duke University as previously described (Lin et al, 2016, 2017). The study protocol was approved by the Institutional Review Board of Duke University Health System. All tissue samples were collected in compliance with informed consent policy. Detailed clinical information is listed in Tables EV1 and EV2
Cell lines, transfection, and transduction
Human breast cancer cell lines MDA‐MB‐231, MDA‐MB‐468, and human embryonic kidney cell line HEK293T were purchased from American Type Culture Collection (ATCC) and characterized by Cell Line Core Facility (MD Anderson Cancer Center). These cell lines were maintained in Dulbecco modified essential medium (DMEM) supplemented with 10% fetal bovine serum (FBS) at 37°C in 5% CO2 (v/v). HEK293A cells were kindly provided by Jae‐Il. Park (MD Anderson Cancer Center, USA) (Wang et al, 2015). MCF10A cells were purchased from ATCC and maintained in DMEM/F12 medium supplemented with 5% horse serum, 200 ng/ml epidermal growth factor, 500 ng/ml hydrocortisone, 100 ng/ml cholera toxin, and 10 μg/ml insulin at 37°C in 5% CO2 (v/v). siRNA and plasmid transfections were performed using DharmaFECT4 (Thermo Scientific) and Lipofectamine® 3000 (Life Technologies). Lentiviruses were produced in HEK293T cells with ViraPower™ Lentiviral Expression System (Thermo Scientific). All the cell lines were free of mycoplasma contamination as tested by vendors using MycoAlert kit from Lonza. No cell lines used in this study are found in the database of commonly misidentified cell lines (ICLAC and NCBI BioSample) based on short tandem repeats (STR) profiling performed by vendors.
For glucose starvation treatment, cells were washed once and cultured in glucose‐free DMEM (Invitrogen) with 10% dialyzed FBS (Gemini Bio‐Products) for 24 h (Lin et al, 2014; Wang et al, 2015).
For inhibitor treatment, cells were treated with HK2 inhibitor (3‐BrPA, Cat#376817, Millipore Sigma) or PFKFB3 inhibitor (AZ PFKFB3 67, Cat#5742, TOCRIS) at indicated dose or time point.
Cloning procedures
The SFB‐YAP lentiviral expression vectors was generated by inserting the gateway response fragment (attR1‐ccdB‐attR2)‐fused SFB tag into the XbaI and SwaI multi‐clonal sites of the pCDH‐CMV‐EF1‐GFP vector (kindly provided by M. J. You, MD Anderson Cancer Center, USA). YAP was cloned into this vector through a gateway‐based LR reaction. YAP shRNA1 (plasmid no 27368) and shRNA2 (plasmid no 27369) were obtained from Addgene as described previously (Wang et al, 2015). Mammalian expression vectors for full‐length BCAR4 and GLI2 were constructed by subcloning the gene sequences into pCDNA3.1 (+) backbone (Life Technologies), pBabe retroviral expression vector as described previously (Xing et al, 2014).
siRNA, shRNA, and LNA™
Commercially available Lincode SMART pool siRNA was used in this study (Xing et al, 2014). The knockdown efficiency and specificity of all siRNAs were validated with qPCR or immunoblotting. The oligonucleotides for shRNA were designed based on Lincode SMART pool siRNA sequence and cloned into pLKO.1‐Puro vector, and two shRNAs producing the best knockdown efficiency were used in the following functional studies as described previously (Xing et al, 2014). LNAs targeting BCAR4 or a scrambled sequence were designed and synthesized from Exiqon (Xing et al, 2014). Detailed oligonucleotide information is listed in Table EV3.
Antibodies
The following antibodies were used for immunoprecipitation, immunostaining, and immunoblotting: Anti‐YAP antibody (1:1,000 dilution) was raised by immunizing rabbits with bacterially expressed and purified GST‐fused human full‐length YAP protein (Wang et al, 2015). Anti‐tubulin (T6199‐200UL, 1:5,000 dilution) was obtained from Sigma‐Aldrich. Anti‐phospho‐ACC (Ser79) (3661S, 1:1,000 dilution), Ki‐67 (12202, 1:200 dilution for IHC; 9129, 1:400 dilution for IF), cleaved caspase‐3 (9579, 1:200 dilution for IHC) were purchased from Cell Signaling. Anti‐GLI2 (ab26056, 1:1,000 dilution), anti‐PFKFB3 antibody (ab96699, 1:200 dilution for IHC), anti‐BrdU (ab152095, 1:500 dilution for IF) were purchased from Abcam. Anti‐HK2 (ab76358, WB: 1:1,000, IHC: 1:100) was purchased from Origen. Anti‐HIF1α (28b) mouse monoclonal antibody (sc‐13515, 1:1,000 for IB) was purchased from Santa Cruz Biotechnology.
The following antibodies were used for ChIP or RNA immunoprecipitation (RIP): GLI2 (AF3526) from R&D Systems; p300 (61402), H3K27Ac (39133) from Active Motif.
RNAScope® assay, immunohistochemistry staining, RIP assay, immunofluorescence staining, and quantification
RNAScope® assay, immunohistochemistry staining, immunofluorescence staining, and image analyses/quantification were performed as previously described (Xing et al, 2014; Wang et al, 2015; Li et al, 2016; Lin et al, 2016).
For RNAScope® assay, the RNAScope® probe targeting BCAR4 was designed and synthesized by Advanced Cell Diagnostics, and detection of BCAR4 expression was performed on breast cancer tissue microarray using RNAscope® 2.0 High Definition (HD) Assay kit according to the manufacturer's instructions (Advanced Cell Diagnostics). The images were acquired with Zeiss Axioskop2 Plus Microscope. For immunohistochemistry, the paraffin‐embedded tissues were deparaffinized and rehydrated, followed by antigen retrieval. After primary and secondary antibody (listed in Antibodies section) incubation, the slide was dehydrated and stabilized with mounting medium and the images were acquired with Olympus DP72 microscope. The quantification of RNAScope staining densities was measured by RNAscope SpotStudio v1.0 Software (Advanced Cell Diagnostics). The quantification of IHC, staining density was performed by Image‐Pro plus 6.0 (Media Cybernetics) and calculated on the basis of the average staining intensity and the percentage of positively stained cells. A total score of RNA or protein expression was calculated from both the percentage of positive cells and the intensity. High and low RNA or protein expression was defined using the mean score of all samples as a cutoff point. Spearman rank correlation was used for statistical analyses of the correlation between each marker and clinical stage.
For immunofluorescence, cells were cultured in chamber slides overnight and fixed with 3.7% formaldehyde in PBS for 10 min at 4°C, followed by permeabilization with 0.5% Triton X‐100 in PBS for 10 min. Cells were then blocked for nonspecific binding with 10% goat serum in PBS and 0.1% Tween 20 (PBST) overnight, and incubated with the indicated antibody for 1 h at room temperature, followed by incubation with anti‐rabbit IgG (H+L), F(ab’)2 fragment (Alexa Fluor® 594 Conjugate) from Cell Signaling Technology for 30 min at room temperature. Coverslips were mounted on slides using anti‐fade mounting medium with DAPI. Immunofluorescence images were acquired on a Zeiss Axio Observer Z1 fluorescence microscope. For each channel, all images were acquired with the same settings. For BrdU immunostaining, cells were treated with 100 μM BrdU for 4 h before permeabilization, cellular DNA was then digested with 0.5 U/μl DNase I (New England Biolabs, Beverly, MA, USA) for 30 min at 37°C, and processed for direct immunofluorescence.
Chromatin immunoprecipitation, RNA immunoprecipitation, and chromatin isolation by RNA purification
Cell fixation and chromatin preparation were performed using truChIP™ Chromatin Shearing Kits on Covaris M220 focused Ultrasonicator (Covaris). The downstream procedure for ChIP and ChIRP was conducted as previously described (Lin et al, 2014, 2016; Xing et al, 2014). RIP assay was performed as previously described (Xing et al, 2014; Lin et al, 2016, 2017). The primer sequences used in ChIP experiment are described below.
Luciferase reporter promoter assay
HEK293T or MDA‐MB‐231 cells were transfected with empty vector, YAP‐5SA/TEAD4, or YAP‐5SA‐S94A/TEAD4 expression vectors and luciferase reporter construct. Two days later, whole‐cell lysates were extracted, and luciferase activity was determined using the Dual‐Luciferase Reporter Assay kit (Promega, Madison, WI, USA) and measured with an illuminometer instrument. Renilla was used as the internal control to determine luciferase activity. Three independent experiments were performed in each assay.
Glycolytic activity assay
Cellular glycolytic activity was measured by glucose uptake and lactate production. For glucose uptake assay, briefly, cells were seeded in 60‐mm plates. Twenty‐four hours later, cells were refreshed with glucose‐free DMEM with 10% dialyzed FBS. Eighteen hours later, cells were treated with 2‐NBDG (50 μM; Invitrogen) for 1 h, and glucose uptake was quantified using FACS analysis (Wang et al, 2015; Lin et al, 2016). To determine cellular lactate production, cells were plated in 24‐well plates and cultured overnight. The culture medium was removed from the cells, and the lactate concentration was determined using lactate test strips on a Lactate Plus meter (Nova Biomedical). Next, cells were collected, stained with trypan blue, and viable cell numbers were counted on a TC10 Automated Cell Counter (Bio‐Rad). Lactate production was expressed as lactate concentration per 104 viable cells (Wang et al, 2015; Lin et al, 2016). In addition, extracellular acidification rate (ECAR) was detected by Seahorse Bioscience XF‐24 Extracellular Flux Analyzer; briefly, cells were cultured in XF24‐well cell culture microplates (Seahorse Bioscience) for 24 h and glycolytic activity were assessed using the Seahorse XF glycolysis stress test Kit (Agilent) as per the manufacturer's instruction. Sequential compound injections, including glucose, oligomycin A and 2‐DG, were applied on the microplate to test glycolytic activity.
In vivo tumorigenesis study
All animal experiments were performed in accordance with a protocol approved by the Institutional Animal Care. Female athymic Nu/Nu mice (4–6 weeks old) arriving in our facility were randomly put into cages with five mice each. Tumor cells in 30 μl growth medium (mixed with Matrigel at a 1:1 ratio) were injected subcutaneously into the flank of 6‐ to 8‐week‐old female nude mice using a 100‐μl Hamilton Microliter™ syringe. Tumor size was measured weekly using a caliper, and tumor volume was calculated using the standard formula: 0.54 × L × W2, where L is the longest diameter and W is the shortest diameter; 10 days after cell injection, mice were intravenously injected with LNAs (25 mg/kg) every other day for three times. Mice were euthanized when they met the institutional euthanasia criteria for tumor size and overall health condition. The tumors were removed, photographed, and weighed. The investigators were not blinded to allocation during experiments and outcome assessment.
Statistics & reproducibility
The experiment was set up to use 3–5 samples/repeats per experiment/group/condition to detect a twofold difference with power of 80% and at the significance level of 0.05 by a two‐sided test for significant studies. For RNAscope®, immunohistochemical staining and Western blotting, the representative images are shown. Each of these experiments was independently repeated for 3–5 times. Relative quantities of gene expression level were normalized to B2M. Results are reported as mean ± standard deviation (s.d.) of at least three independent experiments. Each n value is indicated in the corresponding figure legend. Comparisons were performed using two‐tailed paired Student's t‐test or two‐way ANOVA, as indicated in individual figures. For survival analysis, the expression of indicated genes was treated as a binary variant and divided into “high” and “low” levels. Kaplan–Meier survival curves were compared using the Gehan–Breslow test with GraphPad Prism (GraphPad Software). The experiments were not randomized. The investigators were not blinded to allocation during experiments and outcome assessment.
Author contributions
AL and WW conceived and designed the research. XZ, HH, and G‐PL performed most of the experiments, with the assistance from Y‐XM, R‐LP, L‐JS, R‐HL, L‐JY. JRM performed clinical specimens ascertain and process. G‐PL and R‐LP performed xenograft experiments, RNAscope assays, and immunohistochemistry analyses. WW and AL wrote the manuscript.
Conflict of interest
The authors declare that they have no conflict of interest.
Supporting information
Expanded View Figures PDF
Table EV1
Table EV2
Table EV3
Source Data for Expanded View
Review Process File
Acknowledgements
We thank Dr. H.‐L.P (Chinese Academy of Sciences) for the technical assistance of glycolytic activity assay. This work was supported in part by the National Natural Science Foundation of China (81672791) (A.L.), the Fundamental Research Funds for the Central Universities (508202*172210162) (A.L.), American Cancer Society Institutional Research Grant (W.W.), and Breast Cancer Research Foundation‐AACR Career Development Award for Translational Breast Cancer Research (16‐20‐26‐WANG) (W.W.). A.L. is a scholar of Thousand Youth Talents—China, a scholar of Thousand Talents—Zhejiang, a scholar of Hundred Talents—Zhejiang University. W.W. is a member of Chao Family Comprehensive Cancer Center (P30 CA062203) and a member of Center for Complex Biological Systems at UC Irvine.
The EMBO Journal (2017) 36: 3325–3335
Contributor Information
Wenqi Wang, Email: wenqiw6@uci.edu.
Aifu Lin, Email: linaifu@zju.edu.cn.
References
- Bartucci M, Dattilo R, Moriconi C, Pagliuca A, Mottolese M, Federici G, Benedetto AD, Todaro M, Stassi G, Sperati F, Amabile MI, Pilozzi E, Patrizii M, Biffoni M, Maugeri‐Sacca M, Piccolo S, De Maria R (2015) TAZ is required for metastatic activity and chemoresistance of breast cancer stem cells. Oncogene 34: 681–690 [DOI] [PubMed] [Google Scholar]
- Boyd S, Brookfield JL, Critchlow SE, Cumming IA, Curtis NJ, Debreczeni J, Degorce SL, Donald C, Evans NJ, Groombridge S, Hopcroft P, Jones NP, Kettle JG, Lamont S, Lewis HJ, MacFaull P, McLoughlin SB, Rigoreau LJ, Smith JM, St‐Gallay S et al (2015) Structure‐based design of potent and selective inhibitors of the metabolic kinase PFKFB3. J Med Chem 58: 3611–3625 [DOI] [PubMed] [Google Scholar]
- DeRan M, Yang J, Shen CH, Peters EC, Fitamant J, Chan P, Hsieh M, Zhu S, Asara JM, Zheng B, Bardeesy N, Liu J, Wu X (2014) Energy stress regulates hippo‐YAP signaling involving AMPK‐mediated regulation of angiomotin‐like 1 protein. Cell Rep 9: 495–503 [DOI] [PMC free article] [PubMed] [Google Scholar]
- Fatica A, Bozzoni I (2014) Long non‐coding RNAs: new players in cell differentiation and development. Nat Rev Genet 15: 7–21 [DOI] [PubMed] [Google Scholar]
- Gailite I, Aerne BL, Tapon N (2015) Differential control of Yorkie activity by LKB1/AMPK and the Hippo/Warts cascade in the central nervous system. Proc Natl Acad Sci USA 112: E5169–E5178 [DOI] [PMC free article] [PubMed] [Google Scholar]
- Gershon TR, Crowther AJ, Tikunov A, Garcia I, Annis R, Yuan H, Miller CR, Macdonald J, Olson J, Deshmukh M (2013) Hexokinase‐2‐mediated aerobic glycolysis is integral to cerebellar neurogenesis and pathogenesis of medulloblastoma. Cancer Metab 1: 2 [DOI] [PMC free article] [PubMed] [Google Scholar]
- Godinho M, Meijer D, Setyono‐Han B, Dorssers LC, van Agthoven T (2011) Characterization of BCAR4, a novel oncogene causing endocrine resistance in human breast cancer cells. J Cell Physiol 226: 1741–1749 [DOI] [PubMed] [Google Scholar]
- Gupta RA, Shah N, Wang KC, Kim J, Horlings HM, Wong DJ, Tsai MC, Hung T, Argani P, Rinn JL, Wang Y, Brzoska P, Kong B, Li R, West RB, van de Vijver MJ, Sukumar S, Chang HY (2010) Long non‐coding RNA HOTAIR reprograms chromatin state to promote cancer metastasis. Nature 464: 1071–1076 [DOI] [PMC free article] [PubMed] [Google Scholar]
- Gutschner T, Diederichs S (2012) The hallmarks of cancer: a long non‐coding RNA point of view. RNA Biol 9: 703–719 [DOI] [PMC free article] [PubMed] [Google Scholar]
- Halder G, Johnson RL (2011) Hippo signaling: growth control and beyond. Development 138: 9–22 [DOI] [PMC free article] [PubMed] [Google Scholar]
- Hardie DG, Ross FA, Hawley SA (2012) AMPK: a nutrient and energy sensor that maintains energy homeostasis. Nat Rev Mol Cell Biol 13: 251–262 [DOI] [PMC free article] [PubMed] [Google Scholar]
- Harvey KF, Zhang X, Thomas DM (2013) The Hippo pathway and human cancer. Nat Rev Cancer 13: 246–257 [DOI] [PubMed] [Google Scholar]
- Kamarajugadda S, Stemboroski L, Cai Q, Simpson NE, Nayak S, Tan M, Lu J (2012) Glucose oxidation modulates anoikis and tumor metastasis. Mol Cell Biol 32: 1893–1907 [DOI] [PMC free article] [PubMed] [Google Scholar]
- Kogo R, Shimamura T, Mimori K, Kawahara K, Imoto S, Sudo T, Tanaka F, Shibata K, Suzuki A, Komune S, Miyano S, Mori M (2011) Long noncoding RNA HOTAIR regulates polycomb‐dependent chromatin modification and is associated with poor prognosis in colorectal cancers. Cancer Res 71: 6320–6326 [DOI] [PubMed] [Google Scholar]
- Li X, Wang W, Xi Y, Gao M, Tran M, Aziz KE, Qin J, Li W, Chen J (2016) FOXR2 interacts with MYC to promote its transcriptional activities and tumorigenesis. Cell Rep 16: 487–497 [DOI] [PMC free article] [PubMed] [Google Scholar]
- Lin A, Yao J, Zhuang L, Wang D, Han J, Lam EW, Network TR, Gan B (2014) The FoxO‐BNIP3 axis exerts a unique regulation of mTORC1 and cell survival under energy stress. Oncogene 33: 3183–3194 [DOI] [PMC free article] [PubMed] [Google Scholar]
- Lin A, Li C, Xing Z, Hu Q, Liang K, Han L, Wang C, Hawke DH, Wang S, Zhang Y, Wei Y, Ma G, Park PK, Zhou J, Zhou Y, Hu Z, Zhou Y, Marks JR, Liang H, Hung MC et al (2016) The LINK‐A lncRNA activates normoxic HIF1alpha signalling in triple‐negative breast cancer. Nat Cell Biol 18: 213–224 [DOI] [PMC free article] [PubMed] [Google Scholar]
- Lin A, Hu Q, Li C, Xing Z, Ma G, Wang C, Li J, Ye Y, Yao J, Liang K, Wang S, Park PK, Marks JR, Zhou Y, Zhou J, Hung MC, Liang H, Hu Z, Shen H, Hawke DH et al (2017) The LINK‐A lncRNA interacts with PtdIns(3,4,5)P3 to hyperactivate AKT and confer resistance to AKT inhibitors. Nat Cell Biol 19: 238–251 [DOI] [PMC free article] [PubMed] [Google Scholar]
- Marrache S, Dhar S (2015) The energy blocker inside the power house: mitochondria targeted delivery of 3‐bromopyruvate. Chem Sci 6: 1832–1845 [DOI] [PMC free article] [PubMed] [Google Scholar]
- Mihaylova MM, Shaw RJ (2011) The AMPK signalling pathway coordinates cell growth, autophagy and metabolism. Nat Cell Biol 13: 1016–1023 [DOI] [PMC free article] [PubMed] [Google Scholar]
- Mo JS, Meng Z, Kim YC, Park HW, Hansen CG, Kim S, Lim DS, Guan KL (2015) Cellular energy stress induces AMPK‐mediated regulation of YAP and the Hippo pathway. Nat Cell Biol 17: 500–510 [DOI] [PMC free article] [PubMed] [Google Scholar]
- Pan D (2010) The hippo signaling pathway in development and cancer. Dev Cell 19: 491–505 [DOI] [PMC free article] [PubMed] [Google Scholar]
- Wang W, Xiao ZD, Li X, Aziz KE, Gan B, Johnson RL, Chen J (2015) AMPK modulates Hippo pathway activity to regulate energy homeostasis. Nat Cell Biol 17: 490–499 [DOI] [PMC free article] [PubMed] [Google Scholar]
- Xing Z, Lin A, Li C, Liang K, Wang S, Liu Y, Park PK, Qin L, Wei Y, Hawke DH, Hung MC, Lin C, Yang L (2014) lncRNA directs cooperative epigenetic regulation downstream of chemokine signals. Cell 159: 1110–1125 [DOI] [PMC free article] [PubMed] [Google Scholar]
- Yang L, Lin C, Liu W, Zhang J, Ohgi KA, Grinstein JD, Dorrestein PC, Rosenfeld MG (2011) ncRNA‐ and Pc2 methylation‐dependent gene relocation between nuclear structures mediates gene activation programs. Cell 147: 773–788 [DOI] [PMC free article] [PubMed] [Google Scholar]
- Yu FX, Zhao B, Guan KL (2015) Hippo pathway in organ size control, tissue homeostasis, and cancer. Cell 163: 811–828 [DOI] [PMC free article] [PubMed] [Google Scholar]
- Zhao B, Ye X, Yu J, Li L, Li W, Li S, Lin JD, Wang CY, Chinnaiyan AM, Lai ZC, Guan KL (2008) TEAD mediates YAP‐dependent gene induction and growth control. Genes Dev 22: 1962–1971 [DOI] [PMC free article] [PubMed] [Google Scholar]
- Zhao B, Li L, Lei Q, Guan KL (2010) The Hippo‐YAP pathway in organ size control and tumorigenesis: an updated version. Genes Dev 24: 862–874 [DOI] [PMC free article] [PubMed] [Google Scholar]
- Zhou X, Wang S, Wang Z, Feng X, Liu P, Lv XB, Li F, Yu FX, Sun Y, Yuan H, Zhu H, Xiong Y, Lei QY, Guan KL (2015) Estrogen regulates Hippo signaling via GPER in breast cancer. J Clin Invest 125: 2123–2135 [DOI] [PMC free article] [PubMed] [Google Scholar]
Associated Data
This section collects any data citations, data availability statements, or supplementary materials included in this article.
Supplementary Materials
Expanded View Figures PDF
Table EV1
Table EV2
Table EV3
Source Data for Expanded View
Review Process File


