Figure 1.
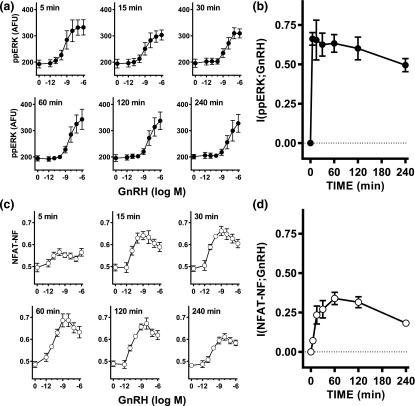
Quantifying information transfer via GnRHR to ERK and NFAT in LβT2 cells. (a) LβT2 cells in 96-well plates were continuously stimulated for varied periods with 0 or 10−12 to 10−6 M GnRH as indicated and then fixed and stained (DAPI and ppERK) before image capture and analysis. The data shown are population-averaged nuclear ppERK measures in arbitrary fluorescence units (AFU) and are means ± standard error of the mean from three separate experiments, each with triplicate wells (n = 3). Background values (without fluorophore) were 120 to 150 AFU and were not subtracted. Log EC50 values were −9.03 ± 0.39, −8.07 ± 0.16, −7.95 ± 0.19, −8.01 ± 0.53, −7.76 ± 0.60, and −7.34 ± 0.74 at 5, 15, 30, 60, 120, and 240 minutes, respectively. One-way analysis of variance revealed time to be a significant variable (P < 0.05), and post hoc Bonferroni tests (comparing to the 5-minute data) revealed a significant difference at 240 minutes (P < 0.05) but not at any other time point. (b) The single-cell ppERK measures from the full concentration response curves in (a) were used to calculate the MI between GnRH concentration and ppERK at each time point, and these I(ppERK;GnRH) values (in bits) are plotted against time. (c) Ad NFAT-EFP–transduced LβT2 cells in 96-well plates were stimulated for varied periods with 0 or 10−12 to 10−6 M GnRH as indicated and then fixed and stained (DAPI) before image capture and analysis. NFAT-EFP fluorescence intensity was determined for the nucleus and cytoplasm and used (after subtraction of background values, which were ~200 AFU) to calculate the proportion of NFAT-EFP in the nucleus. The data shown are population-averaged measures of this NFAT-NF and are means ± standard error of the mean from three separate experiments, each with triplicate wells (n = 3). (d) The single-cell NFAT-NF measures from the full concentration response curves in (c) were used to calculate the MI between GnRH concentration and NFAT-NF and these I(NFAT-NF;GnRH) values (in bits) are plotted against time. The data in (a) and (c) are replotted against time in Supplemental Fig. 1 (232.3KB, eps) to better illustrate response kinetics.

