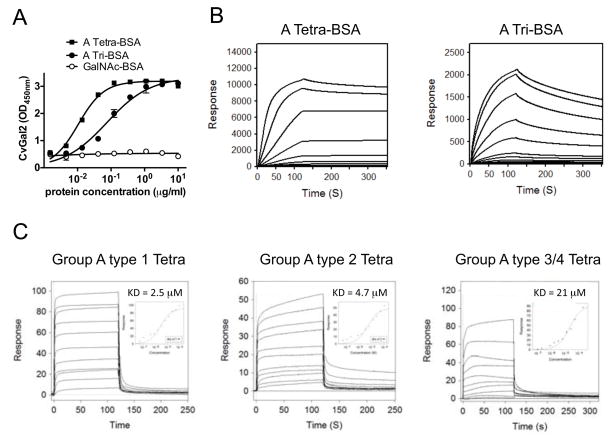
Figure 7. Recognition of blood group A oligosaccharide by CvGal2.
(A) Blood group A tetrasaccharide-BSA (A Tetra-BSA), blood group A trisaccharide-BSA (A Tri-BSA), or N-Acetylgalactosamine-BSA (GalNAc-BSA) were delivered at the concentrations indicated (serial dilution starting from 10 μg/ml; 100 μl/well) into 96-well plates and the binding of CvGal2 (0.2 μg/ml) was assessed by ELISA. Data show optical density at 450 nm (OD450nm) in triplicates with standard error (SEM). (B) Neoglycoproteins were immobilized up to 1000 response units on CM5 chips, and the binding of rCvGal2 was assessed by SPR, flowing through rCvGal2 as the analyte. The SPR sensorgrams were recorded with 2-fold serial dilutions of the analyte starting from 100μg/ml. Sensorgrams for the binding of rCvGal2 onto blood group A tetrasaccharide-BSA (A Tetra-BSA) and trisaccharide-BSA (A Tri-BSA) are shown. Negligible responses were observed on sensorgrams for GalNAc-BSA (not shown). Biacore T100 evaluation software was used to deduce KD values. (C) SPR was performed with immobilized rCvGal2 and the indicated oligosaccharides as analyte. SPR sensorgrams were recorded with 2-fold serial dilutions starting from 100 μg/ml. SPR sensorgram are shown with inset as 1:1 steady state fitting curve.

