

Abstract
Background:
The objective of this study was to determine the gender differences in health-related quality of life (HRQoL) and to indicate to what extent this difference can be explained by differential in demographic and chronic disease conditions in Iranian elderly people.
Methods:
This analysis was carried out on cross-sectional data of QoL assessment among 750 elderly individuals aged 60–90 years who were dwelling in urban population of Babol, the North of Iran. The multiple linear regression model was used to estimate the association between gender and HRQoL after controlling sociodemographic characteristics and chronic disease conditions.
Results:
Women had significantly lower score in HRQoL in all subscales compared with men after adjusting several confounding factors (P = 0.001). The unadjusted mean difference in overall HRQoL scores was −11.2 (95% confidence interval [CI]: −13.8, −8.6) points, but it was reduced to −6.5 (95% CI: −9.0, −3.9) points between gender after adjusting by age, educational level, living status, physical activity, smoking, abdominal obesity, diabetes, and hypertension.
Conclusions:
Adjusting for sociodemographic and chronic disease conditions reduced the effect size of poorer HRQoL for women compared with men but did not remove the sex differences. The poorer scores of HRQoL in Iranian women needs further physical, psychological, and social supports in elderly.
Keywords: Chronic diseases, elderly, gender differences, health-related quality of life, sociodemographic characteristics
Introduction
The rate of elderly people is increasing in both developed and developing countries. Although the life expectancy of women, on average 6–8 years, is longer than men,[1] from health prospective, the older women are more likely to have experience of functional disability in morbidity and personal self-care than men with similar age.[1,2] Thus, health statistics almost show a paradox of higher rate of morbidity and use health services for women while mortality rates are higher for men since men have more life-threatening chronic diseases such as coronary heart, cancer, and cardiovascular diseases while women have almost higher rate of chronic disable disorders.[3,4,5,6]
Health-related quality of life (HRQoL) as a measure of well-being is a matter of interesting in health assessment among elderly in compared with traditional mortality-based measures of outcome.[7] The process of aging is corresponded with increasing the incidence of chronic conditions such as obesity, diabetes, hypertension, cardiovascular diseases, and cancers.[8,9,10,11,12,13] All of these chronic conditions influence on the deteriorating HRQoL score, in particular, in elderly (1.8).[14] Regardless of these chronic conditions, some studies in Iranian populations reported a poorer HRQoL in women than men,[15,16,17] but the published reports were almost based on univariate analysis. However, the findings are contradicted among western counterpart elderly.[1,5] The poorer HRQoL in women in western counterparts may be explained partially by differences of demographic and clinical profiles between genders.[5] Little evidences of HRQoL are available between genders with similar demographic and clinical characteristics, and thus, the related issues were remained controversial.[1,5] Therefore, the objective of this study was to investigate the gender differences in HRQoL of Iranian elderly people and to determine to what extent the gender differences in HRQoL can be explained by differential in sociodemographic characteristics and chronic disease conditions.
Methods
Study design and participants
We analyzed the data of a cross-sectional study of Babol HRQoL Project number 2332 that was conducted among urban community-dwelling elderly people of Babol, located in the south of Caspian Sea, the North of Iran in 2014. Seven hundred fifty elderly people (375 men and 375 women) aged 60–90 years were recruited in the study with respected mean age of 67.8 ± 7.8 years. The full description of method of subject selection was described elsewhere.[17] Briefly, a standard two-stage cluster sampling technique was used to select participants in a healthy household survey. Participants with severe disability, dementia, recent diagnosis of cancer, and cardiovascular atherosclerosis were excluded from the study. All participants had given a written consent prior participation in the study. The study protocol was approved by the Ethical Research Council of Babol University of Medical Sciences.
Study instruments and measurements
The trained nurses collected the data by interview with similar instructions at home visit. The demographic data such as age, sex, educational level, marital status, living conditions, and lifestyle data such as smoking status and physical activity were collected with interview using a standard questionnaire. The HRQoL was assessed with a short form of SF-36 questionnaire. This instrument measures the HRQoL in different subscales including physical, psychological, and social functioning and general health. The rating scale of items in this questionnaire varies from 2- to 6-point scales depending on subscales used. For example, items related to functional role limitations and physical functional limitations are rated on 2- and 3-point scales while items on general health and psychological health are rated on 5-point and 6-point scales, respectively. The score of each subscale was converted from 0 (the worst) to 100 (the best) conditions of HRQoL. A high validity and reliability of this instrument was reported in several assessments.[18,19] In this study, the reliability coefficient as measured by Cronbach's alpha was ranged from 0.68 to 0.92 for different domains.
Weight, height, and waist circumference (WC) were measured with standard method. Then, body mass index (BMI) was calculated as weight in kg divided by square of height in m2. The obesity was defined as BMI ≥30 kg/m2 and the abdominal obesity was assessed as WC >102 cm in men and WC >88 cm in women. The diabetes mellitus was defined as fasting blood glucose >126 mg/dl and/or having told by physician/nurses and/or taking medication for controlling blood sugar. The systolic and diastolic blood pressure (BP) was measured two times at home visit with resting period of 10 min, and the average of these two measures was used in analysis. Hypertension was labeled as systolic BP ≥140 mmHg and/or diastolic BP >90 mmHg. The physical activity was assessed by a short form of international physical activity questionnaire.[20,21] The duration (min) per day and frequency (days) per week of each type of activity (walking, moderate, and vigorous-intensity activity) were evaluated. The algorithm of calculating total score of physical activity and its categorization was explained in details elsewhere.[12,22] Briefly, the total physical activity scores in metabolic equivalents minute/week were computed by sum of multiplying of weighting each type of activity by its energy requirement, duration (min), and frequency (days). Then, this total score in continuous scale was categorized at three levels (low, moderate, and high).
Statistical analysis
We used SPSS software, version 18.0. In bivariate analysis, we performed Chi-square test for categorical data to explore the difference in demographic characteristics and chronic conditions between genders. We also applied multiple linear regression models to estimate the gender differences from regression coefficients with men as reference category. The linear multiple regression models were built with total score and score of each subscale of HRQoL as dependent variables with gender, sociodemographic characteristics, physical activity, and chronic conditions as independent variables. The unadjusted regression coefficients as a measure of interest in mean difference in score of HRQoL and the full adjusted with their 95% confidence interval (95% CI) were calculated. The adjusting was carried out for age, marital status, living conditions, educational level, physical activity level, smoking status, and presence of chronic disease conditions such abdominal obesity, diabetes, and hypertension.
Results
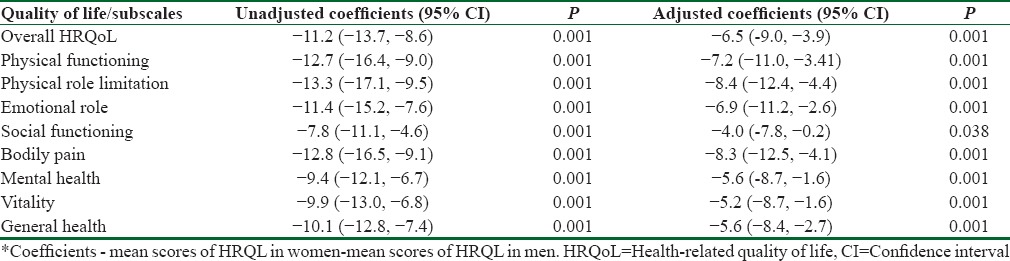
Table 1 shows that the prospective mean of age and its distribution was similar between sexes. While the level of education at high school or above was significantly higher in male versus female (31.2% vs. 17.3%, P = 0.001). A significant greater proportion of women lived alone compared with men (18.5% vs. 7.7%, P = 0.001). Whereas the rate of nonsmoker women was higher than men (96.5% vs. 64.2%, P = 0.001) and more women were inactive or low level of activity (53.0% vs. 39.2%, P = 0.001). In addition, a significant higher proportion of women were diabetic (29.9% vs 20.8%, P=0.001) and obese (40.8% vs 19.8%, P = 0.001), but no significant difference was observed in the prevalence of hypertension between genders (64.6% vs 60%, P = 0.26). Table 2 summarizes the gender differences estimate from regression model with men as reference category. The unadjusted and adjusted mean difference shows that the HRQoL scores were almost significantly lower in women compared with men in all subscale studied. Women have lower in HRQoL score than men prior adjustment. The mean unadjusted differences in scores of HRQoL were −11.2 (95%: −13.7, −8.6) points on scale used from 0 to 100. Adjusting for age, marital status, living conditions, educational level, physical activity, smoking status, and presence of chronic disease conditions reduced the effect size to −6.5 (95% CI: −4.0, −3.9) points but did not remove the gender differences. This shows that gender difference in HRQoL is partially attributable for difference in demographic and clinical profiles. The greatest adjusted difference had been observed as −8.3 (95% CI: −12.2, −4.0) points and −8.4 (95% CI: −12.4, −4.4) points in the subscales of bodily pain and physical role limitation, respectively. The least difference was in domain of social functioning as −4.0 (95% CI: −7.8, 0.02) points.
Table 1.
Demographic characteristics of elderly individuals according to gender
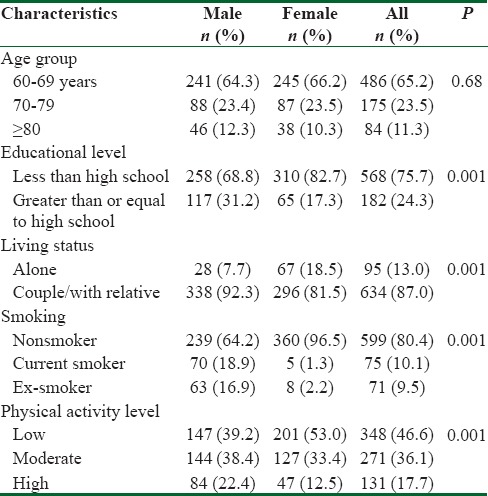
Table 2.
The unadjusted and adjusted regression coefficients* as the mean differences in health-related quality of life scores between genders with 95% confidence interval
Discussion
Our findings indicated that women self-reported HRQoL scores are lower than men in all subscales studied. The full adjusted gender differences in HRQoL scores almost were lower than crude differences. Thus, that the gender differences in HRQoL were appeared partly to be explained by sociodemographic and some chronic disease conditions. Our unadjusted effect of gender differences is rather in accordance with those reported among the US population.[5] While in our findings, the observed adjusted effect of gender is greater than those reported in US population. A large difference in HRQoL has been reported previously by socioeconomic status (SES), income, and educational level.[5,23,24] The lower average income and lower educational level in women appear to account for lower score of HRQoL than men.
In addition, in our finding, the raw difference between genders in HRQoL was similar to those reported by Orfila et al. However, they reported that the gender difference was decreased to nonsignificant level with effect size of −3.2% points after adjusting for the covariates.[1] Their explanation is that the worse differences reported HRQoL in elderly women is mainly due to the higher rate of chronic conditions and disability in women. While in our results, the magnitude of gender differences after full adjusting was reduced substantially, but the gender effect was remained significant that indicated the independent effect of gender on HRQoL scores. Thus, the gender differences were not disappeared by taking into account age, educational level, living and marital status, physical activity, and some chronic disease conditions such as obesity, diabetes, and hypertension. The adjusted estimates of regression coefficients in our analysis were quite significant in all domains of HRQoL studied. This indicated that sociodemographic profiles and chronic disease conditions did not explain fully the gender difference in HRQoL. The poorer HRQoL in women may be attributable to higher rate of nonfatal disable disorders and the difference in the perceived health between sexes. Women may exaggerate their worse health conditions in their health self-reports. Nevertheless, our results are corresponded with Iranian health statistics, and the published reports that showed women were suffered more psychological disorders than men in general population.[15,16,25]
In our study, the gender differences in HRQoL persist even after adjustment of available data of sociodemographic and clinical profiles may indicated either the variation is incompletely measured or other factors that contributing on HRQoL such as income and SES was not measured in this study properly. Nevertheless, we may not measure the full variation of sociodemographic characteristics or even collapsing data in a defined category as indicator variable, it may lose some information for adjustment. Another possible explanation of gender differences in HRQoL is that women may exaggerate their health conditions than men even or women may have a higher rate of self-perceived health on general health, symptoms/signs that may explain why women have lower level HRQoL, and also, they are more referred to physician and health centers than men. The symptoms and the signs related to postmenopausal comorbidities and bone mass reduction due to parity in postmenopausal women may explain the sex difference in HRQoL as well.[26,27]
This study may have some other limitations. The analysis is based on cross-sectional data. Thus, we could not be able to assess the gender difference on changes in HRQoL over times. We also did not measure income that may contribute on HRQoL. In addition, our samples were not included older people that were living in institutionalized centers. However, based on our social cultures, majority of elderly people are living with their own partners or their relatives in study population. Moreover, one might argue that the SF-36 may not well appropriate for QoL assessment of elderly individuals. As an interview administrated instrument, the SF-36 was acceptable among all age groups,[28] but people aged 75 years and over with poor physical conditions may fell unable to complete the questionnaire and missing items are possible for self-completion[28] in particular for frail older people but the use of interview improves the response rate.[28,29] In fact, in the method of our data collection, the SF-36 was not self-administrated, but it was performed by interview in all individuals in the present study. In addition, the majority of elderly people were at age 60–75 years (80%) in our samples and any possible nondifferential misclassification and recall problems in reporting data of QoL would be canceled out in comparison between two sexes in our analysis. On the other hand, the strength of study was the large representative sample, using a standard instrument in assessment of HRQoL with achievement of high rate of reliability coefficients and simultaneous adjustment of potential sociodemographic characteristics and clinical conditions.
Conclusions
On average women have significantly lower scores of self-reported QoL than men in elderly. The apparent differences in HRQoL are partially explained by sociodemographic and clinical profiles between sexes. These findings highlight further professional supports in elderly women to improve their HRQoL.
Financial support and sponsorship
Nil.
Conflicts of interest
There are no conflicts of interest.
Acknowledgments
The data of this study were extracted from elderly HRQoL research project number 2332. The authors would like to thank the Deputy of Research of Babol University Medical Sciences for their support and the nursing students for their assistance in data collection.
References
- 1.Orfila F, Ferrer M, Lamarca R, Tebe C, Domingo-Salvany A, Alonso J, et al. Gender differences in health-related quality of life among the elderly: The role of objective functional capacity and chronic conditions. Soc Sci Med. 2006;63:2367–80. [Google Scholar]
- 2.Kapan RM, Anderson JP, Wingard DL. Gender differences in health-related quality of life. Health Psychol. 1991;10:88–93. doi: 10.1037//0278-6133.10.2.86. [DOI] [PubMed] [Google Scholar]
- 3.Cherepanov D, Palta M, Fryback DG, Robert SA, Hays RD, Kaplan RM. Gender differences in multiple underlying dimensions of health related quality of life are associated with socio demographic and socioeconomic status. Med Care. 2011;49:1021–30. doi: 10.1097/MLR.0b013e31822ebed9. [DOI] [PMC free article] [PubMed] [Google Scholar]
- 4.Bertakis KD, Azari R, Helms LJ, Callahan EJ, Robbins JA. Gender differences in the utilization of health care services. J Fam Pract. 2000;49:147–52. [PubMed] [Google Scholar]
- 5.Cherepanonv D, Palta M, Fryback DG, Robert SA. Gender differences in health-related quality of life are partly explained by socio-demographic and socioeconomic variation between adult men and women in the US: Evidence from four US nationally representative data sets. Qual Life Res. 2010;19:1115–24. doi: 10.1007/s11136-010-9673-x. [DOI] [PMC free article] [PubMed] [Google Scholar]
- 6.Denton M, Prus S, Walters V. Gender differences in health: A Canadian study of the psychological, structural and behavioral determinants of health. Soc Sci Med. 2004;58:2585–600. doi: 10.1016/j.socscimed.2003.09.008. [DOI] [PubMed] [Google Scholar]
- 7.Centers for Disease Control and Prevention, Measuring Healthy Days: Population Assessment of Health Related Quality of Life, US Department of Health and Human Services, National Centers for Disease Prevention and Health Promotion. Division of Adult and Community Health, CDC. 2000:4–9. [Google Scholar]
- 8.Wu S, Wang R, Jiang A, Ding Y, Wu M, Ma X, et al. Abdominal obesity and its association with health-related quality of life in adults: A population-based study in five Chinese cities. Health Qual Life Outcomes. 2014;12:100. doi: 10.1186/1477-7525-12-100. [DOI] [PMC free article] [PubMed] [Google Scholar]
- 9.Shaw JE, Sicree RA, Zimmet PZ. Global estimates of the prevalence of diabetes for 2010 and 2030. Diabetes Res Clin Pract. 2010;87:4–14. doi: 10.1016/j.diabres.2009.10.007. [DOI] [PubMed] [Google Scholar]
- 10.Hajian-Tilaki KO, Heidari B. Prevalence of obesity, central obesity and the associated factors in urban population aged 20-70 years, in the North of Iran: A population-based study and regression approach. Obes Rev. 2007;8:3–10. doi: 10.1111/j.1467-789X.2006.00235.x. [DOI] [PubMed] [Google Scholar]
- 11.Hajian-Tilaki K, Heidari B, Hajian-Tilaki A, Firouzjahi AR, Bagherzadeh M. The discriminator of performance of body mass index, waist circumference, waist-to-hip ratio and waist-to-height ratio for detection of metabolic syndrome and their optimal cutoffs among Iranian adults. IRHS. 2014;14:276–81. [PubMed] [Google Scholar]
- 12.Hajian-Tilaki K, Heidari B, Firouzjahi A, Bagherzadeh M, Hajian-Tilaki A, Halalkhor S, et al. Prevalence of metabolic syndrome and the association with socio-demographic characteristics and physical activity in urban population of Iranian adults: A population-based study. Diabetes Metab Syndr. 2014;8:170–6. doi: 10.1016/j.dsx.2014.04.012. [DOI] [PubMed] [Google Scholar]
- 13.Hajian-Tilaki K. Metabolic syndrome and the associated risk factors in Iranian adults: A systematic review. Caspian J Intern Med. 2015;6:51–61. [PMC free article] [PubMed] [Google Scholar]
- 14.Hajian-Tilaki K, Heidari B, Hajian-Tilaki A. Solitary and combined negative influences of diabetes, obesity and hypertension on health-related quality of life of elderly individuals: A population-based cross-sectional study. Diabetes Metab Syndr. 2016;10:S37–42. doi: 10.1016/j.dsx.2016.01.018. [DOI] [PubMed] [Google Scholar]
- 15.Ahmadvand A, Sepehrmanesh Z, Ghoreishi FS, Afshinmajd S. Prevalence of psychiatric disorders in the general population of Kashan, Iran. Arch Iran Med. 2012;15:205–9. [PubMed] [Google Scholar]
- 16.Nariemani M, Sadeghieh Ahari S, Abdi R. Epidemiological survey of mental disorders in urban region of Ardabil province (Iran) J Psychiatr Ment Health Nurs. 2011;18:368–73. doi: 10.1111/j.1365-2850.2011.01700.x. [DOI] [PubMed] [Google Scholar]
- 17.Hajian-Tilaki K, Heidari B, Hajian-Tilaki A. Health related quality of life and its socio-demographic determinants among Iranian elderly people: A Population based cross-sectional study. J Caring Sci. 2017;6:39–47. doi: 10.15171/jcs.2017.005. [DOI] [PMC free article] [PubMed] [Google Scholar]
- 18.Brazier JE, Harper R, Jones NM, O’Cathain A, Thomas KJ, Usherwood T, et al. Validating the SF-36 health survey questionnaire: New outcome measure for primary care. BMJ. 1992;305:160–4. doi: 10.1136/bmj.305.6846.160. [DOI] [PMC free article] [PubMed] [Google Scholar]
- 19.Montazeri A, Goshtasebi A, Vahdaninia M, Gandek B. The short form health survey (SF-36): Translation and validation study of the Iranian version. Qual Life Res. 2005;14:875–82. doi: 10.1007/s11136-004-1014-5. [DOI] [PubMed] [Google Scholar]
- 20.IPAQ Research Committee. Guideline for Data Processing and Analysis of the International Physical Activity Questionnaire (IPAQ), Short form. 2005. [Last accessed on 2010 Jan 18]. Available from: http://www.ipaq.ki.se .
- 21.Lee PH, Macfarlane DJ, Lam TH, Stewart SM. Validity of the international physical activity questionnaire short form (IPAQ-SF): A systematic review. Int J Behav Nutr Phys Act. 2011;8:115. doi: 10.1186/1479-5868-8-115. [DOI] [PMC free article] [PubMed] [Google Scholar]
- 22.Craig CL, Marshall AL, Sjöström M, Bauman AE, Booth ML, Ainsworth BE, et al. International physical activity questionnaire: 12-country reliability and validity. Med Sci Sports Exerc. 2003;35:1381–95. doi: 10.1249/01.MSS.0000078924.61453.FB. [DOI] [PubMed] [Google Scholar]
- 23.Robert SA, Cherepanov D, Palta M, Dunham NC, Feeny D, Fryback DG, et al. Socioeconomic status and age variations in health-related quality of life: Results from the national health measurement study. J Gerontol B Psychol Sci Soc Sci. 2009;64:378–89. doi: 10.1093/geronb/gbp012. [DOI] [PMC free article] [PubMed] [Google Scholar]
- 24.Hekert MT, Droste EH, Adam JP, Griffin MC, Robert LL, Mueller LL, et al. Gender differences in anticipated salary: Role of salary estimates for other job characteristics career paths and job inputs. Sex Roles. 2002;47:139–51. [Google Scholar]
- 25.Noorbala AA, Bagheri Yazdi SA, Hafezi M. Trends in change of mental health status in the population of Tehran between 1998 and 2007. Arch Iran Med. 2012;15:201–4. [PubMed] [Google Scholar]
- 26.Heidari B, Heidari P, Nourooddini HG, Hajian-Tilaki KO. Relationship between parity and bone mass in postmenopausal women according to number of parities and age. J Reprod Med. 2013;58:389–94. [PubMed] [Google Scholar]
- 27.Bouzari Z, Javadian Kotenaie M, Darzi AA, Hajian K. Lifestyle and demographic factors related to vasomotor symptoms of postmenopausal women who live in North of Iran. World Appl Sci J. 2013;23:1221–30. [Google Scholar]
- 28.Hayes V, Morris J, Wolf C, Morgan M. The SF-36 health survey questionnaire: Is the suitable for use with older adults? Age Aging. 1999;24:120–5. doi: 10.1093/ageing/24.2.120. [DOI] [PubMed] [Google Scholar]
- 29.Parker SG, Peet SM, Jagger C, Farhan M, Castleden CM. Measuring health status in older patients. The SF-36 in practice. Age Ageing. 1998;27:13–8. doi: 10.1093/ageing/27.1.13. [DOI] [PubMed] [Google Scholar]