

Taking advantage of the strong polarity of cells migrating along micropatterned lines, combined with computational modeling and microsurgery, we found that the centrosome must be localized toward the rear of a cell, likely for controlling the distribution of tail formation signals. This discovery clarifies a long-standing controversy in cell biology.
Abstract
The importance of centrosome in directional cell migration has long been recognized. However, the conventional view that centrosome determines cell’s front, based on its often-observed position in front of the nucleus, has been challenged by contradictory observations. Here we show that centrosome defines the rear instead of the front, using cells plated on micropatterned adhesive strips to facilitate directional migration. We found that centrosome is always located proximal to the future rear before polarity is established through symmetry breaking or reversed as the cell reaches a dead end. In addition, using microsurgery to alter the distance of centrosomes from cells’ ends, we show that centrosomal proximity is predictive of the placement of the rear. Removal of centrosome impairs directional cell migration, whereas the removal of nucleus alone makes no difference in most cells. Computer modeling under the framework of a local-enhancement/global-inhibition mechanism further demonstrates that positioning of rear retraction, mediated by signals concentrated near the centrosome, recapitulates all the experimental observations. Our results resolve a long-standing controversy and explain how cells use centrosome and microtubules to maintain directional migration.
INTRODUCTION
Directional cell migration is a coordinated process that requires a defined front-rear polarity maintained by microtubules (Sheetz et al., 1999; Etienne-Manneville, 2013; Zhang et al., 2014). Centrosomes, the main microtubule-organizing center (MTOC) in animal cells (Alberts et al., 2002), have long been proposed to be important for defining the polarity of directional migration (Luxton and Gundersen, 2011).
While centrosomes are actively maintained near the centroid of stationary cells by the balance of pulling/pushing forces (Burakov et al., 2003), in migrating cells they have a more variable position. Centrosome is often found between the leading edge and the nucleus on two-dimensional surfaces (Luxton and Gundersen, 2011). According to the conventional view, impedance of rearward microtubule growth by the nucleus may contribute to a biased distribution of microtubules toward the front of the cell (Luxton and Gundersen, 2011), which, together with the close proximity of the Golgi apparatus to the centrosome and its ability to nucleate microtubules (Efimov et al., 2007; Sutterlin and Colanzi, 2010), may favor the delivery of membrane components and regulatory signals toward the leading edge (Bergmann et al., 1983; Prigozhina and Waterman-Storer, 2004). Hence the localization of the centrosome relative to the nucleus is believed to determine the front of a cell and the direction of cell migration (Kupfer et al., 1982; Ueda et al., 1997).
This hypothesis, however, encountered severe challenges when applied to different cell types and different environmental conditions. For example, PtK epithelial cells preferentially positioned their centrosomes behind the nuclei at the wound edge (Yvon et al., 2002), while Dictyostelium discoideum switched to a posterior centrosome position when migrating in the absence of chemotactic gradient (Sameshima et al., 1988). In addition, centrosome was positioned dynamically relative to the nucleus in some cell types such as neurons in developing zebrafish cerebellum (Distel et al., 2010). When substrate geometry was changed from two dimensions to one or three dimensions, BSC1 epithelial cells and NIH3T3 fibroblasts showed an increased probability to position their centrosomes behind the nuclei toward the rear of the cell (Pouthas et al., 2008; Doyle et al., 2009). These observations argue against the conventional view that centrosome defines the anterior direction by positioning itself in front of the nucleus, especially given the strong persistence during one-dimensional migration (Guo and Wang, 2012; Zhang et al., 2014).
In addressing this long-standing question about the role of the centrosome in directional migration, we took advantage of cells migrating along micropatterned one-dimensional adhesive strips, which offer the advantages of yielding well-defined cell polarity, versatility in the control of migration, and amenability to microamputation due to the elongated cell shape. Furthermore, combined computational modeling and experimental manipulations allowed us to gain insights by generating testable predictions of complex intuitive mechanisms. This combination of experimental and computational approaches has recently led us to a mechanism that maintains cell polarity through microtubule-mediated transport of rear signals away from the leading edge (Zhang et al., 2014). The present study addresses the logical prediction that centrosomes, as a site of high density of microtubules, may be involved in determining the distribution of rear signals and the placement of the tail of a migrating cell.
RESULTS
Centrosome localizes to the rear of migrating cells
Given the reports that centrosomes often localize posterior to the nuclei in cells migrating persistently along one dimension (Pouthas et al., 2008; Doyle et al., 2009), we first examined centrosomal position relative to both the centroid of the cell spreading area (hereafter referred to simply as the centroid of the cell) and the nucleus in cells undergoing one- or two-dimensional migration. Human retinal pigment epithelial (RPE-1) cells expressing GFP-centrin were plated on fibronectin-coated glass coverslips, either as unpatterned two-dimensional surfaces or micropatterned with adhesive strips 10–30 µm in width to obtain cells of well-defined polarity (Doyle et al., 2009; Guo and Wang, 2012; Zhang et al., 2014). Directional migration along adhesive strips is defined as both ends of the cell moving in the same direction within a given period of time. Even though the centroid may move directionally with only one end of the cell moving directionally, the duration of such movement will necessarily be limited if the other end remains stationary. This definition emphasizes the importance of concerted head protrusion and tail retraction to maintain persistent migration.
We found that centrosomes were always localized behind the centroid of cells that underwent directional migration in one or two dimensions, as indicated by its normalized distance Δ from the rear end of the cell. Δ was calculated as the ratio of the first moments of areas behind the centrosome and over the entire cell; Δ = 0.5 for localization at the cell centroid, Δ < 0.5 for localization in the rear, and >0.5 for localization in the front (Figure 1A; see Materials and Methods for details). We found Δ < 0.5 under all the conditions as long as the direction of migration remained unchanged (Figure 1, B and C, and Supplemental Figure S1A). In contrast, centrosomal position relative to the nucleus was variable both among different cells and in the same cell over time (Figure 1, B and C, and Supplemental Figure S1A).
FIGURE 1:

Rear localization of the centrosome in migrating cells. (A) Schematic diagram showing the calculation of normalized distance from the (rear) end of a cell. In the illustration, a cell is moving in the direction of the x-axis, C is the point of interest within the cell, and lC is a line through C and perpendicular to the main axis of the cell. lC bisects the cell into two parts, the Front and the Rear. Normalized distance of C to the rear end is calculated as the product of the area of a thin slice and its horizontal distance from C integrated over the region to the left of line lC, divided by the same integration over the entire cell. (B) Centrosomes are always localized to the rear half of RPE-1 cells undergoing directional migration, independent of their relative positions to the nuclei for cells along linear strips 10–30 µm in width and on two-dimensional surfaces. Cells were either immunostained with pericentrin or transfected stably with GFP-centrin. Normalized distances to the rear indicate that while both the centrosome and nucleus localize to the rear (centrosome, Δ = 0.17 ± 0.01, 0.13 ± 0.01, 0.14 ± 0.01, and 0.20 ± 0.02; nuclear center, Δ = 0.10 ± 0.01, 0.08 ± 0.01, 0.09 ± 0.01, and 0.17 ± 0.03; n = 75, 80, 89, and 20, respectively, from left to right), their relative positions are highly variable. (C) Time-series images of two representative RPE-1 cells expressing GFP-centrin migrating along one-dimensional strips toward the top show that the centrosome (red dots indicated by white arrowheads) remains in a rearward position while showing variable positions relative to the centroid of nucleus (outlined with white dashed lines). (D) Representative images of individual cells migrating directionally along an adhesive strip or on two-dimensional surfaces, and NIH3T3 cells at the wound edge 6 h after wounding, show the relative localization of the centrosome (red dots) and the nucleus (colored in blue or outlined with white dashed lines) within the cell. The front of the cell and the wound edge are toward the right of each image. Scale bar, 25 µm. (E) In directionally migrating RPE-1 cells, the centrosome is more likely to be positioned in front of the nucleus independent of substrate dimensions. In contrast, the centrosome is more likely to be positioned behind the nucleus in NIH3T3 cells both on one-dimensional strips and during two-dimensional spontaneous migration. However, this trend is reversed for NIH3T3 cells at the wound edge 6 h after wounding. CEF cells do not have a clear preference for the centrosome–nucleus relative position. Sample sizes for each group are listed on the right side of the bar graph. (F) The persistence of RPE-1 cell migration in two-dimensional negatively correlates with the normalized distance of the centrosome to the rear of the cell (correlation coefficient = −0.9735, p < 0.0001, n = 11). The image of centrosome is enhanced with a cubic function, see Materials and Methods for details. See also Supplemental Figure S1 and Supplemental Video S1.
To test whether the above observation is cell type specific, we checked centrosomal position in NIH3T3 cells and chick embryonic fibroblasts (CEF) undergoing directional migration. Unlike RPE-1 cells, which tended to have the centrosome in front of the nucleus (Figure 1, D and E), NIH3T3 cells preferred to position the centrosome behind the nucleus during spontaneous directional migration in both one and two dimensions, although this preference was inverted in polarized cells at wound edge (Figure 1, D and E, and Supplemental Figure S1B). In contrast, CEF showed no clear preference in the relative position between centrosome and nucleus (Figure 1, D and E, and Supplemental Figure S1C). Despite these variabilities, both NIH3T3 cells and CEF cells preferred to position the centrosome behind the cell centroid (Figure 1D and Supplemental Figure S1, B and C) during spontaneous directional migration, similarly to RPE-1 cells. For NIH3T3 cells at wound edge, centrosome was reported to stay around the cell centroid as in cells prior to the wound (Gomes et al., 2005). However, although the wound edge closed over time, few cells along the edge migrated as persistently as single cells migrating in one dimension, and the migration direction of individual cells spanned a wide range (Kim et al., 2012; Nnetu et al., 2012).
These results suggest that the position of centrosome relative to the cell centroid, rather than its position relative to the nucleus, is important to directional cell migration. Moreover, on the basis of its rear localization, we hypothesize that centrosome defines the rear of migrating cells, which may in turn promote cell polarity by allowing a more stable and unchallenged front. This hypothesis, exactly opposite to the conventional view that centrosomes directly set the front (Kupfer et al., 1982; Ueda et al., 1997), is supported by scatter plot of the persistence of cells migrating in two dimensions against the normalized distance of the centrosome to the rear (Figure 1F, Supplemental Figure S1D, and Supplemental Video S1), which suggests that rear localization of centrosome correlates with a strong persistence of migration.
Centrosome localizes to the future rear during symmetry breaking
To test the above hypothesis, we examined the position of centrosome in the initial establishment of cell polarity known as symmetry breaking (Cramer, 2010), where the rear of a cell is formed for the first time following symmetric spreading. The establishment of cell polarity and the onset of symmetry breaking was defined as the onset of both ends of the cell moving in the same direction, that is, one end protruding while the other end is retracting. We found that 93% (n = 14) of the time when an RPE-1 cell spreading on a linear strip broke its symmetry, the centrosome was located to the side of the newly formed tail (Figure 2, A and B, and Supplemental Video S2). Close examination revealed that symmetry breaking started with a deviation in centrosome position relative to the centroid of the cell, which we suspect may cause asymmetry in the distribution of factors for defining cell polarity such as small GTPases. Once the offset of the centrosome from the cell centroid reached a threshold, the end closer to the centrosome turned into a tail and the cell established its directional migration (Figure 2C and Supplemental Video S3).
FIGURE 2:

Centrosome localization to the future rear of the cell during symmetry breaking in one dimension. (A) Time series of a representative RPE-1 cell expressing GFP-centrin (red dots indicated by white arrowheads) shows that during symmetry breaking on a linear strip, the side closer to the centrosome becomes the future tail. (B) At the time of symmetry breaking, centrosomes are almost always at the retracting rear side of the cell as revealed by their normalized distance to the future tail (Δ < 0.5, n = 14, p = 0.0004). The normalized positions of the nuclear center (p = 0.0078) and the middle point of cell front-rear axis (p = 0.0042) are plotted for reference. (C) Quantification of a representative cell shows that the relative position of centrosome moves steadily into the future rear starting around 120 min (arrowhead), followed by abrupt symmetry breaking at around 170 min when the rear end retracts rapidly (arrowhead). (D) When a biased centrosome position is generated by cutting different lengths off the two ends of a representative cell (−10 and −1 min), the cell initially forms protrusions at both ends (6 min), then migrates away from the end proximal to the centrosome (red arrowheads), opposite from the original direction. See also Supplemental Figure S2 and Supplemental Videos S2–S4.
To further clarify the causal relationship between centrosome localization and cell polarity, we used microsurgery to cut RPE-1 cells on linear strips to make the centrosome closer to one end than the other end (Supplemental Figure S2A). To control for the effect of cutting wound on cell migration, we cut the cell on both sides of the centrosome but by unequal amounts. Cutting stimulated transient protrusive activities and extensions at both ends before the cell established a new polarity (Figure 2D and Supplemental Video S4). We found that 78% (n = 27) of the cells migrated directionally away from the end closer to the centrosome after the cut as our hypothesis predicted (Figure 2D, Supplemental Figure S2A, and Supplemental Video S4). A close look at the remaining 22% of cells revealed that centrosome moved to the cell center or the opposite side soon after the surgery (Supplemental Video S4), turning the opposite end into a new tail, which is still consistent with our prediction. An alternative explanation for the results is that the migration direction of cells recovered from the microsurgery simply reflects the memory of migration state before the microsurgery, that is, the cell was already about to switch the direction before microsurgery. To test this hypothesis, we randomly picked a group of control cells with centrosome localization similar to experimental cells and followed their migration for 90 min (Supplemental Figure S2B). We found that these control cells rarely reverse their migration direction within a similar period (Supplemental Figure S2C), consistent with the strong persistence of cells migrating along linear strips. This observation suggests that it is the microsurgery that caused experimental cells to switch their direction. Together these results support the notion that centrosome turns the proximal end into a tail.
Centrosome relocation to the future rear leads to directional reversal
Since symmetry breaking may involve a different mechanism from steady-state migration, we next explored the role of centrosome position in RPE-1 cells migrating steadily before reaching the end of a micropatterned strip, which forces the cell to reverse the direction after pausing for a variable period of time. Protrusive activities appeared at the original tail soon after the cell arrived at the dead end, but the cell was unable to start directional migration along an opposite direction (defined as both ends moving away from the dead end), because the original front remained stalled and tethered down. Thus the reversal of directional migration was determined not by the appearance of protrusive activities at the new front, but by the retraction activities at the new tail (Figure 3, A and B). During the stalled period, the centrosome moved toward the stalled front/future tail with occasional fluctuations (Figure 3, A and C, Supplemental Figure S3A, and Supplmental Video S5), reducing its normalized distance to the stalled front (Figure 3B). The extension of the original tail further reduced the normalized distance between the centrosome and the stalled front/future tail (Figure 3B). However, the stalled front did not retract to form a tail until the centrosome had moved to reach Δ = 0.26 ± 0.03 (n = 20) relative to the stalled front (Figure 3E), even with repeated extensions taking place at the opposite end (Figure 3, C and D, and Supplemental Figure S3, A and B). In addition, the time required for the reversal of directional migration correlated with the length of the cell (Figure 3F), supporting the notion that the delay before directional switch is determined by the time it takes for the centrosome to travel to the opposite side of the cell. In addition to the reversal induced by a dead end, spontaneous reversal was also preceded by the relocation of the centrosome toward the original front of the cell (Supplemental Figure S3C). Together these results support the hypothesis that centrosome proximity controls retraction activities required for the formation of a tail, which is in turn required for the establishment of migration polarity.
FIGURE 3:

Centrosome repositioning leading to directional reversal at the end of an adhesive strip. Kymograph (A) and quantitative analysis (B) of a representative RPE-1 cell expressing GFP-centrin shows the reversal of cell migration at the end of a strip. After the bottom end of the cell hits the end of the strip at around 170 min, the top end continues to retract until it eventually turns into a protrusion at around 240 min, whereas the centrosome (red dots) continues to move toward the strip end between 170 and 280 min, followed by the retraction of the stalled bottom end of the cell and the reversal of cell migration at around 320 min (specific time points are highlighted with red arrowheads). Time series images (C) and quantitative analysis (D) of a representative RPE-1 cell expressing GFP-centrin shows that prior to directional reversal at the end of a linear strip (144 min, when a new tail forms at the previous front; end of the strip located at the bottom of the images), the centrosome (red dots, indicated by white arrowheads) moves continuously toward the stalled leading edge. Note episodes of protrusion at the opposite end without the reversal of migration direction (36 min, 108 min) before the centrosome moves sufficiently close to the future tail. (E) Analysis of RPE-1 cells at the time of migration reversal indicates that centrosomes are almost always located in the future rear (Δ < 0.5, n = 20, p < 0.0001). (F) Longer cells spend a longer period of time at the end of strip before they are able to reverse migration direction (n = 20, p < 0.0001), which may be explained if it takes a longer time for the centrosome to approach the opposite end in longer cells before the cell is able to switch its migration direction. See also Supplemental Figure S3 and Supplemental Video S5.
Centrosome but not nucleus is required for directional cell migration
Owing to the proximity between centrosome and nucleus (Tanaka et al., 2004), rear localization of the centrosome often applies to the positioning of nucleus as well (Figure 1B and Supplemental Figure S1, B and C), raising the question that cell nucleus, in addition to or instead of the centrosome, may be involved in defining the rear of migrating cells. To clarify this question, we first generated enucleated cytoplasts by centrifuging cells in the presence of cytochalasin B (Prescott et al., 1972). Immunofluorescence staining of pericentrin or γ-tubulin showed that 99% (n = 72) of RPE-1 cytoplasts and 93% (n = 110) of NIH3T3 cytoplasts generated with this method still contained a centrosome (Karsenti et al., 1984). These cytoplasts migrated as persistently as control cells along linear strips (Figure 4A, Supplemental Figure S4A, and Supplemental Video S6). Similar results were observed with CEF cytoplasts that contained a centrosome (Supplemental Figure S4B and Supplemental Video S6), although only 65% (n = 136) of enucleated CEF cells still contained a centrosome. These results indicate that the nucleus is dispensable for persistent migration.
FIGURE 4:

Requirement of the centrosome but not the nucleus for cell polarization. (A) Enucleated centrosome-containing RPE-1 cytoplasts are able to migrate as persistently as control cells. (B) Time series shows a typical centrosome-containing RPE-1 cytoplast created by microsurgery, migrating directionally after initial extension at the cut end (37 min), with the centrosome located nearby. The cut end subsequently turns into the tail (57 min; centrosome indicated with red arrowheads). (C) In contrast, a typical cell fragment without a centrosome shows only oscillatory migration along a linear strip. (D) Another acentrosomal fragment (centrosome located in the piece cut off as indicated by red arrowheads) continues to extend at the cut end while exhibiting defects in retraction indicated by the formation of an elongated tail. (E) Microsurgically generated cell fragments migrate persistently as long as centrosome is present (CsNuc and CsOnly) but much less persistently when centrosome is absent (NucOnly and Neither). The presence or absence of a nucleus does not make a significant difference to the persistence of migration (CsNuc vs. CsOnly, NucOnly vs. Neither). CsNuc/Neither represents cell fragment containing both/neither a centrosome and/nor a nucleus; CsOnly/NucOnly represents cell fragment containing either a centrosome or a nucleus. See also Supplemental Figure S4 and Supplemental Videos S6–S9.
To further elucidate the role of centrosomes versus nuclei in directional cell migration, we used needle microsurgery to create RPE-1 cell pieces similar in size but with or without a centrosome and/or nucleus. Pieces with neither a centrosome nor a nucleus were unable to migrate directionally (n = 23), although some showed oscillatory movements similar to those induced upon microtubule disassembly (Zhang et al., 2014) (Figure 4C). To the contrary, all of the pieces with both a centrosome and a nucleus (n = 25) were able to migrate directionally (Figure 4E). Among cell pieces containing either a centrosome or a nucleus, 67% of the centrosome-only pieces (n = 9) resumed directional migration and front-rear morphological polarity 38 to 230 min post cutting (Figure 4B and Supplemental Video S7). The remaining 33% became immobilized despite protrusive activities, possibly due to the disruption of cell shape common to these cells, causing severe tail-like constrictions over an extended region flanking the centrosome (Supplemental Video S8). In contrast, nucleus-only pieces showed defects in retraction and migration persistence (Figure 4E), with 67% (n = 9) of them slowly drifting toward one direction over an extended period of 37–409 min (Figure 4D and Supplemental Video S9). Among these cells half eventually developed a front-rear morphological polarity 413 to 1232 min post cutting. Similar defects were observed with cell pieces containing neither a centrosome nor a nucleus (Supplemental Video S9). Defects in cell polarization and migration were also reported previously when centrosomes were ablated by laser irradiation (Wakida et al., 2010). Together these results suggest that while the nucleus may be important for cell migration in the long run, centrosomes play a more immediate role in promoting retraction activities at the rear to maintain a stable tail.
The effect of centrosomes on tail activities may be explained by modulating the distribution of inhibitory signals
The local-enhancement/global-inhibition (LEGI) mechanism has been proposed to explain various migration-related cell behaviors both in chemotaxis (Levchenko and Iglesias, 2002; Ma et al., 2004) and in the absence of external guidance cues (Satulovsky et al., 2008; Zhang et al., 2014). In the LEGI mechanism, two antagonistic signals are released at the site of protrusion, one is a localized excitation/positive signal that can self-amplify for sustaining local protrusive activities, and the other is a global inhibitory/negative signal that spread across the cell to suppress protrusive activities elsewhere and promote the formation of a tail. The distribution of net signals then defines cell polarity. We previously suggested that microtubules are required for the efficient transport of inhibitory signals away from the protrusions (Zhang et al., 2014), which implies that the centrosome, as the main MTOC, may determine the distribution of these inhibitory signals. Centrosome may in effect serve as a source of inhibitory signals following transport away from the leading edge. This hypothesis appears intuitively compatible with not only the rear localization of centrosomes during persistent directional migration but also the relocation of centrosomes prior to directional reversal and symmetry breaking.
We used computational simulations based on a modified LEGI mechanism to verify the above intuitive hypothesis (Figure 5, Supplemental Figure S5A, and Supplemental Video S10). Instead of a uniform distribution of inhibitory signals for their “global” effect as hypothesized in the original LEGI mechanism (Parent and Devreotes, 1999; Satulovsky et al., 2008), inhibitory signals were assumed to undergo both diffusion and directional transport toward the centrosome from the anterior region. Our computer simulation demonstrated that rear localization of the centrosome ensured directional migration to be persistent under this condition (Figure 5, A and F). In addition, as model cells reached the end of a linear strip (Figure 5G), initial localization of the centrosome close to the free end kept the stalled end from forming a stable tail (Figure 5, B, left, and H). Relocation of the centrosome toward the stalled end then promoted its retraction to form a new tail (Figure 5, B, right, and I). This model also regenerated symmetry breaking; stochastic fluctuations of centrosomal position, coupled to the relative decrease in protrusion signals as the cell spread out, caused the end closer to the centrosome to stop protrusion and turn into a tail (Figure 5, C and E).
FIGURE 5:

Computer modeling of the effect of centrosome position on cell polarity through the distribution of inhibitory signals. (A) In a LEGI type model for controlling cell migration, both inhibitory (red dots) and excitation (green dots) signals are generated at the front. While excitation signals remain localized, inhibitory signals are transported along microtubules to reach a higher concentration near the centrosome (blue dot) than elsewhere, where they induce retraction in the region nearby (green star denotes the front and red star denotes the rear). (B) During directional reversal at the end of a strip (black bar), protrusion takes place at the original tail soon after the original front reaches the dead end, which causes a decrease in the generation of both excitation and inhibitory signals at the original front. As the new protrusion at the opposite end starts to send inhibitory signals to the centrosome, the stalled original front is initially unable to turn into a tail due to the long distance from the centrosome, where retraction signals are concentrated (Stage 1). The probability of retraction increases as the centrosome moves toward the stalled front end causing a corresponding shift of inhibitory signals (Stage 2), eventually turning it into a retracting tail (Stage 2, red star). (C) During symmetry breaking in one dimension, both ends protrude during early stages while sending inhibitory signals to the centrosome. As the cell spreads out, the end closer to the centrosome eventually receives a sufficient concentration of inhibitory signals to cause retraction. (D) Kymograph of a representative simulated cell (thick gray band represents the position of the cell) shows the process of symmetry breaking (time point e), followed by directional reversal at the end of the strip (time point i). Symmetry breaking takes place with a normalized position of centrosome at ∼0.35 (time point e). The simulated cell then undergoes directional migration (time point f) until it reaches a dead end (time point g), where the cell stops for ∼90 min while the centrosome continues its movement toward the original front (red trace between g and i). The simulated cell eventually switches its polarity when normalized centrosome position reaches ∼0.7 (time point i). (E–I) The distributions of the inhibitory (red trace) and excitation (green trace) signals along the cell length, as well as the position of the centrosome (dotted blue line), at time points of e-i are shown in the corresponding graphs. See also Supplemental Figure S5 and Supplemental Video S10.
DISCUSSION
Despite the widely recognized importance of the centrosome in directional cell migration, its exact role in defining the direction of migration was confusing, especially when considering the variable relative position between the centrosome and nucleus (Luxton and Gundersen, 2011). In this study, using a combination of experimental and computational approaches, we demonstrated that it is neither nucleus by itself nor the relative centrosome-nucleus position, but the position of the centrosome, and/or a closely associated structure such as the Golgi apparatus (Pouthas et al., 2008), relative to the centroid and ends of the cell that is important for generating a tail for directional migration.
We first showed that centrosomes were always localized posterior to the centroid in cells migrating persistently in one and two dimensions. While many findings based on cells cultured on in vitro flat surfaces may not be readily extended to cells in a more physiological three-dimensional environment (Baker and Chen, 2012), the similarity between cells migrating in one- and three-dimensional fibrillar structures, especially the similarity in centrosomal localization (Doyle et al., 2009), suggests that our finding based on adhesive lines may be applicable to cells migrating directionally in three dimensions. We further showed that the establishment of cell polarity in symmetry breaking or directional reversal was preceded by the positioning of centrosome to the future rear side. In addition, using microsurgery to manipulate the otherwise uncontrollable relative position of the centrosome within the cell, we demonstrated a causal relationship that proximity to the centrosome facilitated tail formation regardless of the original polarization state and the order of cutting (Supplemental Figure S2A).
Microsurgery was also used to distinguish the role of centrosome versus nucleus in directional migration. Defects in migration persistence were found in cells/cytoplasts lacking a centrosome, while the presence or absence of the nucleus made no difference to the persistence (Figure 4E). Although nucleus-only cell pieces were also able to develop their migration polarity, it took a much longer period of time compared with centrosome-containing cytoplasts (Figure 4D and Supplemental Video S9), possibly due to the development of a centrosome-less MTOC, for example, around the Golgi apparatus (Efimov et al., 2007), to organize microtubules and inhibitory signals. Hence centrosome may play a primary role in maintaining the directionality of cell migration by organizing the microtubule network and promoting tail formation (Karsenti et al., 1984; Rodionov et al., 1999), while the nucleus may play a secondary role by maintaining cell viability or shape.
Consistent with the idea that the centrosome is important for cell directionality by defining the rear, and with our previous finding that microtubules maintain cell polarity by transporting inhibitory signals away from the front (Zhang et al., 2014), computational simulations of centrosomes as the destination of transport and an effective source of inhibitory signals successfully recapitulated all the processes including symmetry breaking, directional migration, and directional reversal (Figure 5D and Supplemental Video S10). Interestingly, centrosome-containing cytoplasts often showed striking constrictions around the centrosome (Supplemental Video S8), which implies that without a nucleus to maintain certain distance of the centrosomes from the cell periphery, the high concentration of inhibitory signals around the centrosome could potentially turn lateral regions into tails (Figure 5).
Our experimental and modeling results suggest that proximity of the cell periphery to centrosome increases its probability of retraction, which may further decrease the distance of the centrosome to the rear, forming a positive feedback loop to maintain a rear position of centrosomes and enhance rear retraction activities. Together with a local positive feedback to enhance protrusive activities at the front under the LEGI mechanism, these complementary feedback loops stabilize the polarity of spontaneous cell migration. However, under conditions that stimulate strong protrusive activities at the front, such as chemotaxis or following a wound (Ueda et al., 1997, Gomes et al., 2005), positive feedback at the front may be sufficient to initiate/maintain a stable polarity without a consistent rear localization of the centrosome (Gomes et al., 2005). The presence of a strong frontal guidance cue may also allow the appearance of stable polarization in cells with migration defects (Chen et al., 1994). This may explain why cells in 2D are able to initiate directional changes following reorientation of the centrosome without a clear rear localization (Ueda et al., 1997), which may become apparent only after the cell has established a strong persistence (Figure 1F and Supplemental Figure S1D).
It is also noteworthy that fish keratocytes or their fragments are able to migrate persistently without a centrosome and/or microtubules (Euteneuer and Schliwa, 1984; Verkhovsky et al., 1999), where our previous modeling showed that a strong positive feedback at the front may boost the persistence while the broad lamellipodia and their short distance from the rear in small cells or fragments may allow inhibitory signals to reach the rear without microtubules (Satulovsky et al., 2008), for example, by fast diffusion or with the assistance of actin flows (Maiuri et al., 2015). In addition, motile cytoplasts of immune cells are often chemotactic despite lacking most cytoplasmic organelles (Huang et al., 1991), which is not out of expectation as the chemotactic sensors and receptors may remain on the membrane of the cytoplasts. For other cell types such as fibroblasts, our results suggest that persistence is maintained by coupling local enhancement at the front to microtubule-and-centrosome-facilitated distribution of retraction signals toward the back, rather than globally distributed retraction signals as suggested in the original LEGI model. Centrosomes affect the distribution of microtubules, thereby the inhibitory signals. However, we cannot rule out the possibility that centrosomes also facilitate the delivery of signals toward the leading edge to enhance protrusions (Bergmann et al., 1983; Prigozhina and Waterman-Storer, 2004).
Finally, what mechanisms may be responsible for the rear positioning of centrosomes prior to the onset of directional migration? It is noteworthy that for all the experiments, frontal protrusion appears to be an early event, followed by rear positioning of the centrosome then by the onset of tail retraction and directional migration. It is therefore plausible to assume that a protrusive front activates rearward transport for the centrosome. Possible mechanisms include the actin retrograde flow and asymmetric distribution of microtubule-dependent motor activities. It was also proposed that actin flow and minus-end-directed transport along microtubules may play complementary roles in distributing polarity cues and enhancing cell polarity (Maiuri et al., 2015), such that under certain circumstances either mechanism alone may be sufficient for maintaining cell polarity.
MATERIALS AND METHODS
Cell culture, live-cell imaging, and immunofluorescence staining
All cell lines were maintained at 37°C with 5% CO2, with RPE-1 cells stably expressing GFP-centrin in DMEM/F12 (Life Technologies, Grand Island, NY) supplemented with 10% fetal bovine serum (FBS; HyClone Laboratories, Logan, UT), NIH3T3 cells in DMEM (Life Technologies) supplemented with 10% donor adult bovine serum (HyClone Laboratories), and CEF (passage number ≤7, prepared as described in Clark [ 1976]) in advanced DMEM supplemented with 10% FBS. Serum-starvation medium for NIH3T3 cells contains 0.5% donor adult bovine serum. All media were supplemented with 2 mM l-glutamine, 100 µg/ml streptomycin, and 100 U/ml penicillin (Life Technologies).
Phase-contrast images of enucleated cells for persistence analysis were collected with a Nikon Eclipse Ti microscope using a 10× PlanFluor N.A. 0.30 dry objective lens. For quantifying relative localization of the centrosome within cells, pairs of phase-contrast and fluorescent images were collected using a 40× Fluar N.A. 1.30 oil immersion objective lens on a Nikon Eclipse Ti microscope, or a 40× Plan NeoFluar N.A. 0.75 dry objective lens on a Zeiss Axiovert 200M microscope equipped with a micromanipulator (Leica Microsystems, Buffalo Grove, IL) for needle microsurgery experiments. Images were collected every 4 or 6 min for a period up to 20 h. All images were taken with either an iXon DV887 or an iXon DU897 camera (Andor Technology, Belfast, UK) using custom software. To avoid the complication of cell–cell interactions on migration, only isolated single cells were analyzed.
Immunofluorescence images were acquired by fixing the cells with 4% formaldehyde (Thermo Scientific, Rockford, IL) in phohphate-buffered saline (PBS) and staining with antibodies against pericentrin (Abcam, Cambridge, MA) or γ-tubulin (Sigma-Aldrich, St. Louis, MO) followed by Alexa Fluor 488-labeled secondary antibodies (Life Technologies). Hoechst 33342 (Sigma-Aldrich) were used to visualize cellular nuclei following published procedures (Thermo Fisher Scientific, Waltham, MA).
Micropatterning using linear polyacrylamide
Linear micropatterned strips were prepared by blocking areas outside the strip with linear polyacrylamide as described previously (Guo and Wang, 2011). Briefly, coverslips were activated with Bind-Silane (Sigma-Aldrich), and areas for cell adhesion were covered with a positive photoresist SPR-220 (MicroChem, Newton, MA). Following development of the micropattern, the uncovered areas outside the strip were made nonadhesive by grafting linear polyacrylamide to the Bind-Silane-activated glass surface. Photoresist-protected adhesive regions were then exposed by stripping off the photoresist. The micropatterned substrates, as well as unpatterned substrates, were incubated for 30 min with 20 µg/ml fibronectin (Sigma-Aldrich) with or without the conjugation of Alexa Fluor 568 dye (Invitrogen, Eugene, OR), before plating the cells.
Needle microsurgery
Needle microsurgery was performed as previously reported (Hinchcliffe et al., 2001). Long flexible glass needles were prepared by pulling microcapillaries (FHC, Bowdoin, ME) with a vertical micropipette puller (David Kopf Instruments, Tujunga, CA) and slightly bent with a microforge (Narishige, Tokyo, Japan). The microneedle was mounted on a micromanipulator (Leica Microsystems) and brought down at defined locations of the cell to physically cut the cell into two pieces, one of which was then removed by the microneedle so it would not interfere with the movement of the piece of interest. A second cut, if performed, was applied soon after the cell piece regained its attachment to the substrate. Only cell pieces that resumed a spread morphology were analyzed.
Enucleation
Enucleation was performed as reported previously (Prescott et al., 1972; Prescott and Kirkpatrick, 1974). Briefly, RPE-1 and NIH3T3 cells cultured on a circular coverslip 22 mm in diameter were transferred into a 50-ml centrifuge tube with cell side facing the bottom of the tube. The centrifuge tube contained 3 ml culture medium with 20 µM cytochalasin B (Sigma-Aldrich) prewarmed to 37°C. Enucleation was induced by centrifuging at 10,000 × g for 20 min in a Sorvall RC-28S centrifuge using a Sorvall F-28/50 rotor (Kendro Laboratory Products, Newtown, CT). The circular coverslip was then washed with warm PBS and transferred into fresh medium. Cells/cytoplasts that remained on the coverslip were used for further analysis. The enucleation condition was slightly different for CEF, which was centrifuged at 18,000 × g for 40 min.
Scratch wound healing assay
NIH3T3 cells were grown on glass substrates until they were just confluent. Cells were then washed once with PBS and cultured in serum-starvation medium for 2 d. Wounding of the cell monolayer was performed by scraping off a narrow strip of cells with a 200-µl pipette tip. The sample was then washed twice with PBS and cultured in normal medium for 6 h before fixation.
Image analysis
Image processing was carried out using ImageJ (National Institutes of Health, Bethesda, MD) and MATLAB (MathWorks, Natick, MA). Cell shapes were outlined manually from phase-contrast images. Nuclei were segmented either manually with phase-contrast images or automatically with Hoechst 33342 staining using a threshold-based algorithm. Centrosome localization was detected automatically under manual supervision with a peak-detection algorithm. A cubic function,  , was used to rescale the intensity of most images with GFP-centrin to enhance the point feature against the background for better visualization of centrosomes. Here I is the intensity of each pixel normalized to the range of (0,1), and the subscripts represent the new and original intensity, respectively.
Centroid of the cell spreading area was calculated from the cell outline and simply referred to as the centroid of the cell. Normalized distance, Δ, from a reference end, usually the rear end unless otherwise stated, was used for quantifying the relative localization of the centrosome/nucleus within a cell and to facilitate the comparison of relative positions among different cells. A point at the opposite end of the cell had a normalized distance of 1 to the reference end, while a point at the centroid of the cell had a value of 0.5, and a point at the reference end had a value of 0. A schematic illustration of the calculation is shown in Figure 1A and in the equations given below. For a cell moving along the direction of x-axis, lC is a line perpendicular to the x-axis at a point of interest C, to bisect the cell into two parts, the Front and the Rear. The normalized distance of C relative to the rear end is defined as the ratio between the first moment of the Rear area and the total moment:
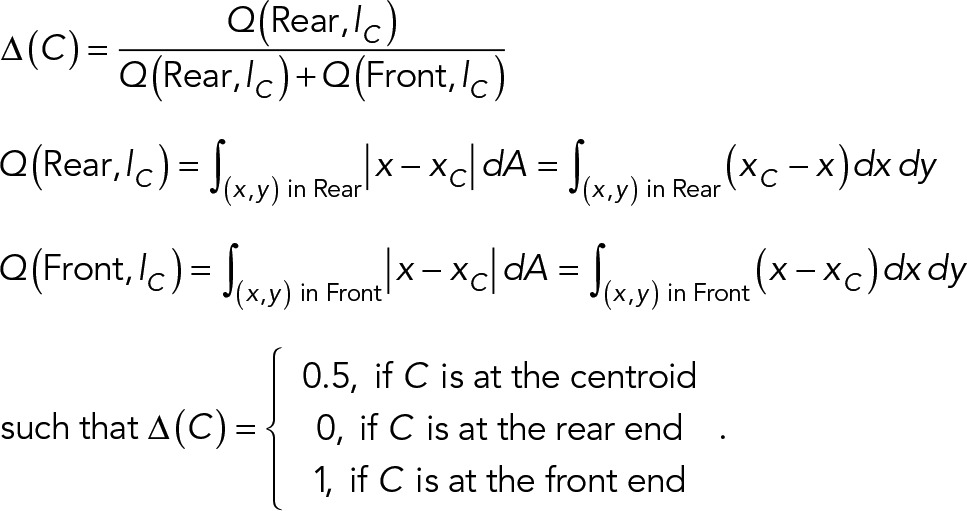 |
The normalized distance of point C to the opposite end of the cell is then 1 - Δ(C).
Establishment of cell polarity was defined as the onset of both ends of the cell moving in the same direction, that is, one end protruding while the other end retracting, instead of the simply onset of cell protrusions or centroid movements. Consequently a cell is considered as migrating directionally only if both ends of the cell is moving in the same direction rather than based on directed movement of the centroid. Similarly, symmetry breaking was defined as the onset of both ends of a cell moving in the same direction following initial symmetric spreading with the two ends moving in opposite directions. Only cells that established a stable polarity for at least 2 h after they broke symmetry were analyzed.
For the analysis of cell migration, images were first aligned either according to their global lab coordinates or using fixed features in phase-contrast images for correcting minor translations. Persistence was defined as a ratio of net migration distance divided by the total path length, based on the position of cell centroid except for enucleated cytoplasts migrating along 10-µm-wide strips, where the two ends of the cell were tracked and the center of the two ends were used to generate the migration path over a period of 5 h. For cell migration in two dimensions, the trajectory of the cell centroid over a 1-h period were used to calculate the corresponding persistence and averaged over a total period up to 5 h. For microsurgically generated cell fragments, the trajectory of cell centroid over a 2-h period was used for calculating the persistence, with the starting point set at 1 h after cutting. Cell fragments that were immobile due to constriction (Supplemental Video S8) were excluded from the persistence analysis.
A cell on unpatterned glass was considered as migrating directionally if it did not change its migration direction for more than 90° over a 1-h period and if its speed remained no less than 25% of the average migration speed in two dimensions. The direction of the instantaneous velocity vector was used for defining the direction of two-dimensional migration, which was then used for calculating the normalized distance of centrosome. A fixed cell on a micropatterned strip was considered polarized if it had a clear broad end and a sharp end.
Statistical analysis
Data normality was tested with the Shapiro–Wilk test. Unless data were tested to be normal and variances were similar for groups being compared, nonparametric statistical tests were used. Two-sided tests were used wherever applicable. Statistical significance was identified if the tested p-value was smaller than 0.05(*), 0.01(**), or 0.001(***). When multiple pairwise comparisons were performed, the Bonferroni correction was employed to adjust the significance level. All statistic tests were performed with Prism 6 (GraphPad Software, La Jolla, CA). Data are presented as mean ± SEM.
Specifically, Figure 1F was tested with Pearson’s correlation with Student’s t test (p < 0.0001, n = 11), Figure 2B was tested with one-sample t test (p = 0.0004, 0.0078, and 0.0043, respectively, n = 14), Figure 3E was tested with the Wilcoxon signed rank test (p < 0.0001, n = 20), and Figure 3F was tested with Spearman’s rank correlation with a permutation test (p < 0.0001, n = 20). Figure 4A was tested with the Mann–Whitney rank sum test (p = 0.2771, n = 28 and 61). In Figure 4E, the Kruskal–Wallis test was used to compare the first three groups (Control, CsNuc, and CsOnly, with n = 9, 7, and 6, respectively, p = 0.5370). The Mann–Whitney rank sum test was used to compare the last two groups (NucOnly and Neither, with n = 9 and 8, p = 0.3148), both of which were compared with the control group with the Mann–Whitney rank sum test (p = 0.0056 and 0.0055, respectively). Supplemental Figure S1D was tested with Pearson’s correlation with Student’s t test (p = 0.0281, n = 10). Supplemental Figure S2C was tested with Fisher’s exact test (p = 0.0008, n = 17 for both groups). Supplemental Figure S4, A and B, was tested with the Mann–Whitney rank sum test (p = 0.6048, n = 22 and 62 for NIH3T3 cells; p = 0.2714, n = 62 and 44 for CEF).
Mathematical Simulation
Simulation of cell migration.
Simulation of cell migration in one dimension was implemented as described previously (Zhang et al., 2014). Cell geometry is represented as narrow rectangles with the perimeter divided by 360 equally spaced points along the two lateral edges of the rectangle (Supplemental Figure S5A). Signals along the two lateral edges were assumed to be the same due to the narrow width of the cell. Protrusion was allowed only at the two ends. The origin of the linear coordinate system was set at the initial middle position of the rectangle (Supplemental Figure S5A). Subsequent positions of the cell center, xcc, were then tracked relative to the origin.
The conceptual excitation and inhibitory signals, each of which may involve multiple chemical signals, in the LEGI-type model were controlled by two diffusion-advection equations as described previously (Zhang et al., 2014):
 (1) (1)
|
 (2) (2)
|
where S+(x, t)/S−(x, t) are the excitation/inhibitory signals at a given location x and time t, f +/f − are constants that control nonstochastic signal generation, D+/D− are the diffusion coefficients of the respective signals, −δ is the decay rate of the signals, g represents the stochastic generation of excitation signals, and τ is a time lag between the generation of excitation and inhibitory signals. ∇ represents spatial gradient and f + = f − = 0 in regions where net signal S(x, t) = S+(x, t) − S−(x, t) ≤ 0⋅ N(g, g2) is a Gaussian distribution with an average of g and a variance of g2. V = | V | is the effective rate of transport of the inhibitory signals away from the site of protrusion and V points toward the centrosome. Inhibitory signals are transported only away from a protruding end, such that V = 0 between the centrosome and a nonprotruding end of the cell (Supplemental Figure S5A).
Cell shape changes and cell migration were simulated as previously described (Zhang et al., 2014):
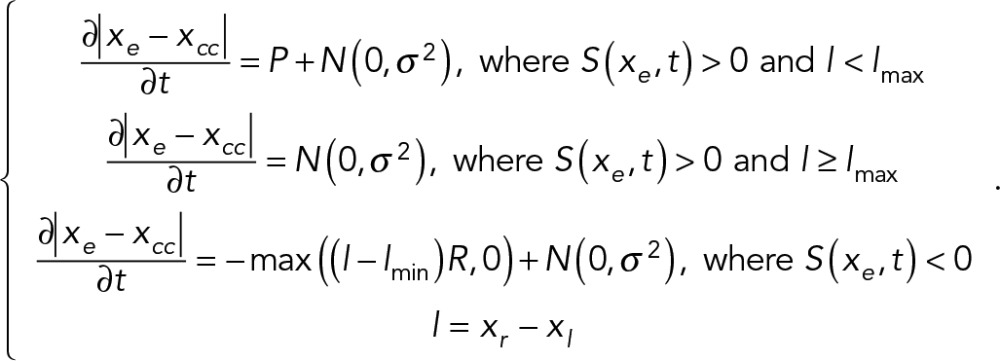 (3) (3)
|
Here l is the length of the cell, lmin/lmax is the minimum/maximum length of the cell. xe(e = r, l) are the points representing the right and left end of the cell, respectively. P is the average protrusion rate, whereas R is the fractional retraction rate. N (0, σ2) is a white noise in cell protrusion/retraction. Once the positions of the ends were determined, the remaining positions in between were determined by spacing them evenly across the length of the cell (Supplemental Figure S5A).
As a feedback regulation to prevent cells from elongating indefinitely, following the determination of cell length at each time step, the concentration of the excitation signal, S+(x), is scaled according to the updated cell length:
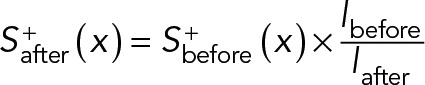 (4) (4)
|
The subscript before/after indicates the value before and after the update at each time step, respectively. In addition, to prevent signals from going to infinity in some cases, an upper limit of 1000 arbitrary units (a.u.) was imposed for S+ and S− as a simplified representation of the saturation concentration of the respective signals.
Centrosome movement.
Although the positioning and movement of centrosomes in stationary interphase cells have been extensively studied (Burakov et al., 2003; Zhu et al., 2010), less is known in migrating cells. We simulated the movement of the centrosome in our model according to several key features described in the literature or observed in our experiments: 1) Centrosomes are centered in stationary cells mainly by microtubule-dependent dynein pulling forces (Burakov et al., 2003); 2) centrosomes are located to the rear in migrating cells; 3) the normalized distance between the centrosome and the rear edge reaches a relative stable value (Δ0 = 0.16 ± 0.02, n = 20) soon after the initiation of retraction (Figures 2C and 3B); and 4) centrosomes gradually move toward the stalled leading edge during directional reversal, independent of the protrusion at the opposite end (Supplemental Figure S3, A and B).
While the mechanism of centrosome positioning is beyond the scope of the present study, the following simplified approach was taken to simulate the process in one-dimenisonal models. We assume that the speed of the centrosome is proportional to its normalized distance from a nonprotruding end of the cell, with the relative speed against the nonprotruding reference end expressed as
|
|
where vcs is a proportional constant, Vrel is the relative speed directing away from the reference end, while Vcs and Vref are the absolute speed of the centrosome and the reference end in the lab frame, respectively, Δ is the normalized distance to the reference end and Δ0 is the steady-state position. Such a linear relationship was observed for cells undergoing migration along a linear strip (Supplemental Figure S5B).
If the opposite end is also nonprotruding, then the relative movement of the centrosome will center itself around the centroid of the cell as described below,
|
|
which causes the centrosome to localize to a position of Δ = 0.5. Vopp is the absolute speed of the opposite end.
In addition, a Gaussian noise is added to the position of the centrosome, xcs, to simulate its fluctuation due to stochastic forces,
 (7) (7)
|
where ε2 is the variance of the noise that can be quantified from cells undergoing symmetry breaking in which both ends are protruding such that Vcs = 0, and the movement of the centrosome is assumed to only come from stochastic fluctuations.
To simulate symmetry breaking, the cell is initiated with a length of 20 µm with uniform excitation/inhibitory signals of 50 a.u., and the centrosome is placed at the middle of the cell. To simulate directional reversal at strip ends, the simulated cell is confined to a 500-µm range along the cell axis beyond which no protrusions are allowed. Parameters used in our simulation are listed in Supplemental Table S1.
Supplementary Material
Acknowledgments
This work was supported by Grant GM-32476 from the National Institutes of Health (to Y.-L.W.). We thank Stephen Doxsey, University of Massachusetts Medical School, for providing RPE-1 cells stably expressing GFP-centrin.
Abbreviations used:
- CEF
chick embryonic fibroblast
- LEGI
local-enhancement/global-inhibition
- MTOC
microtubule-organizing center
Footnotes
This article was published online ahead of print in MBoC in Press (http://www.molbiolcell.org/cgi/doi/10.1091/mbc.E17-06-0366) on August 30, 2017.
REFERENCES
- Alberts B, Johnson A, Lewis J, Raff M, Roberts K, Walter P. Molecular Biology of the Cell. New York: Garland Science; 2002. [Google Scholar]
- Baker BM, Chen CS. Deconstructing the third dimension—how 3D culture microenvironments alter cellular cues. J Cell Sci. 2012;125:3015–3024. doi: 10.1242/jcs.079509. [DOI] [PMC free article] [PubMed] [Google Scholar]
- Bergmann JE, Kupfer A, Singer SJ. Membrane insertion at the leading edge of motile fibroblasts. Proc Natl Acad Sci USA. 1983;80:1367–1371. doi: 10.1073/pnas.80.5.1367. [DOI] [PMC free article] [PubMed] [Google Scholar]
- Burakov A, Nadezhdina E, Slepchenko B, Rodionov V. Centrosome positioning in interphase cells. J Cell Biol. 2003;162:963–969. doi: 10.1083/jcb.200305082. [DOI] [PMC free article] [PubMed] [Google Scholar]
- Chen P, Ostrow BD, Tafuri SR, Chisholm RL. Targeted disruption of the Dictyostelium RMLC gene produces cells defective in cytokinesis and development. J Cell Biol. 1994;127:1933–1944. doi: 10.1083/jcb.127.6.1933. [DOI] [PMC free article] [PubMed] [Google Scholar]
- Clark WA. Selective control of fibroblast proliferation and its effect on cardiac muscle differentiation in vitro. Dev Biol. 1976;52:263–282. doi: 10.1016/0012-1606(76)90245-1. [DOI] [PubMed] [Google Scholar]
- Cramer LP. Forming the cell rear first: breaking cell symmetry to trigger directed cell migration. Nat Cell Biol. 2010;12:628–632. doi: 10.1038/ncb0710-628. [DOI] [PubMed] [Google Scholar]
- Distel M, Hocking JC, Volkmann K, Köster RW. The centrosome neither persistently leads migration nor determines the site of axonogenesis in migrating neurons in vivo. J Cell Biol. 2010;191:875–890. doi: 10.1083/jcb.201004154. [DOI] [PMC free article] [PubMed] [Google Scholar]
- Doyle AD, Wang FW, Matsumoto K, Yamada KM. One-dimensional topography underlies three-dimensional fibrillar cell migration. J Cell Biol. 2009;184:481–490. doi: 10.1083/jcb.200810041. [DOI] [PMC free article] [PubMed] [Google Scholar]
- Efimov A, Kharitonov A, Efimova N, Loncarek J, Miller PM, Andreyeva N, Gleeson P, Galjart N, Maia ARR, McLeod IX, et al. Asymmetric CLASP-dependent nucleation of noncentrosomal microtubules at the trans-Golgi network. Dev Cell. 2007;12:917–930. doi: 10.1016/j.devcel.2007.04.002. [DOI] [PMC free article] [PubMed] [Google Scholar]
- Etienne-Manneville S. Microtubules in cell migration. Annu Rev Cell Dev Biol. 2013;29:471–499. doi: 10.1146/annurev-cellbio-101011-155711. [DOI] [PubMed] [Google Scholar]
- Euteneuer U, Schliwa M. Persistent, directional motility of cells and cytoplasmic fragments in the absence of microtubules. Nature. 1984;310:58–61. doi: 10.1038/310058a0. [DOI] [PubMed] [Google Scholar]
- Gomes ER, Jani S, Gundersen GG. Nuclear movement regulated by Cdc42, MRCK, myosin, and actin flow establishes MTOC polarization in migrating cells. Cell. 2005;121:451–463. doi: 10.1016/j.cell.2005.02.022. [DOI] [PubMed] [Google Scholar]
- Guo W-H, Wang Y-L. Micropatterning cell-substrate adhesions using linear polyacrylamide as the blocking agent. Cold Spring Harb Protoc. 2011;2011:prot5582. doi: 10.1101/pdb.prot5582. [DOI] [PubMed] [Google Scholar]
- Guo W-H, Wang Y-L. A three-component mechanism for fibroblast migration with a contractile cell body that couples a myosin II-independent propulsive anterior to a myosin II-dependent resistive tail. Mol Biol Cell. 2012;23:1657–1663. doi: 10.1091/mbc.E11-06-0556. [DOI] [PMC free article] [PubMed] [Google Scholar]
- Hinchcliffe EH, Miller FJ, Cham M, Khodjakov A, Sluder G. Requirement of a centrosomal activity for cell cycle progression through G1 into S phase. Science. 2001;291:1547–1550. doi: 10.1126/science.1056866. [DOI] [PubMed] [Google Scholar]
- Huang AJ, Silverstein SC, Malawista SE. Cryopreserved cytoplasts from human neutrophils migrate across monolayers of human endothelial cells in response to a chemoattractant gradient. J Leukoc Biol. 1991;50:624–627. doi: 10.1002/jlb.50.6.624. [DOI] [PubMed] [Google Scholar]
- Karsenti E, Kobayashi S, Mitchison T, Kirschner M. Role of the centrosome in organizing the interphase microtubule array: properties of cytoplasts containing or lacking centrosomes. J Cell Biol. 1984;98:1763–1776. doi: 10.1083/jcb.98.5.1763. [DOI] [PMC free article] [PubMed] [Google Scholar]
- Kim HN, Hong Y, Kim MS, Kim SM, Suh K-Y. Effect of orientation and density of nanotopography in dermal wound healing. Biomaterials. 2012;33:8782–8792. doi: 10.1016/j.biomaterials.2012.08.038. [DOI] [PubMed] [Google Scholar]
- Kupfer A, Louvard D, Singer SJ. Polarization of the Golgi apparatus and the microtubule-organizing center in cultured fibroblasts at the edge of an experimental wound. Proc Natl Acad Sci USA. 1982;79:2603–2607. doi: 10.1073/pnas.79.8.2603. [DOI] [PMC free article] [PubMed] [Google Scholar]
- Levchenko A, Iglesias PA. Models of eukaryotic gradient sensing: application to chemotaxis of amoebae and neutrophils. Biophys J. 2002;82:50–63. doi: 10.1016/S0006-3495(02)75373-3. [DOI] [PMC free article] [PubMed] [Google Scholar]
- Luxton GG, Gundersen GG. Orientation and function of the nuclear–centrosomal axis during cell migration. Curr Opin Cell Biol. 2011;23:579–588. doi: 10.1016/j.ceb.2011.08.001. [DOI] [PMC free article] [PubMed] [Google Scholar]
- Ma L, Janetopoulos C, Yang L, Devreotes PN, Iglesias PA. Two complementary, local excitation, global inhibition mechanisms acting in parallel can explain the chemoattractant-induced regulation of PI(3,4,5)P3 response in dictyostelium cells. Biophys J. 2004;87:3764–3774. doi: 10.1529/biophysj.104.045484. [DOI] [PMC free article] [PubMed] [Google Scholar]
- Maiuri P, Rupprecht J-F, Wieser S, Ruprecht V, Bénichou O, Carpi N, Coppey M, De Beco S, Gov N, Heisenberg C-P, et al. Actin flows mediate a universal coupling between cell speed and cell persistence. Cell. 2015;161:374–386. doi: 10.1016/j.cell.2015.01.056. [DOI] [PubMed] [Google Scholar]
- Nnetu KD, Knorr M, Strehle D, Zink M, Käs JA. Directed persistent motion maintains sheet integrity during multi-cellular spreading and migration. Soft Matter. 2012;8:6913. [Google Scholar]
- Parent CA, Devreotes PN. A cell’s sense of direction. Science. 1999;284:765–770. doi: 10.1126/science.284.5415.765. [DOI] [PubMed] [Google Scholar]
- Pouthas F, Girard P, Lecaudey V, Ly TBN, Gilmour D, Boulin C, Pepperkok R, Reynaud EG. In migrating cells, the Golgi complex and the position of the centrosome depend on geometrical constraints of the substratum. J Cell Sci. 2008;121:2406–2414. doi: 10.1242/jcs.026849. [DOI] [PubMed] [Google Scholar]
- Prescott DM, Kirkpatrick JB. Mass enucleation of cultured animal cells. Methods Cell Biol. 1974;7:189–202. doi: 10.1016/s0091-679x(08)61777-x. [DOI] [PubMed] [Google Scholar]
- Prescott DM, Myerson D, Wallace J. Enucleation of mammalian cells with cytochalasin B. Exp Cell Res. 1972;71:480–485. doi: 10.1016/0014-4827(72)90322-9. [DOI] [PubMed] [Google Scholar]
- Prigozhina NL, Waterman-Storer CM. Protein kinase D-mediated anterograde membrane trafficking is required for fibroblast motility. Curr Biol. 2004;14:88–98. doi: 10.1016/j.cub.2004.01.003. [DOI] [PubMed] [Google Scholar]
- Rodionov V, Nadezhdina E, Borisy G. Centrosomal control of microtubule dynamics. Proc Natl Acad Sci USA. 1999;96:115–120. doi: 10.1073/pnas.96.1.115. [DOI] [PMC free article] [PubMed] [Google Scholar]
- Sameshima M, Imai Y, Hashimoto Y. The position of the microtubule-organizing center relative to the nucleus is independent of the direction of cell migration in dictyostelium discoideum. Cell Motil Cytoskel. 1988;9:111–116. doi: 10.1002/cm.970090203. [DOI] [PubMed] [Google Scholar]
- Satulovsky J, Lui R, Wang Y-L. Exploring the control circuit of cell migration by mathematical modeling. Biophys J. 2008;94:3671–3683. doi: 10.1529/biophysj.107.117002. [DOI] [PMC free article] [PubMed] [Google Scholar]
- Sheetz MP, Felsenfeld D, Galbraith CG, Choquet D. Cell migration as a five-step cycle. Biochem Soc Symp. 1999;65:233–243. [PubMed] [Google Scholar]
- Sutterlin C, Colanzi A. The Golgi and the centrosome: building a functional partnership. J Cell Biol. 2010;188:621–628. doi: 10.1083/jcb.200910001. [DOI] [PMC free article] [PubMed] [Google Scholar]
- Tanaka T, Serneo FF, Higgins C, Gambello MJ, Wynshaw-Boris A, Gleeson JG. Lis1 and doublecortin function with dynein to mediate coupling of the nucleus to the centrosome in neuronal migration. J Cell Biol. 2004;165:709–721. doi: 10.1083/jcb.200309025. [DOI] [PMC free article] [PubMed] [Google Scholar]
- Ueda M, Gräf R, MacWilliams HK, Schliwa M, Euteneuer U. Centrosome positioning and directionality of cell movements. Proc Natl Acad Sci USA. 1997;94:9674–9678. doi: 10.1073/pnas.94.18.9674. [DOI] [PMC free article] [PubMed] [Google Scholar]
- Verkhovsky AB, Svitkina TM, Borisy GG. Self-polarization and directional motility of cytoplasm. Curr Biol. 1999;9:11–20. doi: 10.1016/s0960-9822(99)80042-6. [DOI] [PubMed] [Google Scholar]
- Wakida NM, Botvinick EL, Lin J, Berns MW. An intact centrosome is required for the maintenance of polarization during directional cell migration. PLoS One. 2010;5:e15462. doi: 10.1371/journal.pone.0015462. [DOI] [PMC free article] [PubMed] [Google Scholar]
- Yvon A-MC, Walker JW, Danowski B, Fagerstrom C, Khodjakov A, Wadsworth P. Centrosome reorientation in wound-edge cells is cell type specific. Mol Biol Cell. 2002;13:1871–1880. doi: 10.1091/mbc.01-11-0539. [DOI] [PMC free article] [PubMed] [Google Scholar]
- Zhang J, Guo W-H, Wang Y-L. Microtubules stabilize cell polarity by localizing rear signals. Proc Natl Acad Sci USA. 2014;111:16383–16388. doi: 10.1073/pnas.1410533111. [DOI] [PMC free article] [PubMed] [Google Scholar]
- Zhu J, Burakov A, Rodionov V, Mogilner A. Finding the cell center by a balance of dynein and myosin pulling and microtubule pushing: a computational study. Mol Biol Cell. 2010;21:4418–4427. doi: 10.1091/mbc.E10-07-0627. [DOI] [PMC free article] [PubMed] [Google Scholar]
Associated Data
This section collects any data citations, data availability statements, or supplementary materials included in this article.