

The roles of individual core promoter elements in transcriptional dynamics of MHC class I gene expression were determined by smFISH in primary B-cells. The elements individually modulated transcriptional bursting, differentially contributing to burst size or burst frequency, to enable combinatorial fine-tuning of the level of transcription.
Abstract
Eukaryotic transcription occurs in bursts that vary in size and frequency, but the contribution of individual core promoter elements to transcriptional bursting is not known. Here we analyze the relative contributions to bursting of the individual core promoter elements—CCAAT, TATAA-like, Sp1BS, and Inr—of an MHC class I gene in primary B-cells during both basal and activated transcription. The TATAA-like, Sp1BS, and Inr elements all function as negative regulators of transcription, and each was found to contribute differentially to the overall bursting pattern of the promoter during basal transcription. Whereas the Sp1BS element regulates burst size, the Inr element regulates burst frequency. The TATAA-like element contributes to both. Surprisingly, each element has a distinct role in bursting during transcriptional activation by γ-interferon. The CCAAT element does not contribute significantly to the constitutive transcriptional dynamics of primary B-cells, but modulates both burst size and frequency in response to γ-interferon activation. The ability of core promoter elements to modulate transcriptional bursting individually allows combinatorial fine-tuning of the level of MHC class I gene expression in response to intrinsic and extrinsic signals.
INTRODUCTION
Transcription of eukaryotic genes is a highly complex and ordered process governed by a combination of trans-factors binding to distal cis-DNA sequence elements and general transcription factors (GTFs) assembling at the proximal core promoter. The stepwise assembly of a transcription preinitiation complex consisting of several GTFs, a mediator, and Pol II occurs stochastically. Once a transcription preinitiation complex (PIC) is fully assembled, multiple transcription reinitiation events lead to the rapid escape of a series of RNA Pol II polymerases, resulting in bursts of transcription (Blake et al., 2003). The number of transcripts generated during a burst varies according to its duration (Golding et al., 2005). The stochastic nature of transcription results in a heterogeneity of expression among cells in a population (Singh et al., 2010). To characterize this quantal behavior of transcription in eukaryotic cells, several single-cell techniques have been developed, including single-molecule fluorescence in situ hybridization (smFISH), FRET, and live cell imaging (Chen and Larson, 2016). These techniques have shown that bursting dynamics is highly varied among genes, with burst sizes ranging from two transcripts to hundreds, and periods of inactivity between bursts ranging from minutes to hours (Suter et al., 2011a, b; Dar et al., 2012; Chen and Larson, 2016). Both burst size and frequency can vary among genes and within a single gene under different conditions, leading to modulated gene expression (Larson et al., 2013; Bartman et al., 2016; Fukaya et al., 2016).
Although the role of upstream enhancer elements in establishing bursting dynamics has been examined, the role of core promoter elements, with the exception of the TATAA box (Blake et al., 2006; Hornung et al., 2012; Ravarani et al., 2016; Tantale et al., 2016), has not. The core promoter encompasses the transcription start site and is defined as the 50–100 base pair region within which transcription initiates (Sandelin et al., 2007; Roy and Singer, 2015). Canonical core promoter elements, such as the TATAA box and Initiator (Inr), are commonly found in promoters, although many promoters have no identifiable core promoter elements. The composition of core promoters (Larson et al., 2013) is loosely correlated with the type of genes they regulate: tissue-specific genes are enriched for TATAA box and Inr elements, whereas promoters of housekeeping genes often contain Inr, TCT, DPE, DCE, or other motifs (Zabidi et al., 2015).
Recent evidence demonstrates that the core promoter is not, as previously thought, a passive platform upon which regulation is imposed by mediator and transcription factors. Rather, it actively contributes to the regulation of gene expression. In the case of major histocompatibility complex (MHC) class I genes, individual core promoter elements contribute to the overall regulation of transcription (Barbash et al., 2013). MHC class I genes encode cell surface receptors that present intracellularly-derived peptides, eliciting cellular immunity against intracellular pathogens. Consistent with this role of providing immune surveillance, MHC class I genes are ubiquitously expressed, although their levels of RNA vary dramatically among tissues. Expression is constitutively highest in lymphoid cells, such as B-cells, and lower to varying degrees in other tissues. Expression is dynamically modulated by hormones and cytokines, which decrease and increase levels, respectively. Thus MHC class I transcription is subject to both intracellular, tissue-specific and extracellular, hormone/cytokine regulatory pathways that converge on, and are integrated at, the core promoter.
These complex patterns of MHC class I gene expression make it an ideal model system in which to study the molecular mechanisms of transcriptional regulation. We have shown previously that expression of a transgene derived from the porcine MHC class I gene, PD1, is indistinguishable both from its endogenous pattern of expression and from the endogenous mouse MHC class I genes (Frels et al., 1985). The PD1 transgene contains all of the regulatory elements required for normal tissue-specific and hormone/cytokine-mediated patterns of expression (Ehrlich et al., 1989). The core promoter of the PD1 gene extends from –68 to +14 base pairs and consists of 1) a TATAA-like element, 2) an Inr, 3) a CCAAT box and 4) an Sp1 binding site (Sp1BS) and actively contributes to the regulation of transcription of the PD1 transgene. Surprisingly, mutation of any one of these elements results in increased transcription (without altering transcription start site usage), defining these as negative regulators of transcription that differentially regulate either tissue specific expression, interferon response, or both (Barbash et al., 2013). Thus the individual core promoter elements actively participate in the integration of both tissue-specific and hormonal upstream regulatory signals to achieve appropriate levels of transcription (Barbash et al., 2013).
The finding that the individual core promoter elements have distinct effects on the regulation of MHC class I transcription led to the question of their role(s) in transcriptional bursting. Here we report that transcription of the MHC class I gene PD1 occurs in bursts and that the individual core promoter elements contribute differentially to establishing the overall bursting pattern in a context-dependent manner. In primary splenic B-cells during basal transcription, burst size is modulated primarily by the Sp1BS, while the Inr establishes burst frequency. The TATAA-like element governs both burst size and frequency. Their individual contributions change in response to transcriptional activation by the cytokine γ-interferon. This plasticity in regulating the bursting of MHC class I transcription enables rapid fine-tuning of transcription levels to respond to intrinsic and extrinsic signaling events, such as viral infections.
RESULTS
MHC class I transcription is stochastic and occurs in bursts in primary B-cells
Transcription of MHC class I genes is regulated by both intrinsic, tissue-specific mechanisms and extrinsic, hormonal/cytokine signaling pathways, which are integrated at the core promoter (Howcroft et al., 2003). Each of the elements within the core promoter actively contributes to regulating transcription, and each has a distinct activity. Strikingly, mutation of any one of the core promoter elements (Figure 1A) within the context of a PD1 transgene resulted in increased transcription in ensemble analyses of tissues (Barbash et al., 2013). Further, each of the core promoter elements of the MHC class I gene PD1 differentially regulates not only absolute promoter activity, but also tissue-specific and hormone/cytokine-modulated patterns of expression (Barbash et al., 2013). The effects of core promoter mutations are independent of insertion site or copy number. Because eukaryotic transcription is known to be stochastic and occur in bursts, we asked whether the differential regulation of expression by individual core promoter elements reflects their control of either burst frequency or burst size. To address this question, we assessed the transcriptional bursting of the PD1 transgene and its core promoter element mutants in primary splenic B-cells by single-molecule RNA FISH (smFISH).
FIGURE 1:

Single mRNA transcripts detected by FISH in primary B-lymphocytes. (A) Sequence of the PD1 proximal promoter. Promoter elements are boxed and the mutations in each element indicated in red. (B) Detection and counting of single PD1-Cy3-labeled and CD19-Cy5-labeled mRNA transcripts in primary B-cells stimulated ex vivo. Left panel: Maximum-intensity projection of smFISH staining of B-cells; red and green spots indicate single PD1 and CD19 mRNAs, respectively. White arrow indicates CD19 transcription site with multiple nascent mRNAs. Right panel: Green squares identify individual mRNA molecules and circles identify transcription sites. (C) PD1/CD19 smFISH in a transgene-nonexpressing mouse. (D) smFISH with anti PD1-Cy3 and H2Kb-Cy5 probes in primary B-cells show nonoverlapping detection of endogenous and transgenic MHC class I mRNA. (E) Colocalization of smFISH spots for CD19 with two probe sets targeted to the 5′ and 3′ regions of the mRNA. (F) CD19 smFISH in B-cell stimulated culture. Image shows a CD19-expressing lymphocyte and a CD19-negative lymphocyte. (G) Bimodal distribution of CD19 transcripts indicates non–B-cells remaining in the population after stimulation. Black line indicates threshold for CD19 positive B-cells gated for downstream analysis. Scale bars represent 5 µm.
We first established conditions for the detection of MHC class I transcripts in primary murine B-cells by smFISH. Preliminary experiments established that lymphocytes harvested directly from mouse spleen were not amenable to smFISH because of their small cell volume (unpublished data). However, culturing of splenocytes in B-cell–stimulating conditions (LPS, IL4, anti-CD130) resulted in both enrichment of the B-cell population and increased B-cell volume, which enabled detection of individual transcripts using automated image analysis in ∼1000 cells (Figure 1B). Sets of fluorescent DNA probes were designed that distinguish transgenic PD1 transcripts from the homologous endogenous MHC(H-2) class I coding regions. Despite the high homology between the PD1 and the endogenous H-2 class I sequences (i.e., H-2Kb), we successfully generated an oligo set of 23 probes uniquely complementary to transgenic PD1 transcripts. The specificity of the PD1 probe set was assessed in two ways. First, the fluorescently labeled PD1 probe set was hybridized with splenic B-cells derived from a transgenic mouse that did not express the transgene; no hybridization of the PD1 probe set was observed in either the cytoplasm or nucleus (Figure 1C). Second, differentially fluorescently labeled DNA oligos that target either the PD1 or H-2Kb coding regions were generated. smFISH imaging revealed that the two probe sets identified nonoverlapping populations of RNA, demonstrating the specificity of the probe sets for their targets (Figure 1D). To restrict our analysis of PD1 transcription to B-cells, the smFISH included, in addition to the fluorescently labeled PD1 oligo probes, fluorescently labeled probes that target the B-cell–specific CD19 transcript (Figure 1E). To assess the efficiency of detection, two probe sets, with different fluorescent labels, were generated that targeted either the 5′ or the 3′ segment of the CD19 transcript. The two sets of probes were almost entirely colocalized, indicating good efficiency of detection (Figure 1E). Importantly, CD19 smFISH could distinguish CD19-expressing lymphocytes from CD19 nonexpressing lymphocytes (Figure 1F). Binning cells by CD19 expression revealed that only a small population of cells that was CD19-negative or very low remained after culture. All subsequent analyses of class I transcription mechanisms were limited to the CD19+ population of B-cells (Figure 1G).
The PD1 core promoter negatively regulates transcript distribution
B-cells from the mouse with the wild-type (WT) PD1 transgene, as well as B-cells from each of the core promoter mutant transgenic mice, were analyzed by smFISH (Figure 2A). The number of PD1 transcripts/cell in at least 1000 CD19+ transgenic B-cells from independent biological replicates of each of the PD1 promoter mutants was counted and a normalized distribution of transcripts was generated (Figure 2B).
FIGURE 2:

Core promoter mutations alter PD1 mRNA distribution and nascent transcript dynamics. (A) Representative smFISH images of B-lymphocytes probed with Cy3-labeled PD1 oligonucleotides, derived from either the WT or the indicated PD1 core promoter element mutation. (B) Binned and normalized PD1 mRNA distributions of the WT transgene in B-cells (blue, top panel; gray, remaining panels), and of the core promoter mutant transgenes (red).
In B-cells from mice with the WT PD1 promoter, the average number of PD1 RNA molecules per cell was determined to be 32 ± 3 (Figure 2 and Table 1). Previous studies demonstrated that mutating any one of the core promoter elements—TATAA-like, Inr, Sp1BS or CCAAT box—resulted in expression of the PD1 gene in the spleen at levels equal to or greater than the WT (Barbash et al., 2013). These patterns of expression were intrinsic to the core promoter, as they were reproducible in multiple, independent founder lines with different integration sites. To further characterize the role of the core promoter elements in transcription, the levels and distribution of mRNA/cell of each mutant were determined at the single–B-cell level (Figure 2A). We found that mutation of the Sp1BS, Inr, or TATAA-like elements each resulted in increased transcription in single B-cells, relative to the WT (Figure 2B and Table 1). Thus each of these elements independently functions as a negative regulator of transcription in single cells. Whereas the WT PD1 gene encoded an average of 32 ± 3 PD1 mRNA per cell, expression of the Inr and Sp1BS mutants was about twofold greater than for the WT, increasing to 72 ± 2 and 72 ± 5 transcripts/cell, respectively (Figure 2B and Table 1). These increases, quantified at the single-cell level, parallel those observed in whole spleen tissue. The number of transcripts directed by the TATAA mutant increased to 55 ± 4 mRNA/cell relative to WT. The 1.7-fold increase in the TATAA mutant measured by smFISH was markedly less than the 12-fold change observed in whole spleen tissue. The basis for the difference is not known, but may reflect cell-type specific effects of the TATAA-like mutant in the spleen, compared with purified, activated B-cells. The CAAT mutant, whose expression is similar to that of WT in spleen, also expressed at a level comparable to WT in single B-cells, namely 36 ± 5 RNA/cell (Figure 2B and Table 1).
TABLE 1:
Core promoter mutations alter both mRNA/cell and Fano factor.
| +γIFN | ||||||
|---|---|---|---|---|---|---|
| Mean mRNA/cell | SEM | Fano factor | Mean mRNA/cell | SEM | Fano factor | |
| WT | 32 | 3 | 5.7 | 67 | 4 | 11.3 |
| Inr | 72 | 2 | 6.9 | 83 | 5 | 5.6 |
| Sp1BS | 72 | 5 | 10.9 | 59 | 5 | 12.7 |
| TATAA-like | 55 | 4 | 10.2 | 56 | 1 | 11.3 |
| CAAT | 36 | 5 | 6.4 | 56 | 3 | 8.1 |
The increases in mRNA/cell observed with the core promoter element mutants were accompanied by an increased variability in the number of mRNA/cell (Figure 2B). The normalized mRNA/cell variance (Figure 3) provides an indication of the dispersion in the population (Fano factor). The Fano factor (variance/mean) of a Poisson distribution is 1, which would be observed for nonbursting transcription. The Fano factor for expression of the WT PD1 transgene was 5.7, indicating super-Poisson variation and transcriptional bursting (Table 1). The Fano factors of the Inr and CCAAT mutants were comparable to those of the WT. In contrast, the Sp1BS and TATAA mutants had considerably higher Fano factors of 10.9 and 10.2, respectively, indicating that these mutations caused greater variation in PD1 transcription than in the WT or either of the other two mutations (Table 1). Thus transcription of the WT PD1 and all of its core promoter mutants displays bursting, although the patterns differ.
FIGURE 3:
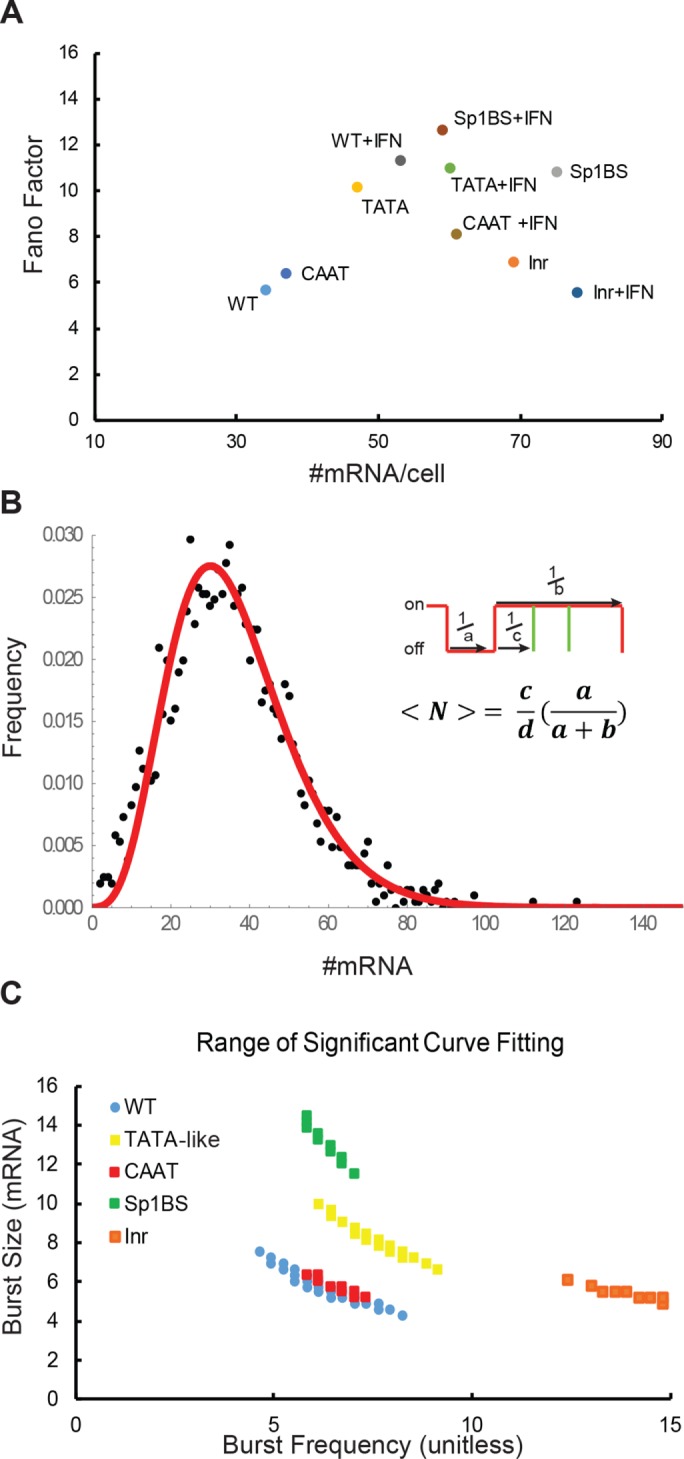
Bursting dynamics of PD1 core promoter mutants. (A) Fano factor vs. mean mRNA/cell of PD1 core promoter element mutants in B-lymphocytes stimulated in the absence or presence of γ-interferon. (B) A best fit curve generated from the two-state bursting telegraph model to a PD1 mRNA distribution. The two-state model can be represented as combined rates of a, a gene turning on; b, a gene turning off; and c, the rate of transcript firing with a burst. (C) Burst parameters that that satisfy the χ2 null hypothesis test (p > 0.1) for the WT distribution and for the core promoter mutants. Nonoverlapping distributions indicate samples with significantly different bursting kinetics. Burst size is mRNA/cell; burst frequency is unitless.
The differences in Fano factors are not simply a reflection of difference in levels of expression, because there was no correlation between mean expression levels and Fano factors among the different PD1 core promoter mutants (Figure 3A). Thus the Fano factor is neither gene-independent nor primarily a function of gene expression level. Rather, the differences in variability among the PD1 promoters are intrinsic to promoter architecture.
PD1 core promoter elements differentially regulate transcriptional bursting
The fact that the Fano factors of all the smFISH data sets were greater than 1 indicated that PD1 transcription occurs in bursts. Although multiple theoretical descriptions of transcriptional bursting have been described (Lenstra et al., 2016) our data could be adequately described by a two-state model also known as the “Random Telegraph Model” (Peccoud and Ycart, 1995). Thus the underlying transcriptional dynamics that produce the PD1 mRNA distributions can be inferred from this two-state model of transcription with variable parameters for burst size and burst frequency; rates of RNA degradation are assumed to be constant (Figure 3B; Materials and Methods). This model can also be solved analytically (Raj et al., 2006). In the two-state Telegraph model, “a/d” is defined as the rate of a gene turning on (burst frequency), “b/d” is the rate of the gene turning off (inverse of the burst duration), “c/b” is the burst size (number of transcripts per burst), and “c/d” is the frequency of firing within a burst. Because the degradation rate “d” is assumed to be constant, it is not included in the calculation. From the distribution of the number of mRNA molecules/cell (<N>), it is possible to infer both burst size (c/b) and frequency (a) (Figure 3B). Thus we can apply the two-state model as a theoretical framework within which we can compare the functions of the individual core promoter elements.
To fully characterize the parameter space that fits our data, we used the χ2 (chi-squared) estimator to identify the ranges of burst size and burst frequency values that fit a given mRNA distribution. The range of bursting parameters was determined by systematically varying both burst size and burst frequency between 0 and 20 with a step size of 0.2 and computing the reduced χ2. Samples with nonoverlapping ranges have significantly different bursting dynamics. Using the Telegraph model to infer burst parameters, we calculated that the WT PD1 gene displayed a median burst frequency of 6.2 ± 2 and burst size of 6 ± 2 (Figure 3C and Table 2). Strikingly, mutations in the Sp1BS element, which resulted in increased concentrations of mRNA/cell, did so by significantly increasing the median burst size to 12 ± 1.4, without an observable difference in the burst frequency (Figure 3C and Table 2). Conversely, the Inr mutant showed a change in median burst frequency to 13.9 ± 1.5, with a modestly reduced burst size. The TATAA box mutation increased expression through both increased median burst size and burst frequency. The transcriptional parameters of the CAAT mutant showed no significant change in bursting parameters from the WT, consistent with its similar transcript distribution profile. Thus mutations of the Inr and Sp1BS elements increase overall transcription, but by distinct mechanisms. Taken together, these observations demonstrate that in B-cells, the core promoter elements contribute in distinct ways to the overall transcriptional dynamics of the promoter. The differential changes in bursting dynamics seen in the core promoter mutants suggest that they act combinatorially to direct appropriate transcriptional output, consistent with their previously described unique roles in determining tissue specificity and expression level (Barbash et al., 2013).
TABLE 2:
Core promoter mutations differentially affect burst size and burst frequency.
| +γIFN | ||||||||
|---|---|---|---|---|---|---|---|---|
| Burst frequency | ± | Burst size | ± | Burst frequency | ± | Burst size | ± | |
| WT | 6.2 | 1.9 | 6 | 1.8 | 5.5 | 1.1 | 12.4 | 1.9 |
| Inr | 13.9 | 1.5 | 5.5 | 0.6 | 13.8 | 1.8 | 6.7 | 0.6 |
| Sp1BS | 6.4 | 1 | 12.4 | 1.4 | 4.6 | 0.3 | 13.9 | 0.7 |
| TATAA-like | 7.4 | 1.5 | 8.2 | 1.8 | 4.4 | 0.5 | 13.6 | 0.9 |
| CAAT | 5.8 | 1.3 | 6.3 | 1.1 | 7.7 | 0.8 | 8 | 1.1 |
γ-Interferon differentially modulates transcriptional bursting of PD1 core promoter elements
γ-Interferon transcriptionally activates PD1 transcription; mutations in the PD1 core promoter differentially affect this response (Barbash et al., 2013). Because the core promoter elements differentially regulate the bursting parameters of constitutive transcription, we next asked how those parameters would change in response to transcriptional activation by γ-interferon. Primary splenic B-cells were stimulated ex vivo as above, but in either the presence or absence of γ-interferon; the transcript distribution was assessed by smFISH. B-cells from the WT PD1 transgenic mouse responded to γ-interferon stimulation with a 2.1-fold increase in PD1 transcripts, increasing from a constitutive level of 32 ± 3 mRNA per cell to 67 ± 4 mRNA per cell (Figure 4, A and B, and Table 1). This magnitude of response to γ-interferon parallels that observed for PD1 in whole spleen, as measured by either Northern or real time-PCR (Barbash et al., 2013). γ-Interferon treatment also increased expression of both the Inr and CAAT mutants, although the magnitude of the change was less than that of the WT response (Figure 4, A and B, and Table 1). Surprisingly, the TATAA-like mutant showed no overall change in PD1 expression in response to γ-interferon. Strikingly, mutation of the Sp1BS element resulted in a decrease in PD1 mRNA levels from 72 ± 5 PD1 mRNA/cell to 59 ± 5 mRNA/cell in response to γ-interferon (Figure 4, A and B, and Table 1). Thus both the TATAA-like element and the Sp1BS element play critical roles in γ-interferon–mediated induction of class I transcription in primary B-cells (Figure 4, B and C).
FIGURE 4:

γ-Interferon treatment differentially affects PD1 transcription in core promoter mutants. (A) Normalized histograms of PD1 RNA expression in B-lymphocytes from WT and core promoter mutant lines stimulated in the absence or presence of γ-interferon. Gray, no γ-interferon; red, + γ-interferon. (B) Expression of core promoter mutants relative to WT in the presence or absence of γ-interferon, as determined from mean expression levels in A. (C) Differential bursting kinetics upon γ-interferon treatment in WT and mutant PD1 genes. Triangles indicate γ-interferon–treated samples in respective panels.
The diversity of response of the core promoter mutants to γ-interferon is reflected in their different contributions to transcriptional bursting upon activation (Figure 4C and Tables 1 and 2). The increased expression of WT PD1 following γ-interferon treatment was achieved through increasing the median burst size from 6 to 12, consistent with the observed increase in the Fano factor, without markedly altering burst frequency. Similarly, γ-interferon induction of the Inr promoter mutant increased burst size, although modestly, and had no effect on burst frequency. Both median transcriptional burst size and frequency of the CCAAT mutant increased following γ-interferon treatment. The response of the TATAA-like mutant to γ-interferon was different yet again: the burst size increased while the burst frequency decreased, which together resulted in higher noise but almost no net change in mRNA/cell. The surprising repression of transcription by γ-interferon of the Sp1BS mutant promoter resulted from a decrease in burst frequency, not burst size. As expected, observed changes in the Fano factor correlated with changes in the calculated burst size (Thattai and van Oudenaarden, 2001). Taken together, these findings demonstrate that activation of transcription of the WT promoter by γ-interferon is mediated through combinatorial changes in both burst size and frequency, governed by the core promoter elements. Importantly, these changes are unrelated to those caused by the promoter mutations during constitutive expression. For example, although the Sp1BS mutation affects burst size during constitutive transcription, it affects burst frequency of the γ-interferon response; the Inr mutation has just the opposite effect. We conclude that the different core promoter elements differentially regulate both basal and activated transcriptional dynamics. Moreover, the mechanism of the γ-interferon response is not solely dependent on the upstream signaling factors but is also dependent on the core promoter of PD1.
MHC class I genes display distinct tissue-specific transcriptional dynamics
The finding that γ-interferon induction of class I transcription differentially affected burst size and frequency led us to ask whether tissue-specific transcription was similarly regulated by differential effects on the dynamics. To that end, we analyzed the expression of the endogenous mouse H-2Kb gene in activated primary splenic B-cells and T-cells (Figure 5A), allowing us to examine the transcriptional bursting of another endogenous MHC class I gene. As measured by smFISH, the median mRNA/cell was 51 in B-cells and 62 in T-cells (Table 3). The distributions of H2-Kb mRNA in both B- and T-cells were super-Poisson, with Fano factors of 6.8 and 7.6, respectively. Analysis of the H-2Kb distribution, as done for the PD1 distributions, revealed that the higher concentration of RNA in T-cells reflected modest increases in both burst size and frequency relative to B-cells (Figure 5, B and C). We conclude that differences in tissue-specific levels of expression of MHC class I genes are achieved by modulating both burst size and frequency.
FIGURE 5:
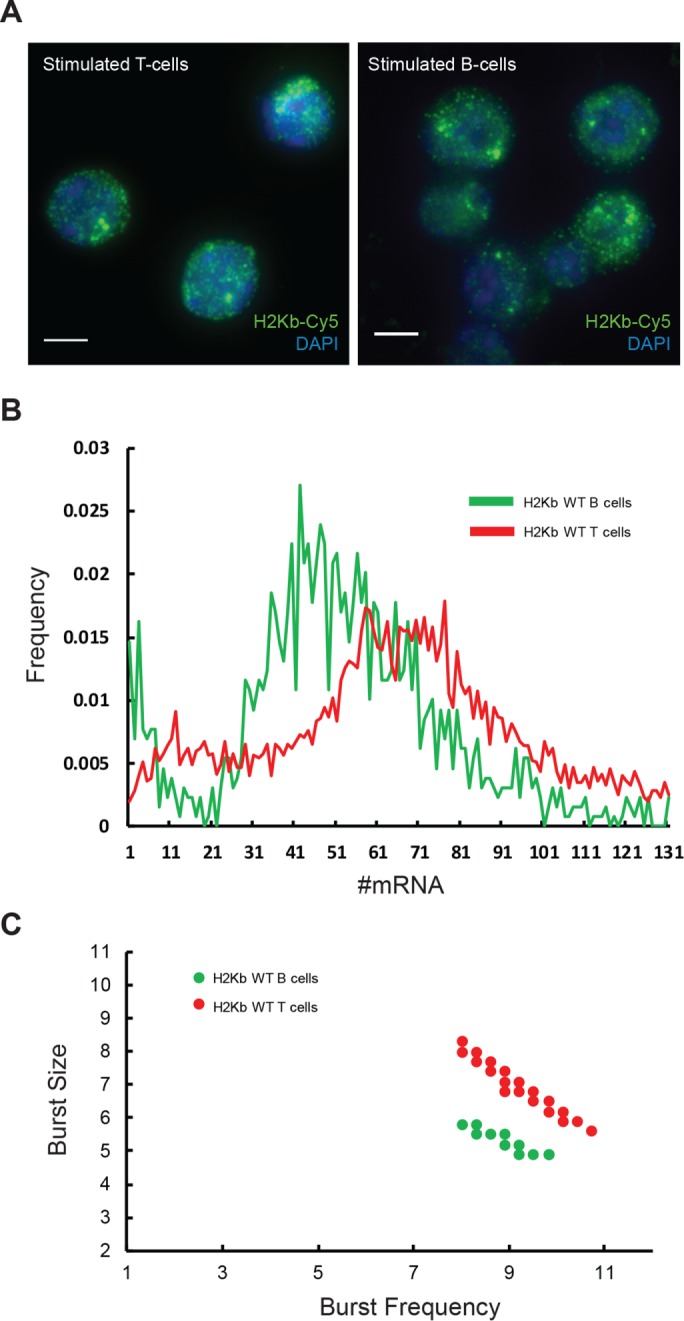
Tissue-specific expression dynamics of H2Kb. (A) smFISH of H2Kb RNA in primary T- (left) and B-lymphocytes (right). (B) Pooled and normalized H2Kb mRNA distributions in primary T- and B-lymphocytes. (C) The differential bursting dynamics of the two distributions.
TABLE 3:
Endogenous MHC class I H-2Kb displays distinct transcription bursting patterns in T-cells and B-cells.
| mRNA/cell | Fano factor | Burst frequency | ± | Burst size | ± | |
|---|---|---|---|---|---|---|
| H-2Kb in B-cells | 51.2 | 6.8 | 8.9 | 0.9 | 5.2 | 0.6 |
| H-2Kb in T-cells | 62.9 | 7.6 | 9.2 | 1.5 | 6.8 | 1.5 |
Nascent transcript analysis of PD1 core promoter mutants
The calculation of the Fano factor and the inference of transcriptional bursting from the two-state model of transcription both derive from the distribution of mRNA/cell. Additional, model-independent information can be derived by calculating the fraction of all sites actively transcribing and the intensity of active transcription sites (TSs) relative to single mRNAs. In B-cells with a WT PD1 promoter, 15% of all alleles were actively transcribing (Figure 6A). Consistent with the increase in the average mRNA/cell in the Inr, Sp1BS, and TATAA mutants (Figure 2 and Table 1), their B-cells also all showed an increased fraction of active TSs (Figure 6A). Surprisingly, the CCAAT mutant also displayed an increased fraction of active TSs of 0.35, significantly higher than the WT, despite the fact that the total number of RNA molecules/cell was comparable. This may reflect underestimation of the burst fractions of both the WT and Inr, where apposed active alleles are observed (unpublished data). These findings overall confirm the increased burst sizes and frequencies derived from the distribution of mRNA/cell (Figure 6C).
FIGURE 6:

Frequency and relative intensity of active transcription sites in PD1 core promoter mutants. (A) Frequency of active PD1 transcription sites over all alleles present in B-lymphocytes from WT and core promoter mutants in the presence and absence of interferon (IFN). Error bars represent the Poisson standard error. (B) Average number of nascent transcripts per PD1 transcription site in the presence and absence of interferon. Number of transcripts per given transcription site calculated by normalizing intensity to the mean intensity of a single mRNA in that field. (C) Comparison of the fraction of the inferred burst frequency with the measured fraction of alleles transcribing, in the absence of interferon. Error bars of the burst frequency represent the χ2 range of solutions. (D) Comparison of the inferred burst size with measured nascent RNA in the absence of interferon. Error bars of the burst size represent the χ2 range of solutions.
In agreement with the relatively modest induction by γ-interferon, we measured only modest changes in the fraction of nuclear TSs upon interferon treatment of either the WT or mutant promoters; these changes were consistent with the changes in bursting determined by the mRNA distributions (Figures 6A and 4C).
An estimate of transcriptional burst size can be made by measuring the fluorescence intensity of a given TS, relative to that of an individual mRNA molecule. To estimate the number of nascent transcripts per TS, we quantified the average fluorescence intensity of active TSs and normalized this to the average intensity of single mRNA spots in the given field of view (Figure 6B). The WT PD1 promoter was estimated to have an average of 4.8 nascent transcripts per TS, a close approximation to the burst size computed from total mRNA (Table 1). All of the core promoter mutants, with the exception of the CCAAT mutant, had more nascent transcripts per TS than WT (Figure 6B), in agreement with the increased mRNA concentration, relative to the WT. Finally, the WT and Inr mutant TS intensity increased upon γ-interferon treatment, in agreement with the modeled response through burst size. The intensities of the Sp1BS, TATAA, and CAAT mutants remained unchanged following γ-interferon treatment.
The measured number of nascent RNAs is broadly consistent with the burst size inferred from fitting the total RNA to the Telegraph model (Figure 6D). However, there are a few notable exceptions. The inferred dynamics of the Inr mutant showed no significant change in burst size relative to the WT (Figure 3C), but we observed an increase in the number of transcripts per TS (Figure 6B). This discrepancy could be explained by increased burst frequency in the case where the elongation time is comparable to the off time. In this case, a burst would reinitiate before mRNAs from the previous burst were released. Conversely, while the inferred dynamics of the Sp1BS mutant showed no significant change in burst frequency relative to WT (Figure 3C), the increased TS frequency (Figure 6, A and C) could result from prolonged periods of transcription necessary to achieve the high burst size. In summary, using two independent measures—total RNA and nascent RNA—we observe that the core promoter controls both burst frequency and size in a stimulation-dependent manner.
DISCUSSION
mRNA levels in a clonal population of eukaryotic cells display considerable cell-to-cell variation, resulting from the stochastic bursting of transcription. The simplest model of transcriptional bursting is a two-state system described by a combination of burst size and burst frequency (Peccoud and Ycart, 1995). Accordingly, the dynamics of transcription of individual genes is achieved by the modulation of burst size and burst frequency, which can vary markedly. In the present study, we have examined the role of the core promoter in establishing transcriptional bursting patterns in an MHC class I gene by individually mutating its core promoter elements. We report that each of the core promoter elements contributes to overall transcriptional bursting by regulating either burst size or burst frequency or both. The transcription dynamics is gene-intrinsic, and the two parameters of burst size and frequency can be controlled independently. Importantly, the core promoter elements play active and distinct roles in establishing transcriptional bursting.
Expression of the MHC class I gene, PD1, is regulated by both basal tissue-specific pathways and dynamic cytokine-activated pathways, which are integrated at the core promoter (Howcroft et al., 2003). The core promoter elements actively contribute to this integration in distinct ways in determining tissue-specific or dynamic levels of promoter activity (Barbash et al., 2013). We now demonstrate that each core promoter element modulates different components of transcriptional bursting. Remarkably, the activities of the core promoter elements differ during basal and activated transcription. Thus, in primary B-cells, SP1BS governs transcriptional burst size under basal, constitutive conditions but burst frequency in response to γ-interferon induction. Conversely, while the Inr regulates burst frequency in the absence of γ-interferon, it contributes to increased burst size in response to γ-interferon induction. The TATAA-like element regulates burst size and frequency under both conditions. Paradoxically, in the presence of γ-interferon, the burst frequency of the mutated TATAA-like element is reduced while the size is increased, so that the overall effect is a modest increase in mean mRNA/cell, but an increase in noise. Finally, the CCAAT element does not contribute to bursting during constitutive transcription. However, in response to γ-interferon activation, the CCAAT box modulates both burst size and frequency. The complex alterations in bursting of the core promoter element mutations in both constitutive and activated transcription indicate that core promoter architecture determines the specific bursting properties and enforces their roles in mediating proper response to signaling events.
This combinatorial regulation of MHC class I transcriptional bursting patterns at the core promoter is also influenced by tissue-specific factors and, presumably, an interplay with upstream regulatory factors. In different cell types, transcriptional bursting of MHC class I is maintained. This finding contrasts markedly with that for ActB, which is transcribed in bursts in the liver, but not in the intestines (Bahar Halpern et al., 2015). A comparison of the transcriptional bursting of an endogenous MHC class I gene, Kb, in B-cells and T-cells revealed distinct patterns in the two cell types. We hypothesize that these differences in tissue-specific bursting are intrinsic to the gene and its promoter architecture, but mediated through trans-acting factors.
A prevailing question in single-cell expression studies is whether stochasticity in transcription is largely governed by the global biophysical constraints of transcription, by gene intrinsic features, or by both (Sanchez and Golding, 2013). Single-cell studies in bacteria and mammalian cells that show a correlation between mean expression and noise have suggested that stochasticity is simply a result of a higher transcriptional load (Fujita et al., 2016). Moreover, recent studies have identified morphological factors that correlate with expression variability (Battich et al., 2015; Padovan-Merhar et al., 2015). In contrast, there was no direct correlation between transcriptional activity and noise among the PD1 core promoter mutants, and no change in cell size or morphology in these primary B-cells. A similar lack of correlation has been reported recently in the analysis of Drosophila promoter variants (Schor et al., 2017). Taken together, we conclude that transcriptional rate and noise are features intrinsic to and specifically modulated by the promoter.
Analyses of transcription dynamics have demonstrated that changes in transcription rate result from changes in either burst frequency or burst size. These changes have been associated with the interaction of upstream enhancers with the downstream promoter. For example, interaction of the β-globin LCR with its promoter markedly increases burst frequency while only modestly affecting burst size (Bartman et al., 2016). Interestingly, during erythropoiesis, both burst size and frequency increase. In a study of the role of core promoter elements in yeast, it was concluded that burst size is governed by the TATAA box of highly expressed genes that lack a nucleosome-free region (NFR); other elements did not contribute (Hornung et al., 2012). However, similarly to the effect of mutating the PD1 TATAA-like element, a detailed mutational analysis of the TATAA box of the yeast GAL1 promoter in another study demonstrated that both burst size and frequency are modulated by the TATAA box sequence (Blake et al., 2006). Indeed, we find that the different core promoter elements of the constitutively expressed PD1 gene, with a nucleosome-free region around the promoter, differentially regulate both burst size and frequency. This difference may reflect the additional complexity of a mammalian promoter subject to multiple regulatory signaling pathways. The detailed dissection of the PD1 core promoter in the present studies provides a new perspective on the mechanisms that establish transcriptional bursting by clearly demonstrating that both burst size and frequency are determined by individual core promoter elements, suggesting that overall transcriptional bursting is combinatorially determined. Thus, not only is transcription dynamics gene intrinsic but the two parameters of burst size and frequency can be independently controlled.
Transcription dynamics is regulated at least in part by cognate transcription factors. Studies by Senecal et al. (2014) demonstrated that induction of c-fos gene expression was dependent on the concentration of transcription factors, which modulated burst frequency. In addition, they found that increasing the affinity of the activating transcription factor for the promoter increased burst size. MHC class I transcription is regulated by both tissue-specific and hormone/cytokine-dependent factors through their interactions with upstream enhancers and silencers, which together interact with the downstream promoter (Ehrlich et al., 1988; Napolitano et al., 2000). Future studies will address those interactions with the core promoter elements and the mechanism(s) by which they modulate burst size and frequency.
The complexity of core promoter element function in MHC class I transcription raises the question of why such complexity is necessary. Class I gene expression is subject to both tissue-specific, intracellular regulatory mechanisms and dynamic extracellular regulatory mechanisms that modulate expression around the tissue-specific set point. Achieving the appropriate levels of class I in any tissue at any time is critical to maintaining effective immune surveillance. Failure to do so is associated with disease: overexpression of MHC class I can trigger autoimmunity, while underexpression is associated with failed immune surveillance and cancer (Singer and Maguire, 1990; Singer et al., 1997). This ability to differentially modulate burst size and frequency makes possible the exquisite fine-tuning of transcription rates that is required to maintain effective immune homeostasis under differing tissue-specific and environmental conditions.
MATERIALS AND METHODS
Mice
C57BL/10 mice homozygous for the PD1 transgene were generated as described previously (Frels et al., 1985). The wild-type (WT) transgene contains a 1 kb regulatory region upstream of the TSS, the entire coding region, and 730 base pairs immediately following the polyadenylation site (Cohen et al., 2009). The promoter mutations were made within the DNA of this transgene (Figure 1A). All studies were carried out in accordance with National Institutes of Health Animal Care and Use Committee Protocol EIB-076.
Lymphocyte culture
Lymphocytes for B-cell culture were harvested from spleens and cultured in RPMI media containing 20% FBS, 0.2 μg/ml IL-4, LPS, and anti–CD-180 for 48 h. γ-Interferon–treated samples were stimulated 24 h postculturing at a concentration of 0.5 U/ml (Peprotech). T-lymphocytes for smFISH were isolated using a pan t-cell isolation kit from MACS and stimulated with anti-CD28 and anti-TCR for 24 h in RPMI.
smFISH
A full set of 41 fluorescent oligonucleotides were designed complementary to the 3′ end of the CD19 and H2Kb mRNA sequence and synthesized by Biosearch. Owing to the high sequence homology between the PD1 transgene and the endogenous H2Kb locus, only 23 probes were designed against the PD1 mRNA.
The protocol was as described by Zenlusen and Singer (2010). Briefly, cells were washed in phosphate-buffered saline (PBS) and adhered to coverslips coated with 70 μg/ml Corning Cell-Tak for 2 h at 37°C. Slips were fixed with 4% paraformaldehyde/PBS for 10 min and permeabalized overnight in 70% EtOH. Coverslips were then treated with 0.1% Triton-X for 10 min an incubated in hybridization buffer for 20 min. Coverslips were then hybridized in a probe dilution of 0.1 ng/μl overnight on parafilm. Following hybridization, coverslips were washed twice for 30 min in hybridization buffer. Coverslips were mounted using DAPI Gold mounting cement.
Image processing and analysis
Wide-field fluorescent Z-stacks of smFISH-labeled cells were taken at intervals of 0.15 μm, and maximum intensity projections were created for all channels. Cell outlines were created using CellProfiler, with Otsu global parameters used to create the DAPI nucleus outline and Otsu Global Propagation used to create the cytoplasm outline based on FISH staining. Spots were counted with the custom IDL program Localize and assigned to cells using a custom IDL program, FiSHAuxiliary (available at larsonlab.net). Cells were binned according to the number of mRNAs they had; each bin was normalized to the total number of cells counted in that experiment.
Transcription site frequency and intensity
Transcription sites were identified using a custom localize program in IDL (available at larsonlab.net) with bandpass thresholds that discriminated against single mRNAs. Transcription site frequency is defined as the fraction of alleles active in a population at a given time. TS intensity was measured using a stringent bandpass threshold with a spot radius of 3.5, followed by a more permissive bandpass threshold that calculated intensity for all mRNAs (spot radius of 1.4). Nascent transcripts per TS were calculated by normalizing the average TS intensities to the average mRNA intensity in a cell.
Two-state model fitting
The data were fitted to the two-state Markovian model of Peccoud and Ycart (Peccoud and Ycart, 1995) as implemented by Raj et al. (2006) for modeling of gene-product synthesis (Protocol S1, Eq. 2) and detailed in Zenklusen et al. (2008).
Briefly, the telegraph model corresponds to the following Markov process:
 |
where I is the inactive state; A is the active state; and N is an mRNA. The rates of the respective processes are a, b, c, and d, the last of which corresponds to the RNA decay rate.
The steady state solution in the limit of b/d >>1 is
 |
where Γ is the Euler gamma function.
Rather than an optimization method being used, the entire space of burst size and frequency between 0 and 20 was sampled with a step size of 0.2. χ2 was computed at each point in two-dimensional parameter space. Parameters that did not achieve a reduced χ2 cutoff for a p > 0.1 null hypothesis were excluded; for 130 data points in the histogram, that value was 147.91.
Acknowledgments
We thank Carson Chow, David Levens, Tom Misteli, Ananda Roy, Ranjan Sen, and Alfred Singer for their critical reading of the manuscript and members of the Singer lab for their help and discussion. We are particularly grateful to Joe Rodriguez for his technical help with the imaging. These studies were supported by the Intramural Research Program of the National Institutes of Health, National Cancer Institute, Center for Cancer Research.
Abbreviations used:
- GTF
general transcription factor
- inr
initiator
- MHC
major histocompatibility complex
- PIC
preinitiation complex
- smFISH
single-molecule RNA fluorescence in situ hybridization
- Sp1BS
Sp1 binding site.
Footnotes
This article was published online ahead of print in MBoC in Press (http://www.molbiolcell.org/cgi/doi/10.1091/mbc.E17-06-0408) on September 20, 2017.
REFERENCES
- Bahar Halpern K, Tanami S, Landen S, Chapal M, Szlak L, Hutzler A, Nizhberg A, Itzkovitz S. Bursty gene expression in the intact mammalian liver. Mol Cell. 2015;58:147–156. doi: 10.1016/j.molcel.2015.01.027. [DOI] [PMC free article] [PubMed] [Google Scholar]
- Barbash ZS, Weissman JD, Campbell JA, Jr, Mu J, Singer DS. Major histocompatibility complex class I core promoter elements are not essential for transcription in vivo. Mol Cell Biol. 2013;33:4395–4407. doi: 10.1128/MCB.00553-13. [DOI] [PMC free article] [PubMed] [Google Scholar]
- Bartman CR, Hsu SC, Hsiung CC, Raj A, Blobel GA. Enhancer regulation of transcriptional bursting parameters revealed by forced chromatin looping. Mol Cell. 2016;62:237–247. doi: 10.1016/j.molcel.2016.03.007. [DOI] [PMC free article] [PubMed] [Google Scholar]
- Battich N, Stoeger T, Pelkmans L. Control of transcript variability in single mammalian cells. Cell. 2015;163:1596–1610. doi: 10.1016/j.cell.2015.11.018. [DOI] [PubMed] [Google Scholar]
- Blake WJ, Balazsi G, Kohanski MA, Isaacs FJ, Murphy KF, Kuang Y, Cantor C, Walt DR, Collins JJ. Phenotypic consequences of promoter-mediated transcriptional noise. Mol Cell. 2006;24:853–865. doi: 10.1016/j.molcel.2006.11.003. [DOI] [PubMed] [Google Scholar]
- Blake WJ, KAErn M, Cantor CR, Collins JJ. Noise in eukaryotic gene expression. Nature. 2003;422:633–637. doi: 10.1038/nature01546. [DOI] [PubMed] [Google Scholar]
- Chen H, Larson DR. What have single-molecule studies taught us about gene expression. Genes Dev. 2016;30:1796–1810. doi: 10.1101/gad.281725.116. [DOI] [PMC free article] [PubMed] [Google Scholar]
- Cohen H, Parekh P, Sercan Z, Kotekar A, Weissman JD, Singer DS. In vivo expression of MHC class I genes depends on the presence of a downstream barrier element. PLoS One. 2009;4:e6748. doi: 10.1371/journal.pone.0006748. [DOI] [PMC free article] [PubMed] [Google Scholar]
- Dar RD, Razooky BS, Singh A, Trimeloni TV, McCollum JM, Cox CD, Simpson ML, Weinberger LS. Transcriptional burst frequency and burst size are equally modulated across the human genome. Proc Natl Acad Sci USA. 2012;109:17454–17459. doi: 10.1073/pnas.1213530109. [DOI] [PMC free article] [PubMed] [Google Scholar]
- Ehrlich R, Maguire JE, Singer DS. Identification of negative and positive regulatory elements associated with a class I major histocompatibility complex gene. Mol Cell Biol. 1988;8:695–703. doi: 10.1128/mcb.8.2.695. [DOI] [PMC free article] [PubMed] [Google Scholar]
- Ehrlich R, Sharrow SO, Maguire JE, Singer DS. Expression of a class I MHC transgene: effects of in vivo alpha/beta-interferon treatment. Immunogenetics. 1989;30:18–26. doi: 10.1007/BF02421465. [DOI] [PubMed] [Google Scholar]
- Frels WI, Bluestone JA, Hodes RJ, Capecchi MR, Singer DS. Expression of a microinjected porcine class I major histocompatibility complex gene in transgenic mice. Science. 1985;228:577–580. doi: 10.1126/science.3885396. [DOI] [PubMed] [Google Scholar]
- Fujita K, Iwaki M, Yanagida T. Transcriptional bursting is intrinsically caused by interplay between RNA polymerases on DNA. Nat Commun. 2016;7:13788. doi: 10.1038/ncomms13788. [DOI] [PMC free article] [PubMed] [Google Scholar]
- Fukaya T, Lim B, Levine M. Enhancer control of transcriptional bursting. Cell. 2016;166:358–368. doi: 10.1016/j.cell.2016.05.025. [DOI] [PMC free article] [PubMed] [Google Scholar]
- Golding I, Paulsson J, Zawilski SM, Cox EC. Real-time kinetics of gene activity in individual bacteria. Cell. 2005;123:1025–1036. doi: 10.1016/j.cell.2005.09.031. [DOI] [PubMed] [Google Scholar]
- Hornung G, Bar-Ziv R, Rosin D, Tokuriki N, Tawfik DS, Oren M, Barkai N. Noise-mean relationship in mutated promoters. Genome Res. 2012;22:2409–2417. doi: 10.1101/gr.139378.112. [DOI] [PMC free article] [PubMed] [Google Scholar]
- Howcroft TK, Raval A, Weissman JD, Gegonne A, Singer DS. Distinct transcriptional pathways regulate basal and activated major histocompatibility complex class I expression. Mol Cell Biol. 2003;23:3377–3391. doi: 10.1128/MCB.23.10.3377-3391.2003. [DOI] [PMC free article] [PubMed] [Google Scholar]
- Larson DR, Fritzsch C, Sun L, Meng X, Lawrence DS, Singer RH. Direct observation of frequency modulated transcription in single cells using light activation. eLife. 2013;2:e00750. doi: 10.7554/eLife.00750. [DOI] [PMC free article] [PubMed] [Google Scholar]
- Lenstra TL, Rodriguez J, Chen H, Larson DR. Transcription dynamics in living cells. Ann Rev Biophys. 2016;45:25–47. doi: 10.1146/annurev-biophys-062215-010838. [DOI] [PMC free article] [PubMed] [Google Scholar]
- Napolitano G, Montani V, Giuliani C, Di Vincenzo S, Bucci I, Todisco V, Laglia G, Coppa A, Singer DS, Nakazato M, et al. Transforming growth factor-beta1 down-regulation of major histocompatibility complex class I in thyrocytes: coordinate regulation of two separate elements by thyroid-specific as well as ubiquitous transcription factors. Mol Endocrinol. 2000;14:486–505. doi: 10.1210/mend.14.4.0454. [DOI] [PubMed] [Google Scholar]
- Padovan-Merhar O, Nair GP, Biaesch AG, Mayer A, Scarfone S, Foley SW, Wu AR, Churchman LS, Singh A, Raj A. Single mammalian cells compensate for differences in cellular volume and DNA copy number through independent global transcriptional mechanisms. Mol Cell. 2015;58:339–352. doi: 10.1016/j.molcel.2015.03.005. [DOI] [PMC free article] [PubMed] [Google Scholar]
- Peccoud J, Ycart B. Markovian modeling of gene-product synthesis. Theor Popul Biol. 1995;48:222–234. [Google Scholar]
- Raj A, Peskin CS, Tranchina D, Vargas DY, Tyagi S. Stochastic mRNA synthesis in mammalian cells. PLoS Biol. 2006;4:e309. doi: 10.1371/journal.pbio.0040309. [DOI] [PMC free article] [PubMed] [Google Scholar]
- Ravarani CN, Chalancon G, Breker M, de Groot NS, Babu MM. Affinity and competition for TBP are molecular determinants of gene expression noise. Nat Commun. 2016;7:10417. doi: 10.1038/ncomms10417. [DOI] [PMC free article] [PubMed] [Google Scholar]
- Roy AL, Singer DS. Core promoters in transcription: old problem, new insights. Trends Biochem Sci. 2015;40:165–171. doi: 10.1016/j.tibs.2015.01.007. [DOI] [PMC free article] [PubMed] [Google Scholar]
- Sanchez A, Golding I. Genetic determinants and cellular constraints in noisy gene expression. Science. 2013;342:1188–1193. doi: 10.1126/science.1242975. [DOI] [PMC free article] [PubMed] [Google Scholar]
- Sandelin A, Carninci P, Lenhard B, Ponjavic J, Hayashizaki Y, Hume DA. Mammalian RNA polymerase II core promoters: insights from genome-wide studies. Nat Rev Genet. 2007;8:424–436. doi: 10.1038/nrg2026. [DOI] [PubMed] [Google Scholar]
- Schor IE, Degner JF, Harnett D, Cannavo E, Casale FP, Shim H, Garfield DA, Birney E, Stephens M, Stegle O, et al. Promoter shape varies across populations and affects promoter evolution and expression noise. Nat Genet. 2017;49:550–558. doi: 10.1038/ng.3791. [DOI] [PubMed] [Google Scholar]
- Senecal A, Munsky B, Proux F, Ly N, Braye FE, Zimmer C, Mueller F, Darzacq X. Transcription factors modulate c-Fos transcriptional bursts. Cell Rep. 2014;8:75–83. doi: 10.1016/j.celrep.2014.05.053. [DOI] [PMC free article] [PubMed] [Google Scholar]
- Singer DS, Maguire JE. Regulation of the expression of class I MHC genes. Crit Rev Immunol. 1990;10:235–257. [PubMed] [Google Scholar]
- Singer DS, Mozes E, Kirshner S, Kohn LD. Role of MHC class I molecules in autoimmune disease. Crit Rev Immunol. 1997;17:463–468. [PubMed] [Google Scholar]
- Singh A, Razooky B, Cox CD, Simpson ML, Weinberger LS. Transcriptional bursting from the HIV-1 promoter is a significant source of stochastic noise in HIV-1 gene expression. Biophys J. 2010;98:L32–L34. doi: 10.1016/j.bpj.2010.03.001. [DOI] [PMC free article] [PubMed] [Google Scholar]
- Suter DM, Molina N, Gatfield D, Schneider K, Schibler U, Naef F. Mammalian genes are transcribed with widely different bursting kinetics. Science. 2011a;332:472–474. doi: 10.1126/science.1198817. [DOI] [PubMed] [Google Scholar]
- Suter DM, Molina N, Naef F, Schibler U. Origins and consequences of transcriptional discontinuity. Curr Opin Cell Biol. 2011b;23:657–662. doi: 10.1016/j.ceb.2011.09.004. [DOI] [PubMed] [Google Scholar]
- Tantale K, Mueller F, Kozulic-Pirher A, Lesne A, Victor JM, Robert MC, Capozi S, Chouaib R, Backer V, Mateos-Langerak J, et al. A single-molecule view of transcription reveals convoys of RNA polymerases and multi-scale bursting. Nat Commun. 2016;7:12248. doi: 10.1038/ncomms12248. [DOI] [PMC free article] [PubMed] [Google Scholar]
- Thattai M, van Oudenaarden A. Intrinsic noise in gene regulatory networks. Proc Natl Acad Sci USA. 2001;98:8614–8619. doi: 10.1073/pnas.151588598. [DOI] [PMC free article] [PubMed] [Google Scholar]
- Zabidi MA, Arnold CD, Schernhuber K, Pagani M, Rath M, Frank O, Stark A. Enhancer-core-promoter specificity separates developmental and housekeeping gene regulation. Nature. 2015;518:556–559. doi: 10.1038/nature13994. [DOI] [PMC free article] [PubMed] [Google Scholar]
- Zenklusen D, Larson DR, Singer RH. Single-RNA counting reveals alternative modes of gene expression in yeast. Nat Struct Mol Biol. 2008;15:1263–1271. doi: 10.1038/nsmb.1514. [DOI] [PMC free article] [PubMed] [Google Scholar]
- Zenklusen D, Singer RH. Analyzing mRNA expression using single mRNA resolution fluorescent in situ hybridization. Methods Enzymol. 2010;470:641–659. doi: 10.1016/S0076-6879(10)70026-4. [DOI] [PMC free article] [PubMed] [Google Scholar]