

The global landscape of Ca2+ homeostasis in budding yeast is deciphered. Quantified morphological responses under high concentration of Ca2+ and obtained high-dimensional Ca2+-genetic interaction profiles show functional gene clusters, which are used to build a global network among the Ca2+ homeostasis units acting in various cellular compartments.
Abstract
We investigated the global landscape of Ca2+ homeostasis in budding yeast based on high-dimensional chemical-genetic interaction profiles. The morphological responses of 62 Ca2+-sensitive (cls) mutants were quantitatively analyzed with the image processing program CalMorph after exposure to a high concentration of Ca2+. After a generalized linear model was applied, an analysis of covariance model was used to detect significant Ca2+–cls interactions. We found that high-dimensional, morphological Ca2+–cls interactions were mixed with positive (86%) and negative (14%) chemical-genetic interactions, whereas one-dimensional fitness Ca2+–cls interactions were all negative in principle. Clustering analysis with the interaction profiles revealed nine distinct gene groups, six of which were functionally associated. In addition, characterization of Ca2+–cls interactions revealed that morphology-based negative interactions are unique signatures of sensitized cellular processes and pathways. Principal component analysis was used to discriminate between suppression and enhancement of the Ca2+-sensitive phenotypes triggered by inactivation of calcineurin, a Ca2+-dependent phosphatase. Finally, similarity of the interaction profiles was used to reveal a connected network among the Ca2+ homeostasis units acting in different cellular compartments. Our analyses of high-dimensional chemical-genetic interaction profiles provide novel insights into the intracellular network of yeast Ca2+ homeostasis.
INTRODUCTION
Calcium is an essential component of eukaryotic cells. Although present in low concentration, intracellular Ca2+ is important for structural, enzymatic, and signaling roles in many cellular pathways (Williams, 1999). High levels of cytosolic Ca2+ are considered damaging because of precipitation with organic anions. For this reason, eukaryotic cells have a variety of homeostatic mechanisms to effectively acquire, use, and store Ca2+ and keep intracellular levels of Ca2+ at a nontoxic level (Cyert and Philpott, 2013).
The budding yeast Saccharomyces cerevisiae has been used as a eukaryotic model organism to study Ca2+ homeostasis. In S. cerevisiae, the concentration of free cytosolic Ca2+ is maintained between 50 and 200 nM, whereas its concentration in the environment ranges from <1 µM to >100 mM (Halachmi and Eilam, 1993; Cui and Kaandorp, 2006; Cui et al., 2009). A key element in Ca2+ homeostasis is its intracellular compartmentalization. Ca2+ pools are classified as exchangeable or nonexchangeable based on pulse-chase experiments (Eilam, 1981). Most of the nonexchangeable pools reside in cellular compartments, such as the vacuole and the endoplasmic reticulum (ER), and the exchangeable pools are believed to be located in the cytosol (Eilam, 1981; Eilam et al., 1985; Tanida et al., 1996).
The vacuole is the primary Ca2+-storage organelle in yeast, containing >90% of the intracellular Ca2+ (Dunn et al., 1994). A vacuolar Ca2+-transporting ATPase, Pmc1p, plays an important role in the sequestration of cytosolic Ca2+ into the vacuole, and pmc1 mutants exhibit reduced vacuolar Ca2+ content, resulting in a Ca2+-sensitivity growth phenotype (Cunningham and Fink, 1994). This pmc1 mutant phenotype is aggravated by disruption of the vacuolar H+-Ca2+ exchanger Vcx1p because Pmc1p and Vcx1p coordinate to maintain cytosolic Ca2+ homeostasis. Calmodulin, a major intracellular Ca2+-binding protein, is ubiquitous in eukaryotic cells, and the Ca2+/calmodulin signaling pathway responds to elevated cytosolic Ca2+. In response to the increased signal, Ca2+/calmodulin binds to calcineurin, the Ca2+/calmodulin-dependent phosphatase. Calcineurin up-regulates transcription of PMC1 via activation of the transcription factor Crz1p and negatively regulates Vcx1p by an unknown mechanism (Cunningham and Fink, 1996; Stathopoulos and Cyert, 1997; Pittman et al., 2004). Vacuolar proton-translocating ATPase (V-ATPase) VMA genes are also important for Ca2+ homeostasis (Ohya et al., 1991; Umemoto et al., 1991; Bachhawat et al., 1993; Hirata et al., 1993; Ho et al., 1993). Studies have shown that the proton-motive force driven by V-ATPase is required for activation of Ca2+ transporters in the vacuole, including Vcx1p (Cunningham and Fink, 1996; Pozos et al., 1996; Förster and Kane, 2000). The vacuole also has a counteracting Ca2+ release channel, Yvc1p, which depends on elevated cytosolic Ca2+ levels for its activity (Chang et al., 2010). Overexpression of Yvc1p results in elevation of cytosolic Ca2+ and Ca2+ sensitivity (Denis and Cyert, 2002).
In addition to the vacuole, the ER and the plasma membrane are also involved in Ca2+ homeostasis. The Ca2+ concentration in the lumen of the ER is much higher than in the cytosol (Demaurex and Frieden, 2003) and the ER contains several Ca2+-dependent enzymes. Calcium-sensitive 2p (Cls2p)/Csg2p encodes a regulatory subunit of mannosylinositol phosphorylceramide (MIPC) synthase, which is involved in sphingolipid metabolism and the regulation of Ca2+ homeostasis in the ER lumen (Beeler et al., 1994; Takita et al., 1995; Tanida et al., 1996). The plasma membrane has an additional mechanism for the regulation of Ca2+ influx called a high-affinity Ca2+ influx system (HACS), which is composed of at least three components, including Cch1p, Ecm7p, and Mid1p (Cunningham, 2011). Maintaining Ca2+ homeostasis through the HACS is necessary for adaptation and survival of the cells during mating processes (Iida et al., 1994; Fischer et al., 1997; Martin et al., 2011).
A genetic interaction refers to a phenotype caused by combining the effects of individual genetic variants. In general, based on the differences between observed and expected double-mutant phenotypes, genetic interactions can be classified into two groups, those with positive or negative interactions (Dixon et al., 2009). A negative genetic interaction describes a double mutant in which the phenotype is stronger than expected. The most extreme case of a negative fitness interaction is synthetic lethality, in which the combination of two mutations results in an inviable phenotype (Mani et al., 2008; Baryshnikova et al., 2013). Similar to genetic interactions, a chemical-genetic interaction refers to a phenotype caused by combining the effects of chemicals and genetic variants. Chemical synthetic lethality is a negative interaction in which a chemical compound causes lethality in a particular mutant. On the other hand, a positive genetic interaction indicates a double mutant with less defective fitness than expected (Mani et al., 2008; Baryshnikova et al., 2013). Along the same line, a positive chemical-genetic interaction is a suppression or masking of effects of a chemical compound in a particular mutant.
Genetic analysis of Ca2+-sensitive (cls) mutants in yeast uncovered a variety of genes required for Ca2+ homeostasis and Ca2+ tolerance. Genome-wide screening of the cls mutants unable to grow in the presence of 100 mM CaCl2 (Ohya et al., 1986b; Sambade et al., 2005; Ohnuki et al., 2007; Zhao et al., 2013) has led to the comprehensive identification of components directly or indirectly involved in intracellular Ca2+ homeostasis. More than 60 cls mutants defective in Ca2+ homeostasis have been isolated, such as pmc1, vma, and cls2 mutants (Ohya et al., 1986b; Ohnuki et al., 2007). Note that cls mutants exhibit various growth phenotypes, including divalent cation and pH sensitivity and carbon source utilization. pmc1 mutants exhibit a Ca2+-specific sensitive phenotype, whereas vma mutants exhibit broad sensitivity to Ca2+, Mn2+, and Zn2+. Our and other studies have indicated that cls mutants exhibit various unique morphological phenotypes in Ca2+-rich conditions (Yu et al., 1996; Ohnuki et al., 2007; Yoshida et al., 2013). These results suggested that the CLS genes have diverse cellular functions, including cell morphogenesis, and the entire gene network, involved in Ca2+ homeostasis, is not yet fully understood.
The present study investigates the global landscape of Ca2+ homeostasis in yeast by analyzing the high-dimensional Ca2+–cls interaction profiles of 62 cls yeast mutants. To identify Ca2+–cls interaction profiles, we quantified the cellular, nuclear, and actin morphology of the 62 cls mutants with the image processing system CalMorph (Ohtani et al., 2004; Ohya et al., 2005) in the presence and absence of 100 mM CaCl2. The obtained high-dimensional morphological data were used to define negative and positive interactions between Ca2+ and Ca2+-sensitive mutations. In addition, extensive statistical analyses of the interaction profiles revealed functional groups of CLS genes, functional correlations between the groups, and a global view of Ca2+ homeostasis and the Ca2+ regulatory network.
RESULTS
Identification of Ca2+–cls interactions using high-dimensional morphological phenotypes
Because high concentrations of Ca2+ induce morphological changes in the cls mutants, we used morphological characteristics to detect interactions between Ca2+ and the cls mutations (Ohnuki et al., 2007). Ca2+-induced morphological changes in the cls mutants are different from the Ca2+–cls interactions, which are a combinatorial effect of Ca2+ and the cls mutation defined as the differences in the Ca2+-induced morphological changes between wild type and the cls mutant, which has been defined in previous genetic interaction studies (Dixon et al., 2009; Jonikas et al., 2009). For each of the 501 morphological parameters, the most appropriate probability distribution model was selected from the Gaussian, gamma, beta, and beta-binominal as previously described (Yang et al., 2014), and a generalized linear model was used to standardize the high-dimensional morphological data of wild-type cells and the 62 cls mutants. Analysis of covariance (ANCOVA) revealed significant Ca2+–cls interactions in 209 morphological parameters (p < 0.05, likelihood ratio test between two linear models with/without the Ca2+–cls interaction term), which were summarized into 19 independent morphological features (p < 0.01 after the Bonferroni correction; Student’s t test for correlations between the 19 principal components [PCs] and the 209 parameters; Supplemental Figure S1). These analyses indicated that the Ca2+–cls interactions of the 62 cls mutants were observed in various morphological processes and at different stages of the cell cycle.
Genetic interactions are defined as positive or negative (Dixon et al., 2009). Similarly, interactions between Ca2+ and the cls mutations were positive or negative (Figure 1). Wild-type yeast cells exhibited an increased actin region in the presence of 100 mM CaCl2. This region was increased even further in the cls4-1 mutant (Figure 1, A and B), indicating a negative interaction between Ca2+ and cls4-1, which can be interpreted as a sensitized Ca2+ response caused by the cls mutation. In contrast, the size of the actin region in the vma1 mutant decreased in the presence of 100 mM CaCl2 (Figure 1, A and B), indicating a positive interaction between Ca2+ and vma1. Opposing directional changes of cls mutants were frequently observed in morphological parameters, representing positive interactions. This type of change is characteristic of phenotypic data that change bidirectionally.
FIGURE 1:

Systematic identification of Ca2+–cls interactions. (A) Representative images during S/G2 phase from five independent experiments. Colors indicate the cell wall (green), actin (red), and DNA (blue). Bar, 1 μm. (B) Size of the actin region in the bud of wild-type S/G2 cells. cls mutants in YPD supplemented with or without 100 mM CaCl2, calculated from the CalMorph parameter value A7-2_A1B, are also shown. Dashed lines indicate the morphological change of each cls mutant expected from the morphological change of the wild type. Orange and blue indicate positive and negative Ca2+–cls interactions, respectively. (C) Parameter values of A7-2_A1B in both wild-type cells and 62 cls mutants in the absence (x-axis) or presence (y-axis) of 100 mM CaCl2. Orange and blue circles indicate positive or negative Ca2+–cls interactions, respectively, of each cls mutant. Vertical and horizontal black lines indicate parameter values of the wild-type cell in the absence or presence, respectively, of 100 mM CaCl2. The blue line traces typical parameter values expected from the Ca2+-induced parameter changes of the wild type. Dark and light gray histograms indicate the distribution of wild type and cls mutants in the absence (top) or presence (right) of 100 mM CaCl2. Gray curve in the histograms represents probability densities of wild-type cells in each condition. Inset, relationships among signs of Zwt scores that indicate the degree of Ca2+-induced morphological changes of wild-type cells. Zint scores demonstrate the degree of each Ca2+–cls interaction and resultant Ca2+–cls interaction scores (π score; see Materials and Methods).
The size of the actin region in wild-type cells and the 62 cls mutants was mapped in the presence or absence of 100 mM CaCl2 (Figure 1C), and we defined both positive and negative interaction spaces. When the Ca2+-dependent morphological changes of wild-type cells are positive, the regions above and below the expected lines represent negative and positive interactions, respectively (Figure 2A). If the Ca2+-dependent morphological changes of wild-type cells are negative, the geometric relationship flips vertically (Figure 2B). Suppression and masking are assigned as positive interactions (Figure 2, A and B), as previously described (Dixon et al., 2009). Standardized variables were calculated as significance from the expected response values of mutant based on corresponding wild-type response, expressed as a π score, and used for further analysis (π > 0 for a positive interaction; π < 0 for a negative interaction).
FIGURE 2:

Graphical representation of the two types of morphological phenotypes for Ca2+–cls interactions. (A, B) Red and green arrows indicate increment and decrement of parameter values of the wild type caused by Ca2+ treatment, respectively. Blue lines trace typical parameter values in the presence of high Ca2+ expected from the Ca2+-induced morphological changes of wild-type cells. Deviations from the expected value in the same direction with Ca2+-induced morphological changes of the wild type are scored as negative Ca2+-cls interactions (depicted in blue). Deviations from the expected values in the opposite direction with Ca2+-induced morphological changes of wild-type cells are classified as positive interactions (depicted in light orange). In positive Ca2+–cls interactions, cls mutants exhibited fewer Ca2+-induced morphological changes than expected compared with the wild type, which are classified into symmetric, masking, and suppression subcategories, as previously described (Dixon et al., 2009). cls mutants also exhibited Ca2+-induced morphological changes in the opposite direction of wild type (lower or higher than the diagonal line in A or B, respectively) and lower or higher level compared with wild type in the presence of 100 mM CaCl2 (lower or higher than the horizontal black line in A or B, respectively).
Feature analysis of the Ca2+–cls interactions
To understand further the physiological implication of Ca2+–cls interactions, we performed a feature analysis. First, the majority of the cls mutants exhibited more positive interactions than negative interactions (Supplemental Figure S2A). We found that 88.7% (55 of 62) of cls mutants exhibited more positive interactions than negative. In other words, 85.73% (1382 of 1612 significant interactions out of 7006 assays, 62 cls mutants × 113 parameters, at p < 0.05 by Wald test, and false discovery rate [FDR] = 0.24) of the detected interactions were positive. It is notable that all fitness-related Ca2+–cls interactions were negative because Ca2+ has aggravating effects on the growth of Ca2+-sensitive mutants. Second, the number of Ca2+–cls interactions was not correlated with that of Ca2+-induced morphological changes in the cls mutants (Ohnuki et al., 2007; Supplemental Figure S2B). The number of Ca2+–cls interactions was less correlated (R = 0.27, p < 0.05, Student’s t test) with that of significantly changed parameters in each mutant (Mann–Whitney U test, p < 0.01), implying that Ca2+–cls interactions had different implications than with Ca2+-induced morphological changes (for complementary information, see Ohnuki et al., 2007). Third, only a small proportion of cls mutants exhibited many Ca2+–cls interactions. Although the number of Ca2+–cls interactions varied, only 3.22% of the cls mutants exhibited >60 Ca2+–cls interactions (Supplemental Figure S2C). Finally, cls mutants with numerous Ca2+–cls interactions tended to show more severe growth defects in the presence of 100 mM CaCl2 (Supplemental Figure S2D), suggesting that the CLS genes with many Ca2+–cls interactions may play important roles during cell proliferation and morphogenesis under conditions of high Ca2+. Thus, the Ca2+–cls interaction profiles likely provide a unique source for the understanding of various Ca2+ responses in the cls mutants.
Clustering analysis of high-dimensional Ca2+–cls interaction profiles
To test whether similarities of the Ca2+–cls interaction profiles can be used for functional classification of the CLS genes, we first extracted the interaction profiles of 16 PCs from 209 parameters by principal component analysis (PCA) and performed clustering analysis with the multiscale bootstrap technique (Suzuki and Shimodaira, 2006; Figure 3). The analysis showed that nine classes, with a total of 49 cls mutants (79%), were statistically identified (the approximately unbiased probability value [AU p] estimates the probability of observation of a given class in infinite number of classes >0.95; for more information, see Shimodaira, 2002; Figure 3). The defective cellular functions in the mutants of several classes were annotated by gene ontology (Supplemental Table S1). For example, class I consists of 17 V-ATPase–defective mutants (Ohya et al., 1991; Kane, 2006). Class II involves several mutants in the core subunits of homotypic fusion and protein sorting (HOPS) and class C core vacuole/endosome tethering (CORVET) complexes involved in membrane fusion at endosomes, vacuoles, and lysosomes (Balderhaar and Ungermann, 2013). Class IV contains the mutants cls4-1 and bem1, which are defective in Ca2+-modulated bud formation (Yoshida et al., 2013). Class VIII includes fet3 and ftr1, which are defective in iron transport (Kwok et al., 2006). We also noted that the cls mutants with related Ca2+–cls interaction profiles have similar intracellular Ca2+ content. The intracellular Ca2+ content in class I, with the exception of vma22, was 0.6-fold less than that of wild-type cells, whereas the intracellular Ca2+ content of the class II cls mutants was 3.1-fold greater than wild type (Supplemental Table S1). Moreover, some cls mutants with similar Ca2+–cls interaction profiles showed similar divalent cation sensitivity; 29 mutants showed Ca2+-specific sensitivity, such as mutants of IV, VIII, and IX classes, whereas all of the vma mutants showed broad divalent cation sensitivity (Supplemental Tables S1 and S2). These results suggested that the majority of the cls mutants with related Ca2+–cls interaction profiles have defects in a similar function.
FIGURE 3:

Clustering analysis of the cls mutants based on similarities of the Ca2+–cls interaction profiles. The orange and blue boxes indicate π scores that reflect the degree of positive and negative Ca2+–cls interactions. Dissimilarity indicates one minus Pearson product–moment correlation coefficient (PCC) between the vectors of 209 dimensions. The color coding of each class indicates robustly clustered mutant classes at AU p > 0.95 calculated by the multiscale bootstrap technique with 3000 iterations (Suzuki and Shimodaira, 2006).
Riboflavin deficiency of class VI cls mutants results in failure to maintain Ca2+ homeostasis
To examine further whether cls mutants with related Ca2+–cls interaction profiles have defects in a similar function, we focused on the class VI cls mutants. Class VI contains gly1, rib4, and yel045c, all of which showed a slow growth phenotype in yeast extract/polypeptone/dextrose (YPD) medium and a severe growth defect in Ca2+-rich medium. RIB4 and GLY1 encode lumazine synthase and threonine aldolase, respectively, which play a role in the riboflavin biosynthetic pathway. Lumazine synthase synthesizes a precursor of riboflavin (Monschau et al., 1998), and overproduction of threonine aldolase increases riboflavin content (García-Ramírez et al., 1995). YEL045c is a dubious open reading frame in the promoter region of GLY1. Because the levels of riboflavin are likely reduced in all mutants, we tested whether the Ca2+-sensitive phenotype of the class VI cls mutants was suppressed by riboflavin. We found that the Ca2+-sensitive growth phenotype of rib4 was completely suppressed by riboflavin, whereas the other class VI mutants were only partially suppressed (Figure 4A), suggesting that riboflavin is required for Ca2+ homeostasis.
FIGURE 4:

Riboflavin deficiency of class VI cls mutants induces Ca2+ homeostasis. (A) The Ca2+-sensitive growth phenotype of the class VI mutants was suppressed by riboflavin. Fivefold serial dilutions of the indicated strains were spotted on YPD, YPD + 200 mg/l riboflavin, YPD + 300 mM CaCl2, or YPD + 200 mg/l riboflavin + 300 mM CaCl2 and incubated at 30°C for 4 d. (B) Vacuolar acidification of the class VI mutants. Vacuoles of the indicated strains were stained with quinacrine and examined by fluorescence microscopy. Bar, 5 μm. (C) Lipid composition of the class VI cls mutants. Asterisk indicates undefined species. (D) Cellular NADP+ measurement of the class VI mutants. NADP+ and NADPH were extracted from cells grown in YPD and measured; the ratio of NADP+/NADPH is shown as mean ± SD (n = 3). Significance levels at **p <0.01 and ***p< 0.001 (Student’s t test).
To identify whether the class VI cls mutants are defective in a particular pathway, we examined vacuolar acidification and sphingolipid metabolism in these mutants. In contrast with the V-ATPase mutants, the class VI mutants have intact quinacrine-positive vacuoles (Figure 4B), suggesting that riboflavin is not critical for vacuolar acidification. We examined the ability to synthesize sphingolipids after wild-type and mutant cells were cultured in YPD medium containing [3H] palmitic acid for 90 min. The lipids were extracted and separated by thin-layer chromatography (TLC). Consistent with a previous report (Uemura et al., 2003), deletion of the CSG2 gene, which encodes MIPC synthase, resulted in a drastic decrease in the amounts of MIPC and M(IP)2C and an increase in the amount of IPC (Figure 4C). On the other hand, the lipid composition of the class VI cls mutants was quite similar to that of wild-type cells, suggesting that riboflavin is not important for MIPC synthase activity (Figure 4C). We then examined whether failure of Ca2+ homeostasis results in an energy imbalance, by measuring the amount of NADP+ and NADPH. We found that class VI cls mutants have elevated ratios of NADP+/NADPH concentrations (Figure 4D). The ratio of the concentrations of NADP+/NADPH of cls2/csg2 was similar to that of wild-type cells. Thus, class VI mutants all exhibited a riboflavin deficiency, causing an elevation of NADP+, possibly due to a failure to maintain Ca2+ homeostasis.
Characterization of Ca2+–cls interactions in each functional gene unit
To understand further each class of mutants, we compared positive and negative Ca2+–cls interactions in each class (Figure 5A). The 1612 significant interactions (out of 7006 assays; 62 cls mutants × 113 parameters) were identified at p < 0.05 by Wald test, where the permutation test showed that <387 interactions were expected to be detected by chance (FDR = 0.24). The total number of Ca2+–cls interactions was biased, depending on the class. In particular, cls mutants of classes I (V-ATPase), II (class C vacuolar protein sorting or C-VPS), and IV (Ca2+-modulated bud formation) showed 9.22, 8.62, and 5.77 times more average interaction density, respectively, than class VIII (Fe ion transporter; Figure 5A, inset). Therefore, the genes of classes I, II, and IV cls mutations may be important under conditions of high Ca2+. Note that class I and II cls mutations resulted in severe growth defects in Ca2+-rich medium (Supplemental Table S1). Negative interactions were more frequently observed in particular classes: class III and IV cls mutants showed a high proportion of negative Ca2+–cls interactions (Figure 5B), on average 8.8 and 7 times higher, respectively, than class I cls mutants (Figure 5B, inset). This suggested that each class of mutants has a unique pattern of negative and positive Ca2+–cls interactions.
FIGURE 5:

Properties of the Ca2+–cls interaction profiles in the cls mutants. (A) Number of significant positive and negative interactions in 113 parameters among the indicated cls mutants. Orange and blue bars indicate significant positive and negative Ca2+-cls interactions, respectively (p < 0.05, Wald test). Roman numerals (I–IX) of each cls mutant correspond to the nine detected classes in Figure 3. Colors highlighting the cls mutants indicate high (classes I, II, and IV) and low (class VIII) numbers of Ca2+–cls interactions, respectively. Inset, mean of Ca2+–cls interactions in each class (Figure 3). (B) Proportion of significant negative Ca2+–cls interactions. Colors highlighting the cls mutants indicate the high proportion of negative Ca2+–cls interactions (classes III and IV). Inset, mean of proportion of negative Ca2+–cls interactions in each class (Figure 3).
Class IV cls mutants shared three significant negative Ca2+–cls morphological parameter interactions, which can be attributed to S/G2 and M phases of the cell cycle (Supplemental Figure S3A). Class III cls mutants also had three significant negative interactions attributed to G1 and S/G2 phases (Supplemental Figure S3B). Considering that class IV mutations sensitize morphological responses in S/G2 and M phases of the cell cycle and class III mutations sensitize morphological responses in G1 and S/G2 phases, it seemed that sensitized responses during the cell cycle are class specific. This suggested that the morphology-based negative interactions are unique signatures that represent sensitized cellular processes and pathways.
Responses of the Ca2+-sensitive mutants to calcineurin inhibition
Calcineurin is a Ca2+/calmodulin-dependent phosphatase important for several cellular functions, including Ca2+ homeostasis (Cyert, 2003). To understand each class of mutants with respect to calcineurin regulation, we systematically investigated the Ca2+-sensitive phenotypes of the cls mutants after inactivation of calcineurin. For this purpose, we used the immunosuppressant drug FK506 (Heitman et al., 1991), which specifically inhibits calcineurin activity. Previous studies showed that inactivation of calcineurin confers either alleviating or aggravating effects on cell growth: FK506 suppressed the Ca2+-sensitive growth of pmc1 (Cunningham and Fink, 1994), whereas it enhanced that of vma mutants (Tanida et al., 1995). We found that the Ca2+-sensitive phenotype of 13 cls mutants (21%) was suppressed, whereas that of 40 cls mutants (65%) was enhanced (Figure 6A, Supplemental Figures S4 and S5, and Supplemental Table S2). Of interest, the cls mutants with FK506-enhanced phenotypes accumulated either high or low intracellular Ca2+ content (Supplemental Figure S6). Thus, the majority of the cls mutants with severely altered Ca2+ homeostasis showed FK506-enhanced phenotypes, consistent with previous reports (Tanida et al., 1995; Cunningham and Fink, 1996). Each mutant class had a common response to FK506. Class I, II, and III cls mutants showed FK506-enhanced Ca2+-sensitivity, whereas class IV, VI, and VIII mutants showed FK506-suppressed Ca2+-sensitivity (Supplemental Table S1). This suggested that inactivation of calcineurin has similar effects on cls mutants with similar functional defects, which supports functional classification of the CLS genes based on similarities of the Ca2+–cls interaction profile as well.
FIGURE 6:
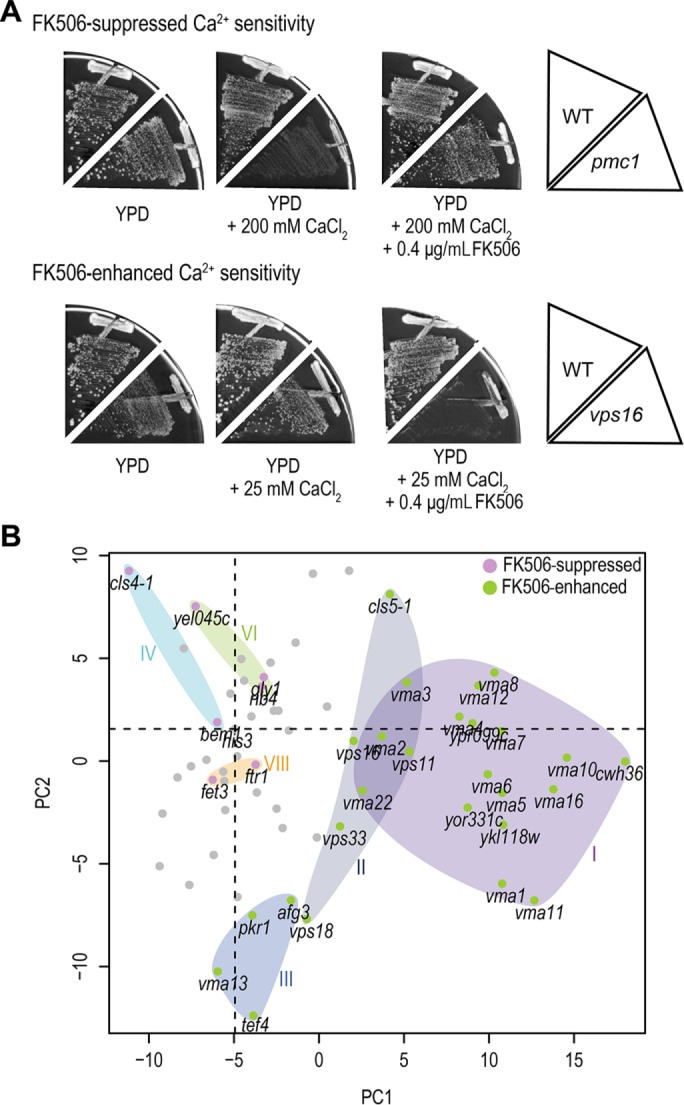
Effects of FK506 on the growth of cls mutants in the presence of high Ca2+. (A) Example of the aggravating and alleviating effects of FK506 on the growth of cls mutants in conditions of high Ca2+. The growth of vps16 (25 mM) and pmc1 (200 mM) mutants in YPD medium with FK506 (0 and 0.4 μg/ml) in combination with CaCl2 was tested. Cells were incubated for 4 d at 30°C. Additional conditions tested are shown in Supplemental Figure S4. (B) Scatter plot of PC scores for PC1 and PC2 of the Ca2+–cls interaction profiles. Strains are represented by their coordinates along the first two PCs. Roman numerals correspond to the detected classes in Figure 3. Purple and green circles indicate FK506-suppressed and -enhanced Ca2+ sensitivity, respectively. The cls mutants of classes I–III showed FK506-enhanced Ca2+ sensitivity, whereas the cls mutants of classes IV, VI, and VIII showed FK-506 suppressed Ca2+ sensitivity.
FK506-suppressed and -enhanced cls mutants discriminated well after the interaction profile PCA. We found that cls mutants were distinguishable in two-dimensional Ca2+–cls interaction space, particularly in the first and second PCs (PC1 and PC2, respectively; Figure 6B and Supplemental Figure S7). FK506-enhanced class I and II mutants are all plotted in the right side with higher PC1 scores and class III with lower PC2 scores. Representative morphological features of PC1 and PC2 are shown in Supplemental Figure S8. Thus, Ca2+–cls interaction profiles can be used to discriminate between suppression and enhancement of the Ca2+-sensitive phenotypes triggered by inactivation of calcineurin.
Global view of Ca2+ homeostasis and Ca2+ regulatory pathways
To analyze the similarity of the Ca2+–cls interaction profiles among the nine classes, we calculated the Pearson product–moment correlation coefficient (PCC) between each pair of the 62 cls mutants. We found both positive (red) and negative (blue) correlations between different class mutants (Supplemental Figure S9). Most of the Ca2+–cls interaction profiles of the class I and II cls mutants were negatively correlated with other cls mutants, illustrating that class I and II CLS genes function in opposite directions from others in Ca2+ homeostasis. Note that class I and II mutants shared a common phenotype of FK506-enhanced Ca2+ sensitivity. Therefore, calcineurin may function cooperatively with class I and II CLS genes to alleviate the deleterious effects of high environmental Ca2+. In contrast, most of the Ca2+–cls interaction profiles of the cls mutants in classes IV–IX were positively correlated with one another (Supplemental Figure S9), suggesting that these classes may have similar functional roles in the global Ca2+ regulatory network. Class IV, VI, and VIII cls mutants all showed FK506-suppressed Ca2+ sensitivity. Therefore, calcineurin may function in an opposing manner with classes IV (Ca2+-modulated bud formation), VI (riboflavin biosynthesis), and VIII (Fe ion transporter). On the basis of the correlation analysis, we illustrate a global network of Ca2+ homeostasis among the CLS genes, which act in different cellular compartments and cellular processes (Figure 7). This network provides a systems-level understanding of Ca2+ regulatory mechanisms in several organelles. Class I (V-ATPase) and II (C-VPS) proteins, which are localized in the vacuolar membrane and endosome, respectively, and are involved in the maintenance of Ca2+ homeostasis, were expected to play central roles in conditions of high Ca2+. Multiple interactions are observed in this network of whole-cellular responses to high levels of extracellular Ca2+ and are orchestrated by several Ca2+ regulatory mechanisms.
FIGURE 7:

Correlation-based network of cls mutants. Similarities of Ca2+–cls interaction profiles were measured for all gene pairs by calculating Pearson product–moment correlation coefficients (PCCs) from the Ca2+–cls interaction matrix (PCC > 0.2) and are shown as positive (red line) or negative (blue line) correlations of the Ca2+–cls interaction profile. Node size stands for the average number of significant Ca2+–cls interactions within each class (p < 0.05, Wald test; Figure 5A). In addition, the effects of FK506 on each cls mutant are presented as node color (Supplemental Figure S4 and Supplemental Table S2). The node outline indicates the proportion of significant negative Ca2+–cls interactions of each mutant (Figure 5B). Gene ontologies of each class were obtained from the Saccharomyces Genome Database (www.yeastgenome.org/). Relative Ca2+ content compared with wild type is shown in brackets. Data from Ohnuki et al. (2007) and Yoshida et al. (2013). Divalent cation sensitivity is underlined for each class (Supplemental Tables S1 and S2). Whereas all of the vma mutants showed broad divalent cation sensitivity, 29 strains showed Ca2+-specific sensitivity, such as mutants of IV, VIII, and IX classes (sensitivity to other divalent cation rather than Ca2+ decreases the Ca2+-specific sensitivity). The inner square next to each class represents quinacrine staining (red, dark pink, light pink, and white illustrate vacuoles that were not stained, vacuoles with morphological defects, stained vacuoles, and a mixture of stained and nonstained vacuoles, respectively). The outer square displays the Pet– phenotype (dark blue, light blue, and white represent minus, mixture of minus and plus, and plus Pet– phenotype, respectively). Data from Ohnuki et al. (2007).
DISCUSSION
We applied high-dimensional chemical-genetic interaction profiles to gain a systems-level understanding of Ca2+ homeostasis in S. cerevisiae. Ca2+-induced morphological changes in Ca2+-sensitive mutants were quantified from 501 points of view and analyzed to obtain interaction profiles between Ca2+ and Ca2+-sensitive mutations. Interaction profiles were clustered into nine groups linked to cellular processes involved in vacuolar acidification, cell morphogenesis, Ca2+-modulated bud formation, riboflavin biogenesis, protein sorting, and Fe ion transportation, as well as unknown processes in the cytoplasm, nucleus, and ER. On the basis of the analysis of the Ca2+–cls interaction profiles, we constructed a systems-level view of Ca2+ homeostasis. Because the deletion mutants of all the nonessential genes in the yeast genome were screened for Ca2+-sensitive mutants, this study provides a blueprint for a global understanding of the factors required for Ca2+ homeostasis because it covers all the genes essential for proliferation in conditions of high Ca2+.
Positive and negative Ca2+–cls interactions based on morphological changes
In analogy with genetic interactions, combinatorial effects of chemical components and genetic variants to generate a phenotype are known as chemical-genetic interactions. In addition, a negative interaction (chemical synthetic lethality) defines as lethal effects of a chemical compound in a given mutant. Ca2+-sensitive mutants showed deleterious effects on growth in conditions of high Ca2+, exhibiting a negative interaction with Ca2+. In this study, high-dimensional morphological data were employed to describe negative and positive interactions between Ca2+ and Ca2+-sensitive mutations. Whereas fitness Ca2+–cls interactions were all negative, morphological Ca2+–cls interactions were positive and negative, although there were more positive interactions. A negative interaction is interpreted as a Ca2+ response sensitized by the cls mutation, whereas a positive interaction is caused by suppression, masking changes of the cls mutation. Thus, Ca2+–cls interaction profiles based on morphological changes will likely provide unique data sources.
Studies of several model organisms have proposed that many genes have a few genetic interactions, whereas a small number of genes are highly connected to one other and serve as network hubs (Dixon et al., 2009). Consistent with this, this study revealed that a small number of CLS genes exhibit a large number of Ca2+–cls interactions. The number of Ca2+–cls interactions was strongly biased in the nine functional classes. In particular, classes I (V-ATPase), II (C-VPS), and IV (Ca2+-modulated bud formation) exhibited a large number of Ca2+–cls interactions. Note that the same classes (I, II, and IV) of cls mutations resulted in severe growth defects in Ca2+-rich medium. Therefore, the CLS genes with many Ca2+–cls interactions have a large effect, serving as hubs that play key roles in cell proliferation and morphogenesis in conditions of high Ca2+.
CLS genes with similar Ca2+–cls interaction patterns share intracellular functions
Genetic interaction profiles have been used to classify genes based on intracellular functions, proposing that genes that belong to a given biological pathway or process tend to share similar genetic interaction profiles (Tong et al., 2004; Schuldiner et al., 2005; Pan et al., 2006; Jonikas et al., 2009; Costanzo et al., 2010, 2016). Using hierarchical clustering based on the Ca2+–cls interaction scores, we identified nine functional gene units in Ca2+ homeostasis and Ca2+ regulatory pathways. This indicated that the CLS genes with the same cellular function showed a similar pattern of morphological Ca2+–cls interactions.
Clustering analysis of 59 CLS genes was performed previously based on the similarity of Ca2+-induced morphological changes (Ohnuki et al., 2007). Fifty-one percent of the cls mutants were classified into seven groups, and three groups were functionally annotated. In the present study, we performed an improved clustering analysis based on the Ca2+–cls interaction profiles, successfully classified 79% of the mutants into nine groups, and functionally annotated six classes. We applied a generalized linear model (GLM) to obtain the Ca2+–cls interaction profiles from high-dimensional morphological data. After normalization of the traits with the GLM, the interaction terms representing “altered Ca2+-response of cls mutants” were successfully extracted by calculating the deviation from the expected response values.
The identified clusters can be used to predict the function of the uncharacterized CLS genes. One of the examples is class VI, to which three genes, RIB4, GLY1, and YEL045C, were assigned. Rib4p is required for riboflavin biosynthesis, which is a precursor of flavin adenine dinucleotide (FAD; Oltmanns and Bacher, 1972), Gly1p is the glycine biosynthetic enzyme threonine aldolase (McNeil et al., 1994), and YEL045C is a dubious open reading frame in the promoter region of the GLY1 gene. In the filamentous fungus Ashbya gossypii, which is closely related to yeast, production of riboflavin was improved by overexpression of the GLY1 gene (Monschau et al., 1998), suggesting that Gly1p is involved in riboflavin biosynthesis. The Ca2+-sensitive growth phenotype of the class VI cls mutants was suppressed by the addition of riboflavin. Although the molecular mechanism remains to be elucidated, all class VI cls mutants exhibited defects not in vacuolar acidification or sphingolipid biosynthesis, but in perturbation of the energy balance of NADPH.
The class II cls mutants, where cls5-1 was classified with vps11, vps16, vps18, and vps33, are known to be core subunits of the CORVET and HOPS complexes, which function in endosome–endosome fusion and homotypic vacuole fusion (Balderhaar and Ungermann, 2013). Although CLS5 (PFY1) encodes profilin, which is required for actin organization, both intracellular Ca2+ content and initial Ca2+ uptake were elevated in cls5-1 mutants and four other Ca2+-sensitive mutants (Ohya et al., 1986b), suggesting common roles in the maintenance of intracellular Ca2+ homeostasis. An immunoprecipitation experiment showed colocalization of Cls5p (Pfy1p) with Vps16p and Vps33p in the vacuolar membrane (Xu and Wickner, 2006). The four vps mutants were originally isolated as class I vacuolar morphology (vam) mutants, with tiny or invisible vacuoles (Wada et al., 1992), whereas the vacuoles in cls5-1 mutants were fragmented in the presence of high levels of environmental Ca2+ (unpublished data). Therefore, it is likely that Cls5p and the four Vps proteins are involved in vacuolar biogenesis and its functions.
Positive or negative regulation of calcineurin in functional units of Ca2+ homeostasis and Ca2+ regulatory pathways
We examined how calcineurin is involved in the cellular response to high levels of Ca2+ by testing the effect of FK506 on the Ca2+ sensitivity of a series of cls mutants. Our results suggested that calcineurin functioned either positively or negatively with the functional CLS gene units. We confirmed that FK506 enhanced the Ca2+ sensitivity of the class I cls (vma) mutants, which were defective in vacuolar membrane H+-ATPase. Several lines of evidence suggest that Ca2+ transport into the vacuoles of class I cls mutants is decreased (Ohya et al., 1991; Tanida et al., 1995). Yeast cells have compensatory mechanisms for Ca2+ transport into the vacuole, such as the Ca2+-ATPase Pmc1p (Cunningham and Fink, 1994), and calcineurin positively regulates Pmc1p through activation of the transcription factor Crz1p (Stathopoulos and Cyert, 1997). Because the calcineurin-dependent positive feedback is inhibited in the presence of FK506, Ca2+ sequestration into the vacuole is likely decreased in the class I cls (vma) mutants. Note that vma3 mutant cells exhibit decreased cytosolic Ca2+ and increased organellar Ca2+ after treatment with FK506 (Tanida et al., 1995). These findings imply an additional regulatory mechanism in which calcineurin negatively regulates Ca2+ sequestration into other organelles such as the ER and the Golgi complex (Cunningham, 2011) under conditions of high Ca2+. Previous studies reported that calcineurin may regulate Ca2+ sequestration into the ER in cooperation with Cls2p, located in the ER membrane (Beeler et al., 1994; Takita et al., 1995; Tanida et al., 1996). Because FK506 had a minor effect on the Ca2+ sensitivity of many of the class V cls mutants, including cls2, class V CLS genes may function downstream of calcineurin. Consistent with this, the Ca2+–cls interaction profiles of class I cls (vma) mutants negatively correlated with class V cls mutants, which are localized to the ER (Ohya et al., 1991; Tanida et al., 1995), suggesting that the opposing calcineurin responses may be a result of the different Ca2+–cls interaction profiles.
Our results also suggested that calcineurin negatively regulates bud formation under conditions of high Ca2+. The Ca2+ sensitivity of class IV (Ca2+-modulated bud formation) cls mutants was suppressed by FK506. The Ca2+–cls interaction profiles of class IV cls mutants tended to negatively correlate with class I cls (vma) mutants, indicating the opposite response of calcineurin. Because elevated cytosolic Ca2+ has harmful effects on cellular physiology (Missiaen et al., 2000), one interesting idea is that calcineurin may function as a checkpoint that senses cytosolic Ca2+. On elevation of cytosolic Ca2+, calcineurin up-regulates Ca2+ sequestration to the vacuole and down-regulates bud formation to avoid the toxic effects of Ca2+ and maintain Ca2+ homeostasis. Note that Ca2+ stress results in distinct changes of the global gene expression pattern in yeast through the calcineurin/Crz1p signaling pathway (Yoshimoto et al., 2002). Therefore, in order to test this hypothesis, decipherment of the global gene expression in each cls mutant can be considered as a future direction.
Study of the morphological chemical-genetic interaction profiles
In the eukaryotic model organism S. cerevisiae, the nonessential gene deletion set (Winzeler et al., 1999) and recently developed libraries of essential genes harboring conditional and hypomorphic alleles (Mnaimneh et al., 2004; Ben-Aroya et al., 2008; Jin et al., 2011; Li et al., 2011) have enabled rapid and comprehensive identification of factors that function in cellular processes of interest. However, functional characterization of these genes, which generally requires gene-by-gene follow-up investigation, remains a bottleneck. Our chemical-genetic interaction approach allows systematic characterization of individual genes, providing a systems-level global view, as well as the molecular bases for cellular processes. Chemical-genetic interaction profiling based on high-dimensional morphological phenotypes described here identifies critical relationships within pathways with multiple inputs (e.g., environmental stress, chemical perturbation, gene perturbation) and outputs (e.g., homeostasis, gene expression, cell cycle progression). We propose that this strategy will be applicable for the systematic analysis of complex cellular processes.
MATERIALS AND METHODS
Strains and growth conditions
Yeast strains are listed in Supplemental Table S3. All strains are isogenic derivatives of BY4741 (MATa; his3; leu2; met15; ura3; Euroscarf, www.euroscarf.de). Two mutants, cls4-1 and cls5-1, were constructed from YOC138-C (MATaade1 cls4-1; Ohya et al., 1986a) and YOC989 (MATα leu2 lys2 trp1 ura3 cls5-1; Yoshida et al., 2013). Briefly, a kanamycin-resistance cassette was amplified from the plasmid pFA6a-GFP(S65T)-kanMX6 (Longtine et al., 1998), targeted to the 3’-untranslated region of the CLS4 and CLS5 genes, and located ∼250 base pairs downstream of the stop codon. The cls4-1 and cls5-1 loci linked to the kanamycin-resistance cassette were amplified by PCR, the amplified fragments were transformed into BY4741, and Geneticin-resistant transformants were selected. Replacement of the wild-type CLS4 and CLS5 genes was confirmed by PCR and sequencing.
S. cerevisiae strains were grown in YPD medium with 1% (wt/vol) Bacto yeast extract (BD Biosciences, San Jose, CA), 2% (wt/vol) polypeptone (Wako Chemicals, Richmond, VA), and 2% (wt/vol) dextrose, pH 5.5. Ca2+ sensitivity was tested using 100 mM CaCl2 (Ca2+-rich medium). YPG medium (1% Bacto yeast extract, 2% polypeptone, 2% [vol/vol] glycerol) was applied to survey Pet– phenotypes (inability to grow on a nonfermentable carbon source). Sensitivity to other divalent cations, including 100 mM MgCl2, 3 mM ZnCl2, and 3 mM MnCl2, was also surveyed. Agar (2% [wt/vol]) was used as the solidifier. YPD medium contains 0.4 μg/ml FK506 (Cayman Chemical, Ann Arbor, MI), and various concentrations of CaCl2 (0, 25, 50, 75, and 200 mM) were used to examine the effects of FK506 on cell growth under conditions of high Ca2+. Yeast growth was computationally analyzed via image quantification using ImageJ software, version 1.50i (Abràmoff et al., 2004). One-way analysis of variance (ANOVA) with a negative-binomial probability distribution function was used for statistical analysis. Results were also visually confirmed. To check riboflavin effect on Ca2+-sensitivity, a higher CaCl2 concentration (300 mM; compare with the main experiment, 100 mM) was used to detect any slight effects on suppression of Ca2+-sensitive growth.
Measurements of exchangeable and nonexchangeable Ca2+ pools
Intracellular calcium content was measured as described previously (Cunningham and Fink, 1994) with minor modification. Briefly, exponentially growing yeast cells ([1–1.5] × 107 cells/ml) in YPD medium, pH 5.5, were collected, resuspended in YPD medium, pH 5.5, containing 45CaCl2 (>10 Ci/g; PerkinElmer, Waltham, MA), and incubated at 30°C for 6.5 h. Protein content was measured using a bicinchoninic acid protein assay kit (Pierce, Rockford, IL) after incubation of each strain in the absence of 45CaCl2 in the same conditions as 45CaCl2-treated cells. Cultured yeast cells were collected and suspended in 0.2 ml of 10% trichloroacetic acid.
Acquisition and image processing
Ca2+ treatment of yeast cells was performed as described previously (Ohnuki et al., 2007). Cells in log phase (8 × 10⁶ cells) in YPD medium were collected, washed once in YPD medium with or without 100 mM CaCl2, and resuspended in 4 ml of the respective medium at a final concentration of 2 × 10⁶ cells/ml. Cells were then incubated for 5 h at 30°C, washed once with YPD medium, fixed in YPD medium supplemented with 3.7% formaldehyde, and resuspended in phosphate-buffered saline (PBS; 0.1 M potassium phosphate buffer, pH 6.5). Triple staining and image analysis using CalMorph (version 1.0) software was performed as previously described (Ohya et al., 2005). CalMorph automatically calculated 501 morphologic parameters of each yeast cell. Cells were stained for three components: fluorescence isothiocyanate–concanavalin A (Sigma-Aldrich, St. Louis, MO), rhodamine–phalloidin (Invitrogen, Carlsbad, CA), and 4’,6-diamidino-2-phenylindole (Sigma-Aldrich), which were used to stain mannoprotein, actin, and the nucleus, respectively. Images of triple-stained cells were captured using an AxioImager M1, a 100× EC-Plan NEO objective lens (Carl Zeiss) equipped with a CoolSNAP HQ cooled charge-coupled device camera (Roper Scientific), and AxioVision software (Carl Zeiss).
Statistical model to assess Ca2+–cls interactions
Statistical analyses were performed with R software (www.r-project.org). To statistically assess Ca2+–cls interactions for morphological phenotypes, a GLM, an extension of the normal linear model, was used, which applied not only a Gaussian, but also additional probability distributions (Nelder and Wedderburn, 1972). Models of the probability distributions for the 501 morphological parameters were determined to accommodate the statistical model used in the GLM as previously described, with some modifications (Yang et al., 2014). Of the 501 parameters calculated by CalMorph, 220 parameters were coefficients of variation (CVs) of their related mean parameters. Estimations of cell-to-cell independent variability were obtained via nonlinear Lowess regression of the CV values as previously described (Yvert et al., 2013) to uncouple concomitant dependence between the CV parameters and the mean parameter values (Levy and Siegal, 2008). After normalization, 220 CV parameters were assumed to be Gaussian-distributed. In addition, 183 parameters, representing the mean cell morphologies with positive continuous values, were assumed to be gamma-distributed, as previously described (Yang et al., 2014). Moreover, 37 parameters, which represented the mean cell morphologies with continuous values ranging from 0 to 1, were assumed as beta- or zero-inflated beta-distributed. The remaining 61 parameters, which represented the ratio of cells in the specimen, were assumed as binomial- or beta-binomial-distributed with or without overdispersion, respectively.
The ANCOVA model, which is a blend of ANOVA and regression in the multiple linear model, was applied for assessment of Ca2+ treatment and mutation effects on the cells regarding Gaussian, gamma, beta, zero-inflated beta, binomial, and beta-binomial parameters in the manner of the GLM. The statistical model was defined as follows:
 |
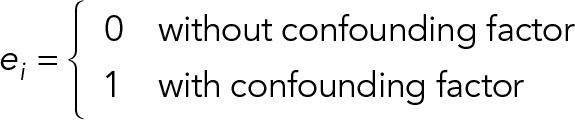 |
where η is the link function, yi is a response variable (parameter values), β0 is the intercept, β1 is a fixed effect of Ca2+ treatment, xi is a concentration of Ca2+ treatment as an explanatory variable for yi, β2 is a fixed effect of the cls mutation, di is an indicator of the mutation as an explanatory variable, β3 is a fixed effect of the Ca2+–cls interaction, of which the explanatory variable xi⋅di of the interaction term was defined as a product of xi and di in the linear model, β4 is a fixed effect of the confounding factor, ei is an indicator of the confounding factor as an explanatory variable, and εi is the error. The best model was selected from the combination of probability distributions and the linear models (e.g., zero-inflated beta vs. beta, binomial vs. beta-binomial, with or without cofounding factors) for each parameter based on the Akaike information criterion (AIC; Akaike, 1998). Likelihood ratio test for the interaction term was carried out to detect parameters with significant Ca2+–cls interactions among sets of cls mutants (p < 0.05). The models of probability distributions, corresponding link functions, and descriptions of analyzed parameters are listed in Supplemental Tables S4 and S5, respectively. The Z value, calculated by the Wald test for β1 of maximum likelihood estimation in each parameter, was used as a degree of Ca2+-induced morphological change of wild-type (his3Δ or YPH499) cells in this study (referred to as Zwt in the text and figures). The Z value, calculated by the Wald test for β3 of the maximum likelihood estimation in each cls mutant, was used as a degree of the Ca2+–cls interaction. The π score as a phenotypic interaction score was calculated as follows:
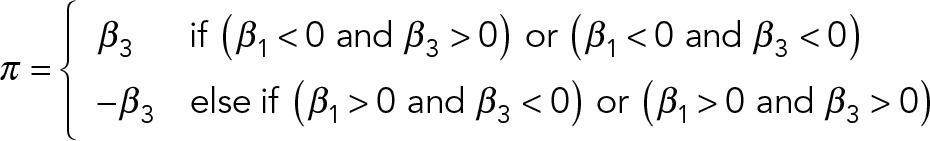 |
A linear model of dispersion in each parameter was selected from two models by AIC to detect interaction between cls mutation and Ca2+ treatment in Figure 5, where one of the models was a null model and the other was a linear combination of experimental conditions (each Ca2+ concentration in each strain). Of the 501 parameters, 247 were selected to have different dispersion among the experimental conditions by AIC. At p < 0.05 by likelihood ratio test, 245 of 501 parameters were detected to have significant interaction(s). Of the 245 parameters, 113 were detected to have significant Ca2+ effects on wild type at p < 0.05 by Wald test. Among 7006 assays (62 cls mutants × 113 parameters), 1612 combinations were detected to have significant interaction at p < 0.05 by Wald test as shown in Figure 5, where FDR was estimated as 0.24 by randomization with >2000 iterations.
PCA and hierarchical cluster analysis
To extract the independent morphological features, PCA was performed using morphological data of a null distribution (Ohnuki et al., 2012) with minor modification. The 209 Z values calculated from the parameter values of the 122 replicated wild-type data set (null-distributed data) were subjected to PCA based on the correlation matrix. First, 19 PCs reached 70% of the cumulative contribution ratio (CCR). Significantly correlated parameters with each PC (p < 0.01 after Bonferroni correction) were selected and are listed in Supplemental Figure S1.
A similar approach was performed for the identification of independent morphological features correlated with FK506 effects. The independent morphological features were extracted as previously described (Ohnuki et al., 2012). The alleviating and aggravating effects of FK506 on cell growth under conditions of high Ca2+ were particularly reflected in the first and second PCs (Supplemental Figure S7B). We found that 67 and 7 parameters were significantly correlated with PC1 and PC2, respectively, at >0.60 of the absolute value of loadings, which is equivalent to the correlation coefficient between the PC score and the π score (p < 5 × 10⁻⁷ after Bonferroni correction, Student’s t test). In the second PCA, the 67 and the 7 parameter values for PC1 and PC2, respectively, of the 122 replicated wild-type data set (null-distributed data) were used. Parameters with >0.70 of absolute value of the loadings for each PC were selected, and the parameters that correlated with the first five PCs (PC1a–e) and the first three PCs (PC2a–c) are listed in Supplemental Figure S8.
Hierarchical clustering analysis (HCA) for the 62 cls mutants was performed as previously described (Ohnuki et al., 2007), with minor modification. Briefly, to exclude correlation among the morphological parameters, PC scores of the Ca2+–cls interaction profiles were applied. HCA based on the dissimilarity defined by 1 − R (Pearson product–moment correlation coefficient) was applied to the 16 PC scores (80% of the CCR). Clusters were assessed using the R package pvclust tool at AU p > 0.95 (Suzuki and Shimodaira, 2006).
Quinacrine staining
For quinacrine labeling, exponentially growing cells were harvested by centrifugation and washed three times with 50 mM sodium phosphate buffer, pH 7.5, containing 2% glucose. Quinacrine was added at a final concentration of 500 μM in 50 mM sodium phosphate buffer, pH 7.5, containing 2% glucose. After a 10-min incubation at 25°C, the cells were collected by centrifugation, washed three times with YPD, pH 7.5, and examined by fluorescence microscopy with a blue filter.
In vivo [3H]palmitic acid labeling
Cells were collected in log phase, resuspended in YPD medium (1.0 A600 unit/ml), and labeled with 2.5 μCi of [3H]palmitic acid (American Radiolabeled Chemicals, St. Louis, MO) for 90 min at 30°C. Cells were collected by centrifugation and suspended in extraction buffer (ethanol, water, diethyl ether, pyridine, and 15 N ammonia [15:15:5:1:0.018, vol/vol]). After 15-min incubation at 60°C, extracted lipids were separated from cell debris by 2-min centrifugation at 2000 × g. Lipids in the cell debris were reextracted using extraction buffer. Radioactivity of the lipid solution was measured, and samples of equal radioactivity were used for further analysis. Each lipid solution was alkali treated by incubating with 0.2× volume of 0.5 N NaOH in methanol for 40 min at 37°C and then neutralized with acetic acid. Lipids were dried and suspended in 100 μl of water-saturated butanol. Then 50 μl of water was added, vigorously mixed, and separated into two phases by centrifugation at 9000 × g for 1 min. The butanol phase was collected, and lipids in the water phase were reextracted by adding 100 μl of water-saturated butanol. The two butanol phases were pooled together, dried, and suspended in 20 μl of chloroform/methanol/water (5:4:1 [vol/vol]). Lipids were separated by TLC on Silica Gel 60 high-performance TLC plates (Merck, Whitestation, NJ) with chloroform, methanol, and 4.2 N ammonia (9:7:2 [vol/vol]) as the solvent system.
NADP+ measurement
Cells were grown in YPD to log phase, and each culture of ∼108 cells was sampled. Harvested cells were washed with ice-cold PBS and PBS plus 0.01% Triton X-100 and subjected to extraction and detection with Fluoro NADP+/NADPH (Cell Technology, Fremont, CA) according to the manufacturer’s instructions, with minor modification. Cells were disrupted with glass beads in lysis buffer and heated at 60°C for 30 min and cooled on ice. Fluorescence was measured at the excitation and emission wavelengths of 540 and 590 nm, respectively, with a Shimadzu RF-5300PC spectrofluorometer.
Supplementary Material
Acknowledgments
We thank members of the Laboratory of Signal Transduction for helpful discussions. This work was supported by Grants-in-Aid for Scientific Research from the Ministry of Education, Culture, Sports, Sciences and Technology, Japan (15H04402 to Y.O.), and a research fund from Operando-OIL (to Y.O.).
Abbreviations used:
- AIC
Akaike information criterion
- AU p
approximately unbiased probability value
- CCR
cumulative contribution ratio
- CLS
calcium-sensitive
- CORVET
class C core vacuole/endosome tethering
- C-VPS
class C vacuolar protein sorting
- FDR
false discovery rate
- GLM
generalized linear model
- HACS
high-affinity Ca2+ influx system
- HCA
hierarchical clustering analysis
- HOPS
homotypic fusion and protein sorting
- MIPC
mannosylinositol phosphorylceramide
- PCA
principal component analysis
- V-ATPase
vacuolar proton-translocating ATPase
- YPD
yeast extract/polypeptone/dextrose
Footnotes
This article was published online ahead of print in MBoC in Press (http://www.molbiolcell.org/cgi/doi/10.1091/mbc.E17-04-0216) on May 31, 2017.
REFERENCES
- Abràmoff MD, Magalhães PJ, Ram SJ. Image processing with ImageJ. Biophotonics Int. 2004;11:36–42. [Google Scholar]
- Akaike H. In: Selected Papers of Hirotugu Akaike. New York: Springer; 1998. Information theory and an extension of the maximum likelihood principle; pp. 199–213. [Google Scholar]
- Bachhawat AK, Manolson MF, Murdock DG, Garman JD, Jones EW. The VPH2 gene encodes a 25 kDa protein required for activity of the yeast vacuolar H+-ATPase. Yeast. 1993;9:175–184. doi: 10.1002/yea.320090208. [DOI] [PubMed] [Google Scholar]
- Balderhaar HJ, Ungermann C. CORVET and HOPS tethering complexes–coordinators of endosome and lysosome fusion. J Cell Sci. 2013;126:1307–1316. doi: 10.1242/jcs.107805. [DOI] [PubMed] [Google Scholar]
- Baryshnikova A, Costanzo M, Myers CL, Andrews B, Boone C. Genetic interaction networks: toward an understanding of heritability. Annu Rev Genomics Hum Genet. 2013;14:111–133. doi: 10.1146/annurev-genom-082509-141730. [DOI] [PubMed] [Google Scholar]
- Beeler T, Gable K, Zhao C, Dunn T. A novel protein, CSG2p, is required for Ca2+ regulation in Saccharomyces cerevisiae. J Biol Chem. 1994;269:7279–7284. [PubMed] [Google Scholar]
- Ben-Aroya S, Coombes C, Kwok T, O’Donnell KA, Boeke JD, Hieter P. Toward a comprehensive temperature-sensitive mutant repository of the essential genes of Saccharomyces cerevisiae. Mol Cell. 2008;30:248–258. doi: 10.1016/j.molcel.2008.02.021. [DOI] [PMC free article] [PubMed] [Google Scholar]
- Chang Y, Schlenstedt G, Flockerzi V, Beck A. Properties of the intracellular transient receptor potential (TRP) channel in yeast, Yvc1. FEBS Lett. 2010;584:2028–2032. doi: 10.1016/j.febslet.2009.12.035. [DOI] [PubMed] [Google Scholar]
- Costanzo M, Baryshnikova A, Bellay J, Kim Y, Spear ED, Sevier CS, Ding H, Koh JL, Toufighi K, Mostafavi S. The genetic landscape of a cell. Science. 2010;327:425–431. doi: 10.1126/science.1180823. [DOI] [PMC free article] [PubMed] [Google Scholar]
- Costanzo M, VanderSluis B, Koch EN, Baryshnikova A, Pons C, Tan G, Wang W, Usaj M, Hanchard J, Lee SD. A global genetic interaction network maps a wiring diagram of cellular function. Science. 2016;353:aaf1420. doi: 10.1126/science.aaf1420. [DOI] [PMC free article] [PubMed] [Google Scholar]
- Cui J, Kaandorp JA. Mathematical modeling of calcium homeostasis in yeast cells. Cell Calcium. 2006;39:337–348. doi: 10.1016/j.ceca.2005.12.001. [DOI] [PubMed] [Google Scholar]
- Cui J, Kaandorp JA, Ositelu OO, Beaudry V, Knight A, Nanfack YF, Cunningham KW. Simulating calcium influx and free calcium concentrations in yeast. Cell Calcium. 2009;45:123–132. doi: 10.1016/j.ceca.2008.07.005. [DOI] [PMC free article] [PubMed] [Google Scholar]
- Cunningham KW. Acidic calcium stores of Saccharomyces cerevisiae. Cell Calcium. 2011;50:129–138. doi: 10.1016/j.ceca.2011.01.010. [DOI] [PMC free article] [PubMed] [Google Scholar]
- Cunningham KW, Fink GR. Calcineurin-dependent growth control in Saccharomyces cerevisiae mutants lacking PMC1, a homolog of plasma membrane Ca2+ ATPases. J Cell Biol. 1994;124:351–363. doi: 10.1083/jcb.124.3.351. [DOI] [PMC free article] [PubMed] [Google Scholar]
- Cunningham KW, Fink GR. Calcineurin inhibits VCX1-dependent H+/Ca2+ exchange and induces Ca2+ ATPases in Saccharomyces cerevisiae. Mol Cell Biol. 1996;16:2226–2237. doi: 10.1128/mcb.16.5.2226. [DOI] [PMC free article] [PubMed] [Google Scholar]
- Cyert MS. Calcineurin signaling in Saccharomyces cerevisiae: how yeast go crazy in response to stress. Biochem Biophys Res Commun. 2003;311:1143–1150. doi: 10.1016/s0006-291x(03)01552-3. [DOI] [PubMed] [Google Scholar]
- Cyert MS, Philpott CC. Regulation of cation balance in Saccharomyces cerevisiae. Genetics. 2013;193:677–713. doi: 10.1534/genetics.112.147207. [DOI] [PMC free article] [PubMed] [Google Scholar]
- Demaurex N, Frieden M. Measurements of the free luminal ER Ca2+ concentration with targeted “cameleon” fluorescent proteins. Cell Calcium. 2003;34:109–119. doi: 10.1016/s0143-4160(03)00081-2. [DOI] [PubMed] [Google Scholar]
- Denis V, Cyert MS. Internal Ca2+ release in yeast is triggered by hypertonic shock and mediated by a TRP channel homologue. J Cell Biol. 2002;156:29–34. doi: 10.1083/jcb.200111004. [DOI] [PMC free article] [PubMed] [Google Scholar]
- Dixon SJ, Costanzo M, Baryshnikova A, Andrews B, Boone C. Systematic mapping of genetic interaction networks. Annu Rev Gene. 2009;43:601–625. doi: 10.1146/annurev.genet.39.073003.114751. [DOI] [PubMed] [Google Scholar]
- Dunn T, Gable K, Beeler T. Regulation of cellular Ca2+ by yeast vacuoles. J Biol Chem. 1994;269:7273–7278. [PubMed] [Google Scholar]
- Eilam Y. Studies on calcium efflux in the yeast Saccharomyces cerevisiae. Microbios. 1981;35:99–110. [PubMed] [Google Scholar]
- Eilam Y, Lavi H, Grossowicz N. Cytoplasmic Ca2+ homeostasis maintained by a vacuolar Ca2+ transport system in the yeast Saccharomyces cerevisiae. Microbiology. 1985;131:623–629. doi: 10.1099/00221287-131-10-2555. [DOI] [PubMed] [Google Scholar]
- Fischer M, Schnell N, Chattaway J, Davies P, Dixon G, Sanders D. The Saccharomyces cerevisiae CCH1 gene is involved in calcium influx and mating. FEBS Lett. 1997;419:259–262. doi: 10.1016/s0014-5793(97)01466-x. [DOI] [PubMed] [Google Scholar]
- Förster C, Kane PM. Cytosolic Ca2+ homeostasis is a constitutive function of the V-ATPase in Saccharomyces cerevisiae. J Biol Chem. 2000;275:38245–38253. doi: 10.1074/jbc.M006650200. [DOI] [PubMed] [Google Scholar]
- García-Ramírez JJ, Santos MA, Revuelta JL. The Saccharomyces cerevisiae RIB4 gene codes for 6, 7-dimethyl-8-ribityllumazine synthase involved in riboflavin biosynthesis molecular characterization of the gene and purification of the encoded protein. J Biol Chem. 1995;270:23801–23807. doi: 10.1074/jbc.270.40.23801. [DOI] [PubMed] [Google Scholar]
- Halachmi D, Eilam Y. Calcium homeostasis in yeast cells exposed to high concentrations of calcium. Roles of vacuolar H+-ATPase and cellular ATP. FEBS Lett. 1993;316:73–78. doi: 10.1016/0014-5793(93)81739-m. [DOI] [PubMed] [Google Scholar]
- Heitman J, Movva NR, Hiestand PC, Hall MN. FK 506-binding protein proline rotamase is a target for the immunosuppressive agent FK 506 in Saccharomyces cerevisiae. Proc Natl Acad Sci USA. 1991;88:1948–1952. doi: 10.1073/pnas.88.5.1948. [DOI] [PMC free article] [PubMed] [Google Scholar]
- Hirata R, Umemoto N, Ho M, Ohya Y, Stevens T, Anraku Y. VMA12 is essential for assembly of the vacuolar H(+)-ATPase subunits onto the vacuolar membrane in Saccharomyces cerevisiae. J Biol Chem. 1993;268:961–967. [PubMed] [Google Scholar]
- Ho MN, Hirata R, Umemoto N, Ohya Y, Takatsuki A, Stevens T, Anraku Y. VMA13 encodes a 54-kDa vacuolar H(+)-ATPase subunit required for activity but not assembly of the enzyme complex in Saccharomyces cerevisiae. J Biol Chem. 1993;268:18286–18292. [PubMed] [Google Scholar]
- Iida H, Nakamura H, Ono T, Okumura MS, Anraku Y. MID1, a novel Saccharomyces cerevisiae gene encoding a plasma membrane protein, is required for Ca2+ influx and mating. Mol Cell Biol. 1994;14:8259–8271. doi: 10.1128/mcb.14.12.8259. [DOI] [PMC free article] [PubMed] [Google Scholar]
- Jin K, Li J, Vizeacoumar FS, Li Z, Min R, Zamparo L, Vizeacoumar FJ, Datti A, Andrews B, Boone C. PhenoM: a database of morphological phenotypes caused by mutation of essential genes in Saccharomyces cerevisiae. Nucleic Acids Res. 2011:D687–D694. doi: 10.1093/nar/gkr827. [DOI] [PMC free article] [PubMed] [Google Scholar]
- Jonikas MC, Collins SR, Denic V, Oh E, Quan EM, Schmid V, Weibezahn J, Schwappach B, Walter P, Weissman JS. Comprehensive characterization of genes required for protein folding in the endoplasmic reticulum. Science. 2009;323:1693–1697. doi: 10.1126/science.1167983. [DOI] [PMC free article] [PubMed] [Google Scholar]
- Kane PM. The where, when, and how of organelle acidification by the yeast vacuolar H-ATPase. Microbiol Mol Biol Rev. 2006;70:177–191. doi: 10.1128/MMBR.70.1.177-191.2006. [DOI] [PMC free article] [PubMed] [Google Scholar]
- Kwok EY, Severance S, Kosman DJ. Evidence for iron channeling in the Fet3p−Ftr1p high-affinity iron uptake complex in the yeast plasma membrane. Biochemistry. 2006;45:6317–6327. doi: 10.1021/bi052173c. [DOI] [PubMed] [Google Scholar]
- Levy SF, Siegal ML. Network hubs buffer environmental variation in Saccharomyces cerevisiae. PLoS Biol. 2008;6:e264. doi: 10.1371/journal.pbio.0060264. [DOI] [PMC free article] [PubMed] [Google Scholar]
- Li Z, Vizeacoumar FJ, Bahr S, Li J, Warringer J, Vizeacoumar FS, Min R, VanderSluis B, Bellay J, DeVit M. Systematic exploration of essential yeast gene function with temperature-sensitive mutants. Nat Biotechnol. 2011;29:361–367. doi: 10.1038/nbt.1832. [DOI] [PMC free article] [PubMed] [Google Scholar]
- Longtine MS, McKenzie A, Demarini DJ, Shah NG, Wach A, Brachat A, Philippsen P, Pringle JR. Additional modules for versatile and economical PCR-based gene deletion and modification in Saccharomyces cerevisiae. Yeast. 1998;14:953–961. doi: 10.1002/(SICI)1097-0061(199807)14:10<953::AID-YEA293>3.0.CO;2-U. [DOI] [PubMed] [Google Scholar]
- Mani R, Onge RPS, Hartman JL, Giaever G, Roth FP. Defining genetic interaction. Proc Natl Acad Sci USA. 2008;105:3461–3466. doi: 10.1073/pnas.0712255105. [DOI] [PMC free article] [PubMed] [Google Scholar]
- Martin DC, Kim H, Mackin NA, Maldonado-Báez L, Evangelista CC, Beaudry VG, Dudgeon DD, Naiman DQ, Erdman SE, Cunningham KW. New regulators of a high affinity Ca2+ influx system revealed through a genome-wide screen in yeast. J Biol Chem. 2011;286:10744–10754. doi: 10.1074/jbc.M110.177451. [DOI] [PMC free article] [PubMed] [Google Scholar]
- McNeil J, McIntosh EM, Taylor B, Zhang F-R, Tang S, Bognar A. Cloning and molecular characterization of three genes, including two genes encoding serine hydroxymethyltransferases, whose inactivation is required to render yeast auxotrophic for glycine. J Biol Chem. 1994;269:9155–9165. [PubMed] [Google Scholar]
- Missiaen L, Robberecht W, Van Den Bosch L, Callewaert G, Parys J, Wuytack F, Raeymaekers L, Nilius B, Eggermont J, De Smedt H. Abnormal intracellular Ca2+ homeostasis and disease. Cell Calcium. 2000;28:1–21. doi: 10.1054/ceca.2000.0131. [DOI] [PubMed] [Google Scholar]
- Mnaimneh S, Davierwala AP, Haynes J, Moffat J, Peng W-T, Zhang W, Yang X, Pootoolal J, Chua G, Lopez A. Exploration of essential gene functions via titratable promoter alleles. Cell. 2004;118:31–44. doi: 10.1016/j.cell.2004.06.013. [DOI] [PubMed] [Google Scholar]
- Monschau N, Sahm H, Stahmann K-P. Threonine aldolase overexpression plus threonine supplementation enhanced riboflavin production in Ashbya gossypii. Appl Environ Microbiol. 1998;64:4283–4290. doi: 10.1128/aem.64.11.4283-4290.1998. [DOI] [PMC free article] [PubMed] [Google Scholar]
- Nelder J, Wedderburn R. Generalized linear models. J R Stat Soc Ser A. 1972;135:370–384. [Google Scholar]
- Ohnuki S, Kobayashi T, Ogawa H, Kozone I, Ueda J-y, Takagi M, Shin-ya K, Hirata D, Nogami S, Ohya Y. Analysis of the biological activity of a novel 24-membered macrolide JBIR-19 in Saccharomyces cerevisiae by the morphological imaging program CalMorph. FEMS Yeast Res. 2012;12:293–304. doi: 10.1111/j.1567-1364.2011.00770.x. [DOI] [PubMed] [Google Scholar]
- Ohnuki S, Nogami S, Kanai H, Hirata D, Nakatani Y, Morishita S, Ohya Y. Diversity of Ca2+-induced morphology revealed by morphological phenotyping of Ca2+-sensitive mutants of Saccharomyces cerevisiae. Eukaryot Cell. 2007;6:817–830. doi: 10.1128/EC.00012-07. [DOI] [PMC free article] [PubMed] [Google Scholar]
- Ohtani M, Saka A, Sano F, Ohya Y, Morishita S. Development of image processing program for yeast cell morphology. J Bioinform Comput Biol. 2004;1:695–709. doi: 10.1142/s0219720004000363. [DOI] [PubMed] [Google Scholar]
- Ohya Y, Miyamoto S, Ohsumi Y, Anraku Y. Calcium-sensitive cls4 mutant of Saccharomyces cerevisiae with a defect in bud formation. J Bacteriol. 1986a;165:28–33. doi: 10.1128/jb.165.1.28-33.1986. [DOI] [PMC free article] [PubMed] [Google Scholar]
- Ohya Y, Ohsumi Y, Anraku Y. Isolation and characterization of Ca2+-sensitive mutants of Saccharomyces cerevisiae. Microbiology. 1986b;132:979–988. doi: 10.1099/00221287-132-4-979. [DOI] [PubMed] [Google Scholar]
- Ohya Y, Sese J, Yukawa M, Sano F, Nakatani Y, Saito TL, Saka A, Fukuda T, Ishihara S, Oka S. High-dimensional and large-scale phenotyping of yeast mutants. Proc Natl Acad Sci USA. 2005;102:19015–19020. doi: 10.1073/pnas.0509436102. [DOI] [PMC free article] [PubMed] [Google Scholar]
- Ohya Y, Umemoto N, Tanida I, Ohta A, Iida H, Anraku Y. Calcium-sensitive cls mutants of Saccharomyces cerevisiae showing a Pet-phenotype are ascribable to defects of vacuolar membrane H(+)-ATPase activity. J Biol Chem. 1991;266:13971–13977. [PubMed] [Google Scholar]
- Oltmanns O, Bacher A. Biosynthesis of riboflavine in Saccharomyces cerevisiae: the role of genes rib1 and rib7. J Bacteriol. 1972;110:818–822. doi: 10.1128/jb.110.3.818-822.1972. [DOI] [PMC free article] [PubMed] [Google Scholar]
- Pan X, Ye P, Yuan DS, Wang X, Bader JS, Boeke JD. A DNA integrity network in the yeast Saccharomyces cerevisiae. Cell. 2006;124:1069–1081. doi: 10.1016/j.cell.2005.12.036. [DOI] [PubMed] [Google Scholar]
- Pittman JK, Cheng NH, Shigaki T, Kunta M, Hirschi KD. Functional dependence on calcineurin by variants of the Saccharomyces cerevisiae vacuolar Ca2+/H+ exchanger Vcx1p. Mol Microbiol. 2004;54:1104–1116. doi: 10.1111/j.1365-2958.2004.04332.x. [DOI] [PubMed] [Google Scholar]
- Pozos TC, Sekler I, Cyert MS. The product of HUM1, a novel yeast gene, is required for vacuolar Ca2+/H+ exchange and is related to mammalian Na+/Ca2+ exchangers. Mol Cell Biol. 1996;16:3730–3741. doi: 10.1128/mcb.16.7.3730. [DOI] [PMC free article] [PubMed] [Google Scholar]
- Sambade M, Alba M, Smardon AM, West RW, Kane PM. A genomic screen for yeast vacuolar membrane ATPase mutants. Genetics. 2005;170:1539–1551. doi: 10.1534/genetics.105.042812. [DOI] [PMC free article] [PubMed] [Google Scholar]
- Schuldiner M, Collins SR, Thompson NJ, Denic V, Bhamidipati A, Punna T, Ihmels J, Andrews B, Boone C, Greenblatt JF. Exploration of the function and organization of the yeast early secretory pathway through an epistatic miniarray profile. Cell. 2005;123:507–519. doi: 10.1016/j.cell.2005.08.031. [DOI] [PubMed] [Google Scholar]
- Shimodaira H. An approximately unbiased test of phylogenetic tree selection. Syst Biol. 2002;51:492–508. doi: 10.1080/10635150290069913. [DOI] [PubMed] [Google Scholar]
- Stathopoulos AM, Cyert MS. Calcineurin acts through the CRZ1/TCN1-encoded transcription factor to regulate gene expression in yeast. Genes Dev. 1997;11:3432–3444. doi: 10.1101/gad.11.24.3432. [DOI] [PMC free article] [PubMed] [Google Scholar]
- Suzuki R, Shimodaira H. Pvclust: an R package for assessing the uncertainty in hierarchical clustering. Bioinformatics. 2006;22:1540–1542. doi: 10.1093/bioinformatics/btl117. [DOI] [PubMed] [Google Scholar]
- Takita Y, Ohya Y, Anraku Y. The CLS2 gene encodes a protein with multiple membrane-spanning domains that is important Ca2+ tolerance in yeast. Mol Gen Genet. 1995;246:269–281. doi: 10.1007/BF00288599. [DOI] [PubMed] [Google Scholar]
- Tanida I, Hasegawa A, Iida H, Ohya Y, Anraku Y. Cooperation of calcineurin and vacuolar H+-ATPase in intracellular Ca2+ homeostasis of yeast cells. J Biol Chem. 1995;270:10113–10119. doi: 10.1074/jbc.270.17.10113. [DOI] [PubMed] [Google Scholar]
- Tanida I, Takita Y, Hasegawa A, Ohya Y, Anraku Y. Yeast Cls2p/Csg2p localized on the endoplasmic reticulum membrane regulates a non-exchangeable intracellular Ca2+ pool cooperatively with calcineurin. FEBS Lett. 1996;379:38–42. doi: 10.1016/0014-5793(95)01478-0. [DOI] [PubMed] [Google Scholar]
- Tong AHY, Lesage G, Bader GD, Ding H, Xu H, Xin X, Young J, Berriz GF, Brost RL, Chang M. Global mapping of the yeast genetic interaction network. Science. 2004;303:808–813. doi: 10.1126/science.1091317. [DOI] [PubMed] [Google Scholar]
- Uemura S, Kihara A, Inokuchi J-I, Igarashi Y. Csg1p and newly identified Csh1p function in mannosylinositol phosphorylceramide synthesis by interacting with Csg2p. J Biol Chem. 2003;278:45049–45055. doi: 10.1074/jbc.M305498200. [DOI] [PubMed] [Google Scholar]
- Umemoto N, Ohya Y, Anraku Y. VMA11, a novel gene that encodes a putative proteolipid, is indispensable for expression of yeast vacuolar membrane H(+)-ATPase activity. J Biol Chem. 1991;266:24526–24532. [PubMed] [Google Scholar]
- Wada Y, Ohsumi Y, Anraku Y. Genes for directing vacuolar morphogenesis in Saccharomyces cerevisiae. I. Isolation and characterization of two classes of vam mutants. J Biol Chem. 1992;267:18665–18670. [PubMed] [Google Scholar]
- Williams RJ. Calcium: the developing role of its chemistry in biological evolution. In: Carafoli E, Klee C, editors. Calcium as a Cellular Regulator. Oxford, UK: Oxford University Press; 1999. pp. 3–27. [Google Scholar]
- Winzeler EA, Shoemaker DD, Astromoff A, Liang H, Anderson K, Andre B, Bangham R, Benito R, Boeke JD, Bussey H. Functional characterization of the S. cerevisiae genome by gene deletion and parallel analysis. Science. 1999;285:901–906. doi: 10.1126/science.285.5429.901. [DOI] [PubMed] [Google Scholar]
- Xu H, Wickner W. Bem1p is a positive regulator of the homotypic fusion of yeast vacuoles. J Biol Chem. 2006;281:27158–27166. doi: 10.1074/jbc.M605592200. [DOI] [PubMed] [Google Scholar]
- Yang M, Ohnuki S, Ohya Y. Unveiling nonessential gene deletions that confer significant morphological phenotypes beyond natural yeast strains. BMC Genomics. 2014;15:932. doi: 10.1186/1471-2164-15-932. [DOI] [PMC free article] [PubMed] [Google Scholar]
- Yoshida M, Ohnuki S, Yashiroda Y, Ohya Y. Profilin is required for Ca2+ homeostasis and Ca2+-modulated bud formation in yeast. Mol Genet Genomics. 2013;288:317–328. doi: 10.1007/s00438-013-0752-x. [DOI] [PubMed] [Google Scholar]
- Yoshimoto H, Saltsman K, Gasch AP, Li HX, Ogawa N, Botstein D, Brown PO, Cyert MS. Genome-wide analysis of gene expression regulated by the calcineurin/Crz1p signaling pathway in Saccharomyces cerevisiae. J Biol Chem. 2002;277:31079–31088. doi: 10.1074/jbc.M202718200. [DOI] [PubMed] [Google Scholar]
- Yu Y, Jiang YW, Wellinger RJ, Carlson K, Roberts JM, Stillman DJ. Mutations in the homologous ZDS1 and ZDS2 genes affect cell cycle progression. Mol Cell Biol. 1996;16:5254–5263. doi: 10.1128/mcb.16.10.5254. [DOI] [PMC free article] [PubMed] [Google Scholar]
- Yvert G, Ohnuki S, Nogami S, Imanaga Y, Fehrmann S, Schacherer J, Ohya Y. Single-cell phenomics reveals intra-species variation of phenotypic noise in yeast. BMC Syst Biol. 2013;7:54. doi: 10.1186/1752-0509-7-54. [DOI] [PMC free article] [PubMed] [Google Scholar]
- Zhao Y, Du J, Zhao G, Jiang L. Activation of calcineurin is mainly responsible for the calcium sensitivity of gene deletion mutations in the genome of budding yeast. Genomics. 2013;101:49–56. doi: 10.1016/j.ygeno.2012.09.005. [DOI] [PubMed] [Google Scholar]
Associated Data
This section collects any data citations, data availability statements, or supplementary materials included in this article.