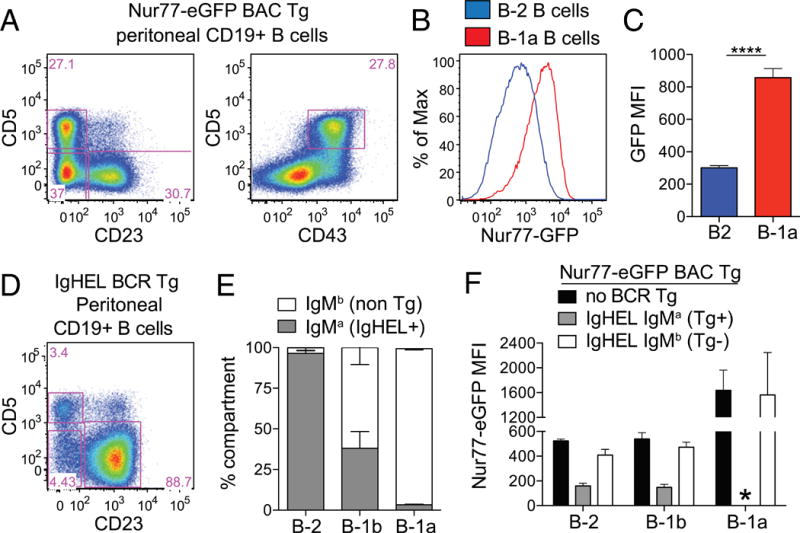
FIGURE 1. Nur77-eGFP reporter expression is upregulated in B1-a B cells in an Ag-dependent manner.

(A) PerC cells were stained to detect B cell subsets. Representative plots of CD19+ cells show gating to identify B-1a (CD5+ CD23− CD43+), B-1b (CD23− CD5−), and B-2 (CD23+ CD5−) cells. (B) PerC cells from Nur77-eGFP reporter mice were stained and gated as in (A). Representative graph depicts GFP fluorescence in B-1a and B-2 cells. (C) Bar graph depicts GFP mean fluorescence intensity (MFI) (± SEM) from cells, as gated in (A) and (B), in n = 5 biological replicates. ****p < 0.0001, unpaired t test. (D) PerC cells from IgHEL Tg Nur77-eGFP reporter mice were stained and gated as in (A) to identify B-1a, B-1b, and B-2 cells. (E) B cell subsets, gated as in (D), were further subdivided on the basis of IgMa expression to identify BCR-Tg+ cells (gated as in Supplemental Fig. 1A). Bar graph depicts the percentage (± SEM) of IgMa cells within each B cell subset in n = 3 biological replicates. (F) Nur77-eGFP mice, with or without IgHEL Tg, were stained and gated as in (D) and (E) to identify Tg+ and Tg− cells from each PerC B cell compartment. Bar graph depicts GFP MFI (± SEM) in n = 3 biological replicates. *No data because there are no IgMa B-1a cells detected in IgHEL Tg mice, as shown in (E).
