Abstract
Hepatic inflammation is a key pathologic feature of nonalcoholic steatohepatitis (NASH). Natural killer T (NKT) cells and clusters of differentiation (CD)8+ T‐cells are known to play an important role in obesity‐related adipose tissue inflammation. We hypothesized that these same inflammatory phenotypes would be present in progressive NASH. We used a previously established high‐fat high‐carbohydrate (HFHC) murine obesogenic diet model of progressive NASH to investigate the role of NKT cells and CD8+ T‐cells in C57Bl6/J mice. To better understand the impact of these cell populations, CD1d‐deficient and CD8+ T‐cell‐depleted mice were subjected to an HFHC diet for 16 weeks. C57Bl6/J mice fed an HFHC diet had increased body weight, liver triglyceride content, serum alanine aminotransferase levels, and increased NKT‐cell and CD8+ T‐cell infiltration in the liver. In addition, human liver sections from patients with NASH showed increased CD8+ T‐cells. In comparison, CD1d‐deficient and CD8 T‐cell‐depleted mice fed an HFHC diet had a lower hepatic triglyceride content, lower alanine aminotransferase levels, lower activated resident macrophages and infiltrating macrophages, improved nonalcoholic fatty liver disease activity scores, and reduced α‐smooth muscle actin, collagen type 1 alpha 1, and collagen type 1 alpha 2 messenger RNA expression. Further, while CD1d‐deficient mice were protected against weight gain on the HFHC diet, CD8 T‐cell‐depleted mice gained weight on the HFHC diet. Conclusion: We found that NASH has an immunological signature that includes hepatic infiltrating NKT and CD8+ T‐cells. Depletion of these cells resulted in reduced NASH progression and thus presents novel therapeutic avenues for the treatment of NASH. (Hepatology Communications 2017;1:299–310)
Abbreviations
- α‐SMA
α‐smooth muscle actin
- ALT
alanine aminotransferase
- CD
cluster of differentiation
- Cd1dKO
cluster of differentiation 1d knockout
- CD8a mAb
anti‐CD8a monoclonal antibody
- Col1a1
collagen type 1 alpha 1
- Col1a2
collagen type 1 alpha 2
- HFHC
high‐fat high‐carbohydrate
- IP‐10
interferon gamma‐induced protein 10
- mAb
monoclonal antibody
- NAFLD
nonalcoholic fatty liver disease
- NAS
NAFLD activity score
- NASH
nonalcoholic steatohepatitis
- NKT
natural killer T
- TG
triglyceride
- WT
wild type
Introduction
Our current Western lifestyle is a risk factor for development of obesity, type 2 diabetes, and fatty liver disease, all of which are major health concerns. Some patients with fatty liver disease will progress to develop nonalcoholic steatohepatitis (NASH), which includes chronic liver inflammation and fibrosis that may eventually lead to cirrhosis. Over the past several decades in North America, the number of adults and children with fatty liver disease has increased exponentially.1 However, it is still not completely understood how dietary‐induced metabolic changes contribute to hepatic inflammation. This necessitates closer study of the role of inflammation in the progression of fatty liver disease to NASH.2
Murine models consuming high‐fat and high‐carbohydrate (HFHC) diets can reproduce the complete picture of obesity, inflammation, insulin resistance, increased plasma triglycerides (TGs), hyperglycemia, and other metabolic disorders, including NASH.3, 4 Earlier studies have shown that lipotoxic hepatocyte injury plays the key role in recruiting intrahepatic and extrahepatic antigen presentation cells, neutrophils, and lymphocytes to the steatotic liver. The subset of immune cells that are primarily responsible for NASH progression is still largely unknown. We have previously shown that activated macrophages and interleukin‐17 are increased in the murine model of NASH.5 Recently, the role and abundance of clusters of differentiation (CD)8+ T‐cells were highlighted when depletion of CD8+ T‐cells was shown to result in decreased fibrosis in a high‐fructose diet murine NASH model.6 Natural killer T (NKT) cells, a bridge between the innate and adaptive immune system,7, 8 have also been reported to play a pivotal role in NASH progression.9 Specifically, hepatic accumulation of NKT cells has been shown in mice fed a methionine choline‐deficient diet to generate NASH.10 However, hepatic infiltration by NKT cells has not been evaluated in an obese NASH model, despite both CD8+ T and NKT cells being seen in obesity‐related adipose tissue inflammation.11, 12
In the present study, mice were fed an HFHC diet for 16 weeks to induce progressive NASH. We observed that livers of these mice had increased NKT cells and CD8+ T‐cell infiltration, while NKT‐cell‐deficient (CD1dKO) and CD8+ T‐cell‐depleted mice were protected against NASH progression. Furthermore, CD1dKO mice did not gain excessive weight, had lower plasma TGs and serum alanine aminotransferase (ALT) levels, exhibited reduced nonalcoholic fatty liver disease (NAFLD) activity score (NAS), lower activated resident macrophages and infiltrating macrophages in the liver, and had decreased α‐smooth muscle actin (α‐SMA), collagen type 1 alpha 1 (Col1a1), and collagen type 1 alpha 2 (Col1a2) messenger RNA expression. We further observed that depletion of CD8+ T‐cells leads to similar protection from NASH but not from body weight gain. These observations were further supported by the presence of infiltrating CD8+ T‐cells in the liver biopsies of patients with NASH. We conclude that infiltrating CD8+ T‐cells and NKT cells play a prominent role in NASH progression.
Materials and Methods
ANIMALS AND ANIMAL CARE
We used 6‐8‐week‐old male C57Bl6/J mice (Jackson Laboratory, Bar Harbor, ME) and CD1dKO mice, which were obtained by backcrossing CD1d null mice (generously provided by Prof. Mattner, Department of Microbiology, Universitätsklinikum Erlangen, Germany) with C57Bl6/J mice. Mice were housed in a 12‐hour light–dark cycle‐maintained temperature‐controlled (22°C ± 2°C) room. The control mice used in the experiments had the same genetic background. Animals were randomized (n = 3‐8 per group) to chow (Teklad‐Harlan, Madison, WI) or an HFHC diet (Surwit diet, 58 kcal percentage fat; Research Diets, New Brunswick, NJ) and drinking water with a high fructose (55% fructose by weight; Acros Organics, Morris Plains, NJ) and sucrose (45% sucrose by weight; Sigma‐Aldrich, St. Louis, MO) mixture at a concentration of 42 g/L.5 Animals were provided ad libitum access to diets for 16 weeks, and body weights and food intake were recorded on a weekly basis. All animal studies were approved by the Institutional Animal Care and Use Committee at Cincinnati Children's Hospital Medical Center, Cincinnati, OH.
CD8+ T‐CELL DEPLETION
We used a well‐established protocol13 to deplete CD8+ T‐cells in vivo. Briefly, C57Bl6/J mice fed an HFHC diet for 12 weeks were subjected to intraperitoneal injection of anti‐CD8 (clone 53‐6.72) monoclonal antibodies (mAbs) (200 mg/kg) every 3 days until 16 weeks of the HFHC diet. Isotype control‐group mice received immunoglobulin G2a antibodies at the same dose and time interval. Both CD8a mAb and isotype control antibody were procured from Bio X Cell (West Lebanon, NH).
HEPATIC TG AND SERUM ALT
Liver TG content was determined at 16 weeks post‐HFHC diet as described.14 Briefly, 100 mg of liver tissue was homogenized, and the enzymatic assay for TGs (Pointe Scientific, Canton, MI) was performed following the manufacturer's instructions. A microplate reader (BioTek, Winooski, VT) was used to determine the photometric absorbance at 500 nm. Serum collected at 16 weeks was used to measure ALT with the DiscretPak ALT Reagent Kit (Catachem, Bridgeport, CT). ALT enzyme kinetics were determined over a 5‐minute interval by measuring the photometric absorbance at 340 nm.
PLASMA INTERFERON GAMMA‐INDUCED PROTEIN 10 CONCENTRATION
Plasma was obtained from mice of the chow and HFHC diet‐fed groups at 16 weeks. The Mouse Magnetic Luminex Screening Assay kit for interferon gamma‐induced protein 10 (IP‐10; R&D Systems Inc., Minneapolis, MN) was used to determine the concentration of IP‐10 in the plasma, using the Luminex 100 platform (Luminex Corporation, Austin, TX) according to the manufacturer's instructions.
Col1a1, Col1a2, AND α‐SMA QUANTITATIVE REVERSE‐TRANSCRIPTASE POLYMERASE CHAIN REACTION
Frozen liver tissues were homogenized in a bead‐based tissue homogenizer (Fastprep24; MP Biomedicals, Santa Ana, CA) in TRIzol reagent (Molecular Research Center, Cincinnati, OH) to perform RNA extraction. Isolated RNA was treated with RNase‐Free DNase (Fisher Scientific, Pittsburgh, PA) and purified on an RNeasy Mini Spin Column (Qiagen, Valencia, CA). Complementary DNA was prepared using TaqMan Reverse Transcription reagents (Thermo Fisher Scientific Inc., Florence, KY) and Eppendorf Mastercycler (Eppendorf North America, Westbury, NY). A predesigned, validated, α‐SMA‐specific TaqMan probe (Invitrogen, Carlsbad, CA) was used to determine the relative expression of messenger RNA across the samples on a Stratagene Mx3005 multiplex quantitative polymerase chain reaction platform (Stratagene, La Jolla, CA) with carboxy‐X‐rhodamine as the calibrator dye. Relative expression was determined by the ΔΔCt method6 with ribosomal protein L18 as the housekeeping gene.
LIVER HISTOLOGY AND IMMUNOHISTOCHEMISTRY
Liver tissue was harvested from mice after 16 weeks of the HFHC diet, fixed in 10% formalin, and subjected to microtome sectioning to generate 5‐μm sections for histologic analyses. For detection of CD68‐positive and CD11b‐positive cells in the mice liver tissue, formalin‐fixed liver tissues from mice were subjected to microtome sectioning to generate 5‐μm sections for immunohistochemistry. For detection of CD8+ T‐cells and NKT cells in the liver biopsy of patients with NASH, formalin‐fixed liver tissues from 28 patients were subjected to microtome sectioning to generate 5‐μm sections for immunohistochemistry. Histology was read by a single independent pathologist blinded to the experimental design and treatment groups. Steatosis was graded (0‐3), lobular inflammation was scored (0‐3), and ballooning was rated (0‐2).15 Fibrosis was staged separately on a scale of 0‐4.15
FLOW CYTOMETRY
Liver tissue was obtained from mice 16 weeks post‐HFHC diet, and the tissue was dissociated to procure nonparenchymal cells, using the gentleMACS dissociator (Miltenyi Biotec, Bergisch Gladbach, Germany). Red blood cells were lysed with 1X lysis buffer (eBioscience, San Diego, CA), cells were counted, and 1 × 10⁶ cells were suspended in 50 μL fluorescence‐activated cell sorting buffer (phosphate‐buffered saline containing 4% fetal calf serum and 0.09% sodium azide) and incubated with Fc blocking reagent (anti‐mouse CD16/32 clone 93) (eBioscience). Cell‐surface staining using hepatic nonparenchymal cells was performed using the following antibodies: Peridinin Chlorophyll Protein Complex conjugated anti‐ CD3 (clone 17A2), Fluorescein isothiocyanate conjugated anti‐CD4 (clone GK1.5), Peridinin Chlorophyll Protein Complex conjugated anti‐CD8a (clone 53‐6.7), Allophycocyanin conjugated anti‐CD8a (clone 53‐6.7), Fluorescein isothiocyanate conjugated anti‐NK1.1 (clone PK136), Phycoerythrin conjugated anti‐CD69 (clone H1.2F3), and Allophycocyanin conjugated CD1d‐tetramer. All fluorochrome‐labeled antibodies were purchased from eBioscience, and CD1d‐tetramer was prepared by the National Institutes of Health Tetramer Facility (Emory University, Atlanta, GA). Data were acquired on a FacsCanto Flow Cytometer (BD Biosciences, San Jose, CA) and analyzed using FlowJo (FlowJo LLC, Ashland, OR).
STATISTICAL ANALYSIS
Statistical comparison between the experimental groups was performed using one‐way or two‐way analysis of variance and Bonferroni post‐hoc test. The Student t test was used to determine statistical comparison between the two experimental groups. A P value of <0.05 was considered statistically significant. Results are presented as mean ± SEM.
Results
HIGH‐FAT HIGH‐CARBOHYDRATE DIET INDUCES AN OBESE PHENOTYPE
The 6‐8‐week‐old C57Bl6/J/6J mice fed an HFHC diet for 16 weeks showed increased weight gain (28.12 ± 1.53 g HFHC wild type (WT) versus 10.01 ± 1.01 g Chow WT; Fig. 1A) and liver weight (2.44 ± 0.24 g HFHC WT versus 1.47 ± 0.02 g Chow WT; Fig. 1B). HFHC‐fed mice also had a higher calorie intake per day (15.50 ± 0.63 kCal HFHC WT versus 10.07 ± 0.38 kCal Chow WT; Fig. 1C). We observed increased liver TG content (2,354.05 ± 487.76 mg/dL g HFHC WT versus 312.80 ± 58.59 mg/dL Chow WT; Fig. 1D), plasma ALT levels (135.80 ± 24.28 U/L HFHC WT versus 52.67 ± 6.12 U/L Chow WT; Fig. 1E), and fasting glucose (176.30 ± 9.25 mg/dL HFHC WT versus 131.00 ± 5.72 mg/dL Chow WT; Fig. 1F) in the HFHC‐fed mice group. In summary, an HFHC diet induced an obesity phenotype in C57Bl6/J mice fed an HFHC diet for 16 weeks.
Figure 1.
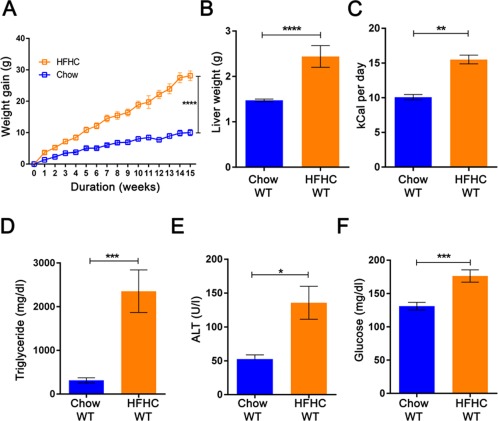
High‐fat high‐carbohydrate diet induces obesity phenotype in wild‐type mice. Mice (6‐8‐week‐old C57Bl6/J) fed with an HFHC diet show increased (A) body weight gain, (B) liver weight, (C) calorie intake per day, (D) liver TG, (E) serum ALT level, and (F) fasting glucose level in comparison to chow‐fed C57Bl6/J mice after 16 weeks of feeding. The vertical bars represent mean ± SEM. The Student t test was performed for each parameter in B‐F; two‐way analysis of variance with Bonferroni correction for A. ****P < 0.0001;***P < 0.001; **P < 0.01;*P < 0.05.
HFHC DIET INDUCES INFILTRATION OF NKT CELLS AND CD8+ T‐CELLS IN LIVER
The IP‐10 concentration in the serum of the HFHC group was higher in comparison to the chow‐fed group (200.82 ± 8.27 pg/mL HFHC WT versus 5.21 ± 1.80 pg/mL Chow WT; Fig. 2A). An increased abundance of activated NKT cells having the phenotype CD4+CD1dtetramer+CD69+ (1.26 × 10⁶ ± 0.22 × 10⁶ HFHC WT versus 0.49 × 10⁶ ± 0.17 × 10⁶ Chow WT; Fig. 2B) and activated CD8+ T‐cells (CD3+CD8+CD69+) (6.85 × 10⁴ ± 1.01 × 10⁴ HFHC WT versus 1.88 × 10⁴ ± 0.46 × 10⁴ Chow WT; Fig. 2C) was observed in comparison to the chow‐fed group. In summary, an HFHC diet induces CD8+ T‐cell and NKT‐cell hepatic infiltration in C57Bl6/J mice fed an HFHC diet for 16 weeks. To establish the clinical relevance of our murine findings, we performed immunohistochemistry for CD8+ T‐cells on the liver section of patients with histology‐proven NASH and observed infiltration by CD8+ T‐cells (representative images; Fig. 2D). We did not observe infiltration of NKT cells on the liver section of patients with histology‐proven NASH.
Figure 2.
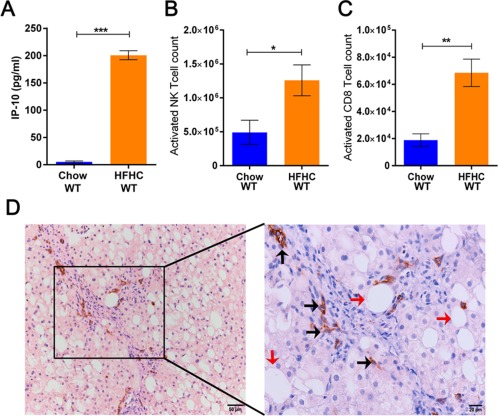
High‐fat high‐carbohydrate diet induces infiltration of activated NKT cells and CD8+ T‐cells in the liver cortex of wild‐type mice. (A) Increased plasma concentration of IP‐10 in mice on an HFHC diet. (B,C) Increased number of infiltrating NKT cells and CD8+ T‐cells, respectively, in the livers of mice on an HFHC diet. (D) Representative image (magnification ×200 and ×400) of the presence of infiltrating CD8+ T‐cells in the liver biopsies of a NASH patient (black arrow, infiltrating CD8+ T‐cells; red arrow, steatosis). The vertical bars represent mean ± SEM. The Student t test was performed for each parameter in A‐C. ****P < 0.0001; ***P < 0.001; **P < 0.01; *P < 0.05.
CD1dKO MICE ARE PROTECTED FROM OBESITY INDUCED BY AN HFHC DIET
We fed 6‐8‐week‐old CD1dKO mice an HFHC diet for 16 weeks. Unlike wild‐type mice, CD1dKO mice did not gain weight on an HFHC diet (11.25 ± 1.87 g HFHC CD1dKO versus 22.69 ± 1.72 g HFHC WT; Fig. 3A) despite similar daily food intake. The liver TG of CD1dKO mice fed an HFHC diet was lower in comparison to wild‐type mice fed the same diet (361.70 ± 53.95 mg/dL HFHC CD1dKO versus 1,212.00 ± 258.60 HFHC WT mg/dL; Fig. 3B). The serum ALT concentration in the HFHC‐fed CD1dKO mice was lower than that of HFHC wild‐type mice (57.11 ± 17.83 U/L HFHC CD1dKO versus 203.40 ± 65.93 U/L HFHC WT; Fig. 3C). The fasting glucose level was higher in the HFHC‐fed wild‐type mice compared to the HFHC‐fed CD1dKO mice (218.00 ± 12.85 mg/dL HFHC WT versus 136.30 ± 3.37 mg/dL HFHC CD1dKO; Fig. 3D). The gene expression of Col1a1 (138.19 ± 57.39 HFHC WT versus 20.85 ± 5.21 HFHC CD1dKO), Col1a2 (48.31 ± 15.90 HFHC WT versus 12.01 ± 1.75 HFHC CD1dKO), and α‐SMA (9.15 ± 2.60 HFHC WT versus 5.70 ± 1.78 HFHC CD1dKO) in the liver of HFHC diet‐fed wild‐type mice was also higher compared to HFHC‐fed CD1dKO mice (Fig. 3E). The hematoxylin and eosin‐stained liver sections showed increased steatosis in the HFHC diet‐fed wild‐type mice, while the other three groups (Chow wild‐type mice, HFHC CD1dKO, and Chow CD1dKO) had minimal or no steatosis (representative images; Fig. 4A). Similarly, increased fibrosis was observed in HFHC diet‐fed wild‐type mice by Masson's trichrome staining (representative images; Fig. 4B). We quantified inflammation and steatosis by using NAS and found that HFHC‐fed wild‐type mice had increased NAS (Table 1) (3.50 ± 0.46 HFHC WT; one‐way analysis of variance; Fig. 4C). We observed absolute absence of activated CD8 T‐cells in the livers of CD1dKO mice fed an HFHC diet (Fig. 4D). We further observed increased numbers of CD68‐positive cells in clusters in the liver of HFHC wild‐type mice in comparison to HFHC CD1dKO (Fig. 7C). We also observed a higher infiltration of CD11b‐positive cells in the liver of wild‐type HFHC mice compared to HFHC CD1dKO (Fig. 7A). CD11b cells did not form the big clusters formed by the CD68‐positive cells. The numbers of CD68‐positive macrophages (resident macrophages) were higher in the liver than the CD11b macrophages (infiltrating macrophages). We also observed the percentage abundance of F4/80‐positive macrophages and found that CD11b‐Gr1‐positive macrophages were lower in the liver of the HFHC CD1dKO mice group compared to the HFHC wild‐type mice group by flow cytometry (Supporting Fig. S1). From these data we conclude that the absence of NKT cells may decrease the abundance of both CD68‐positive macrophages and decrease the infiltration of CD11b‐positive macrophages in the liver of mice fed an HFHC diet. Thus, absence of functional NKT cells may provide protection from HFHC diet‐induced liver lipotoxicity.
Figure 3.
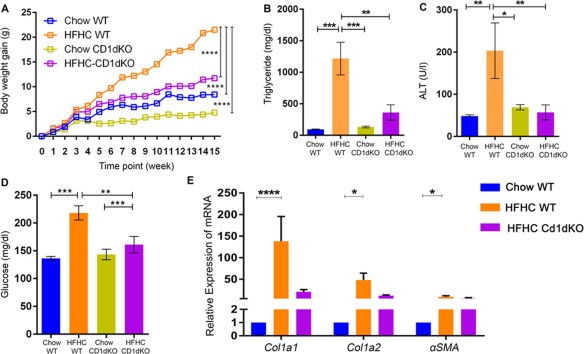
CD1dKO mice show resistance to HFHC diet‐induced obesity and liver steatosis. The HFHC‐fed CD1dKO mice show (A) lower body weight gain, (B) liver TG level, (C) serum ALT concentration, (D) fasting glucose level, and (E) hepatic α‐SMA expression, Col1a1, and Col1a2 in liver compared to HFHC‐fed wild‐type mice. The vertical bars represent mean ± SEM. Two‐way analysis of variance with Bonferroni correction for A; one‐way analysis of variance with Bonferroni correction for B‐E. ****P < 0.0001; ***P < 0.001; **P < 0.01; *P < 0.05.
Figure 4.
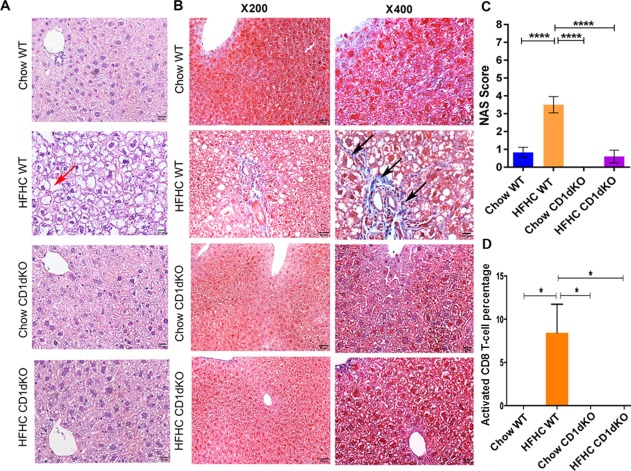
Histology of liver tissue, Masson's trichrome staining of liver tissue, and percentage abundance of activated CD8 T‐cells in the liver tissue for chow/HFHC‐fed CD1dKO and wild‐type mice. (A) Hematoxylin and eosin‐stained images (magnification ×400) of liver tissue of chow/HFHC‐fed wild‐type and CD1dKO mice. Liver tissue of the HFHC‐fed wild‐type mice shows vacuolated hepatocytes (red arrow). (B) Masson's trichrome staining images (magnification ×200 and ×400) of liver tissue of chow/HFHC‐fed wild‐type and CD1dKO mice. Liver tissue of HFHC‐fed wild‐type mice showed deposition of collagen (black arrows). (C) Graphical depiction of NAS among the chow/HFHC‐fed wild‐type and CD1dKO mice. (D) Higher percentage of activated CD8 T‐cells in the livers of HFHC wild‐type mice compared to Chow wild‐type, Chow CD1dKO, and HFHC CD1dKO mice. The vertical bars represent mean ± SEM. Statistical comparison was done using one‐way analysis of variance with Bonferroni correction for C,D. ****P < 0.0001, *P < 0.05.
Table 1.
HISTOLOGIC CHARACTERISTICS AFTER 16 WEEKS ON AN HFHC DIET
| Parameters | CHOW | HFHC | Chow CD1dKO | HFHC CD1dKO |
|---|---|---|---|---|
| Steatosis grade (0‐3) | 0.17 ± 0.15 | 2.50 ± 0.31*** | 0.00 | 0.60 ± 0.36** |
| Lobular inflammation score (0‐3) | 0.67 ± 0.19 | 0.33 ± 0.19 | 0.00 | 0.00 |
| Ballooning score (0‐2) | 0.00 | 0.67 ± 0.19** | 0.00 | 0.00** |
| NAS grade (0‐8) | 0.83 ± 0.28 | 3.50 ± 0.46*** | 0.00 | 0.60 ± 0.36*** |
| Portal inflammation (0‐3) | 0.00 | 0.00 | 0.00 | 0.00 |
| Fibrosis stage (0‐4) | 0.00 | 0.50 ± 0.43 | 0.00 | 0.00 |
One‐way analysis of variance ***P < 0.0001; **P < 0.001.
Figure 7.
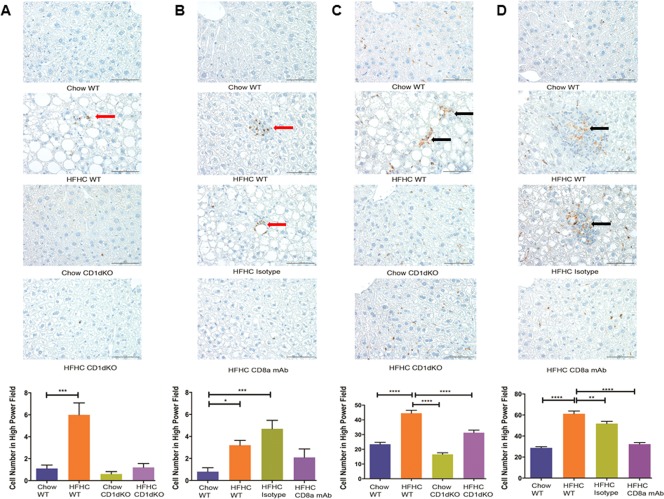
Abundance of resident macrophages (CD68‐positive cells) and infiltrating macrophages (CD11b‐positive cells) on mouse liver sections. Representative images (magnification ×400) and histology score of (A) CD11b‐positive macrophages (red arrow) in Chow WT, HFHC WT, Chow CD1dKO, and HFHC CD1dKO; (B) CD11b‐positive macrophages (red arrow) in Chow WT, HFHC WT, HFHC isotype, and HFHC CD8a mAb; (C) CD68‐positive macrophages (black arrow) in Chow WT, HFHC WT, Chow CD1dKO, and HFHC CD1dKO; (D) CD68‐positive macrophages (black arrow) in Chow WT, HFHC WT, HFHC isotype, and HFHC CD8a mAb mice groups. The histology scores were generated by counting positive cells in 10 high‐power fields in each liver section. The vertical bars represent mean ± SEM. One‐way analysis of variance with Bonferroni correction for A‐D. ****P < 0.0001; ***P < 0.001; **P < 0.01; *P < 0.05
ANTI‐CD8a mAb TREATMENT REVERSES STEATOSIS IN HFHC DIET MICE
We fed 6‐8‐week‐old C57Bl6/J mice an HFHC diet for 16 weeks, and a subgroup of these mice were injected with anti‐CD8a mAb specific to the mouse CD8 molecule from week 12 to week 16 of the experiment (Fig. 5A). The administration of CD8a mAb had no effect on weight gain of the mice fed an HFHC diet (19.04 ± 2.10g CD8a mAb versus 23.77 ± 1.17g HFHC versus 24.07 ± 3.39g HFHC isotype control; Fig. 5B). However, CD8a mAb administered to the mice fed an HFHC diet resulted in lower liver TG concentrations (831.90 ± 57.92 mg/dL HFHC CD8a mAb versus 1,860.00 ± 270.50 mg/dL HFHC WT and 1,606.00 ± 414.20 mg/dL HFHC isotype; Fig. 5C), lower serum ALT levels (90.74 ± 7.56 U/L CD8a mAb versus 182.10 ± 36.95 U/L HFHC WT and 129.10 ± 21.66 U/L HFHC isotype control; Fig. 5D), and lower expression of α‐SMA in the liver (1.56 ± 0.33 CD8a mAb versus 2.79 ± 0.86 HFHC WT and 3.38 ± 0.88 isotype control; Fig. 5E). Further, CD8+ T‐cell infiltration of the liver was lower in HFHC diet mice administered CD8a mAb (1.52 × 10⁵ ± 0.34 × 10⁵ CD8a mAb versus 5.17 × 10⁵ ± 0.97 × 10⁵ HFHC WT and 5.38 × 10⁵ ± 0.79 × 10⁵ isotype control; Fig. 5F).
Figure 5.
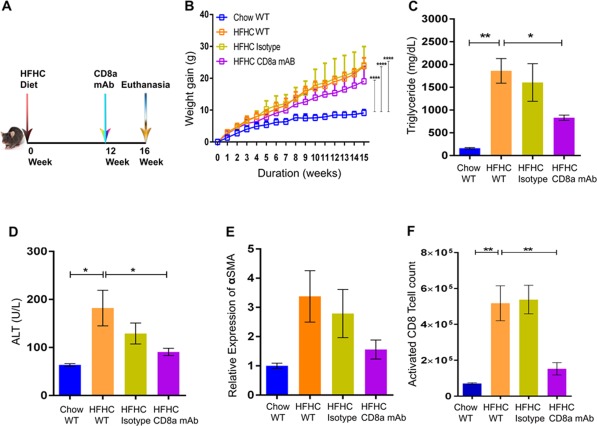
Livers from HFHC‐fed CD8+ T‐cell‐depleted mice show improved steatosis. (A) Pictorial description of the experimental time line. (B) HFHC‐fed CD8+ T‐cell‐depleted mice did not show lowering of body weight gain compared to wild‐type mice fed an HFHC diet. The CD8+ T‐cell‐depleted HFHC‐fed mice had lower (C) liver TG, (D) serum ALT, and (E) expression of α‐SMA compared to HFHC‐fed wild‐type mice. (F) The CD8a mAb‐treated HFHC mice showed a lower number of infiltrating activated CD8+ T‐cells in the liver compared to HFHC‐fed wild‐type mice. The vertical bars represent mean ± SEM. Two‐way analysis of variance with Bonferroni correction for B; one‐way analysis of variance with Bonferroni correction for C‐F. ****P < 0.0001; ***P < 0.001; **P < 0.01; *P < 0.05.
The mice injected with CD8a mAb had less steatosis and fibrosis compared to the control groups (representative images; Fig. 6A,B). The NAS of the CD8a mAb‐administered HFHC group was also lower (Table 2) (1.80 ± 0.66 HFHC CD8a mAb versus 4.60 ± 0.22 HFHC WT and 4.50 ± 1.03 HFHC isotype control; Fig. 6C). We observed increased numbers of activated CD4 T‐cells in the livers of HFHC wild‐type compared to the Chow wild‐type group. However, CD8a mAb treatment showed no effect on the percentage abundance of activated CD4 T‐cells (Supporting Fig. S2) and NKT cells (Supporting Fig. S3) among the mice groups fed an HFHC diet. We observed increased numbers of CD68‐positive cells in clusters in the liver of HFHC wild‐type and HFHC isotype mice compared to HFHC CD8a mAb (Fig. 7D). The abundance of CD68‐positive cells in the liver of Chow wild‐type and HFHC CD8a mAb were similar. We also observed a higher infiltration of CD11b‐positive cells in the liver of HFHC isotype and HFHC wild‐type mice compared to HFHC CD8a mAb and Chow wild‐type mice (Fig. 7B). CD11b cells did not form the same big clusters as the CD68‐positive cells. The numbers of CD68‐positive macrophages (resident macrophages) were higher in the liver than the CD11b macrophages (infiltrating macrophages). We further observed that the percentage abundance of F4/80‐positive macrophages and CD11b‐Gr1‐positive macrophages were lower in the liver of the HFHC CD8a mAb mice group compared to the HFHC wild‐type and HFHC isotype mice group by flow cytometry (Supporting Fig. S1). Thus, administration of CD8a mAb improved steatosis, inflammation, and fibrosis while continuing to result in weight gain on an HFHC diet.
Figure 6.
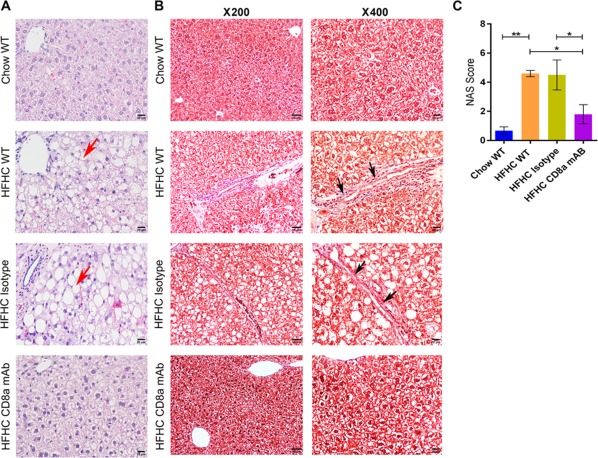
Histology and Masson's trichrome staining of liver tissue for chow/HFHC‐fed wild‐type and CD8+ T‐cell‐depleted mice. (A) Hematoxylin and eosin‐stained images (magnification ×400) of liver tissue for each experimental group. The HFHC‐fed wild‐type and HFHC‐fed isotype control antibody‐administered wild‐type mice have vacuolated hepatocytes in liver tissue (red arrow). (B) Masson's trichrome‐stained images (magnification ×200 and ×400) of liver tissue for each experimental group. Collagen deposition is observed in liver sections from HFHC‐fed wild‐type and HFHC‐fed isotype control antibody‐administered wild‐type mice (black arrow). (C) Graphical depiction of NAS for each experimental group. The vertical bars represent mean ± SEM. Statistical comparison was done using one‐way analysis of variance with Bonferroni correction for C. **P < 0.01; *P < 0.05.
Table 2.
HISTOLOGIC CHARACTERISTICS AFTER 16 WEEKS ON AN HFHC DIET
| Parameters | Chow | HFHC | HFHC Isotype Control | HFHC CD8a mAB |
|---|---|---|---|---|
| Steatosis grade (0‐3) | 0.00 ± 0.00 | 2.60 ± 0.22** | 2.50 ± 0.43* | 1.20 ± 0.44 |
| Lobular inflammation score (0‐3) | 0.67 ± 0.27 | 1.00 ± 0.28 | 1.25 ± 0.41 | 0.40 ± 0.36 |
| Ballooning score (0‐2) | 0.00 ± 0.00 | 1.00 ± 0.00 | 0.75 ± 0.22 | 0.20 ± 0.18* |
| NAS grade (0‐8) | 0.67 ± 0.27 | 4.60 ± 0.22* | 4.50 ± 1.03* | 1.80 ± 0.66 |
| Portal inflammation (0‐3) | 0.00 ± 0.00 | 0.20 ± 0.18 | 0.25 ± 0.22 | 0.00 ± 0.00 |
| Fibrosis stage (0‐4) | 0.00 ± 0.00 | 1.80 ± 0.18* | 1.25 ± 0.41 | 0.60 ± 0.22* |
One‐way analysis of variance *P < 0.01; **P < 0.001.
Figure 8.

Graphical representation of events leading to fibrosis in the liver due to steatosis in hepatocytes induced by an HFHC diet. An HFHC diet leads to the accumulation of lipid droplets in hepatocytes. This triggers the infiltration of immune cells, like CD8 T‐cells and NKT cells, in the liver, causing inflammatory reaction in the liver (NAFLD). The inflammatory reaction further influences the manifestation of fibrosis in the inflamed liver (NASH).
Discussion
In our study, we explored the role of immune cells using an HFHC diet‐induced obese murine model of NASH progression over 16 weeks. Increased infiltration of hepatic CD8+ T‐cells and NKT cells was observed in mice fed an HFHC diet compared to mice fed chow. We also observed increased IP‐10 in the serum of mice fed HFHC. IP‐10 is secreted by macrophages, T cells, NK cells, and dendritic cells in response to interferon‐γ.16 We further confirmed a role for CD8+ T‐cells and NKT cells using mAb and knockout mice experiments, respectively. Specifically, we investigated whether the absence of functional NKT cells protects the liver from obesity and NASH progression by using CD1dKO mice that have no functional NKT cells. After 16 weeks of an HFHC diet, we observed that the CD1dKO mice were protected from obesity and NASH progression. We further observed that the administration of antibody against the CD8a molecule in mice on an HFHC diet afforded protection against NASH progression without weight loss.
Nishimura et al. recently demonstrated that a high‐fat diet induces inflammation in adipose tissue, which is characterized by the accumulation of CD8+ T‐cells in the adipose tissue.17 The depletion of CD8+ T‐cells by CD8 antibody treatment improves the insulin resistance and oral glucose tolerance in mice with high‐fat diet‐induced obesity. Our study was focused on the effect of an HFHC diet on the livers of diet‐induced obese mice. We observed that the depletion of CD8+ T‐cells by antibody treatment protects the liver from inflammation, as evident from the lower abundance of both resident and infiltrating macrophages in the liver tissue section and fibrosis as evident from the Masson's trichrome staining of the liver tissue section. Further, the biochemical and histologic improvement observed in our CD8 antibody‐treated mice are in agreement with Arindkar et al.18 We also observed infiltration of CD8+ T‐cells in the liver biopsies of patients with NASH. Although we have not observed infiltration of NKT cells in the liver biopsies of patients with NASH, given the progressive nature of NASH, we cannot be confident that the lack of identification of these cells is the result of transient infiltration of NKT cells.
Wolf et al. demonstrated that NKT cells and CD8+ T‐cells cooperatively promote NASH pathogenesis via crosstalk with hepatocytes.9 The HFHC‐fed CD1dKO mice in our study showed less liver injury, inflammation, and fibrosis than the HFHC‐fed wild‐type mice. It may be that the absence of functional NKT cells contributed to this observation alone. However, given that there were CD8+ T‐cells present and they are not CD1d restricted, we speculate that neither NKT cells nor CD8+ T‐cells alone contribute to NASH progression. It may instead be that the synergistic action of NKT cells and CD8+ T‐cells contribute to the inflammation and fibrosis associated with NASH progression (Fig. 8).
Antibody‐mediated therapy has been described in murine models for human immunodeficiency virus infection,19 inflammatory disorder by targeting either cytokine in vivo 20 or targeting the receptor required for cytokine,21 or pathogen to manifest the disease condition. In our study, we observed that the absence of functional NKT cells or depletion of CD8+ T‐cells in vivo provided protection to the NASH animal model from a possible NASH outcome. It may also be concluded from our study that NKT cells and CD8+ T‐cells have a synergistic effect on the NASH outcome. The findings of our study may help to develop a therapeutic option for NASH in the future. Antibody‐mediated depletion of CD8+ T‐cells reversed diet‐induced murine NASH within 4 weeks of treatment. The genetically induced absence of functional NKT cells protected against diet‐induced murine NASH. Taken together, an antibody‐mediated treatment targeting the CD8 molecule and blocking in vivo generation of functional NKT cells may be potential therapeutic options for NASH.
Author names in bold designate shared co‐first authorship.
Supporting information
Additional Supporting Information may be found at onlinelibrary.wiley.com/doi/10.1002/hep4.1041/suppinfo.
Supporting Information
Acknowledgment
We thank Dr. Mikako Warren, M.D., Pediatric Pathologist, Children's Hospital Los Angeles, for sharing her expertise with the liver tissue histology.
Potential conflict of interest: Nothing to report.
Supported by grants from the National Institutes of Health (DK084310 and P30 DK078392, Cincinnati Digestive Health Center).
Contributor Information
Pranav Shivakumar, Email: Pranav.Shivakumar@cchmc.org.
Rohit Kohli, Email: rokohli@chla.usc.edu.
REFERENCES
- 1. Nonalcoholic steatohepatitis. 2014. https://www.niddk.nih.gov/health-information/liver-disease/nafld-nash. Accessed July 21, 2016.
- 2. Michelotti GA, Machado MV, Diehl AM. NAFLD, NASH and liver cancer. Nat Rev Gastroenterol Hepatol 2013;10:656‐665. [DOI] [PubMed] [Google Scholar]
- 3. Farrell GC, van Rooyen D, Gan L, Chitturi S. NASH is an inflammatory disorder: pathogenic, prognostic and therapeutic implications. Gut Liver 2012;6:149‐171. [DOI] [PMC free article] [PubMed] [Google Scholar]
- 4. Demir M, Lang S, Steffen HM. Nonalcoholic fatty liver disease ‐ current status and future directions. J Dig Dis 2015;16:541‐557. [DOI] [PubMed] [Google Scholar]
- 5. Kohli R, Kirby M, Xanthakos SA, Softic S, Feldstein AE, Saxena V, et al. High‐fructose, medium chain trans fat diet induces liver fibrosis and elevates plasma coenzyme Q9 in a novel murine model of obesity and nonalcoholic steatohepatitis. Hepatology 2010;52:934‐944. [DOI] [PMC free article] [PubMed] [Google Scholar]
- 6. Bhattacharjee J, Kumar JM, Arindkar S, Das B, Pramod U, Juyal RC, et al. Role of immunodeficient animal models in the development of fructose induced NAFLD. J Nutr Biochem 2014;25:219‐226. [DOI] [PubMed] [Google Scholar]
- 7. Hua J, Liang S, Ma X, Webb TJ, Potter JP, Li Z. The interaction between regulatory T cells and NKT cells in the liver: a CD1d bridge links innate and adaptive immunity. PLoS ONE 2011;6:e27038. [DOI] [PMC free article] [PubMed] [Google Scholar]
- 8. Brigl M, Bry L, Kent SC, Gumperz JE, Brenner MB. Mechanism of CD1d‐restricted natural killer T cell activation during microbial infection. Nat Immunol 2003;4:1230‐1237. [DOI] [PubMed] [Google Scholar]
- 9. Wolf MJ, Adili A, Piotrowitz K, Abdullah Z, Boege Y, Stemmer K, et al. Metabolic activation of intrahepatic CD8+ T Cells and NKT cells causes nonalcoholic steatohepatitis and liver cancer via cross‐talk with hepatocytes. Cancer Cell 2014;26:549‐564. [DOI] [PubMed] [Google Scholar]
- 10. Syn W‐K, Oo YH, Pereira TA, Karaca GF, Jung Y, Omenetti A, et al. Accumulation of natural killer T cells in progressive nonalcoholic fatty liver disease. Hepatology 2010;51:1998‐2007. [DOI] [PMC free article] [PubMed] [Google Scholar]
- 11. Wensveen FM, Jelencic V, Valentic S, Sestan M, Wensveen TT, Theurich S, et al. NK cells link obesity‐induced adipose stress to inflammation and insulin resistance. Nat Immunol 2015;16:376‐385. [DOI] [PubMed] [Google Scholar]
- 12. Popov Y, Schuppan D. CD8+ T cells drive adipose tissue inflammation‐‐a novel clue for NASH pathogenesis? J Hepatol 2010;52:130‐132. [DOI] [PubMed] [Google Scholar]
- 13. Kruisbeek AM. In vivo depletion of CD4‐ and CD8‐specific T cells. Curr Protoc Immunol 2001;Chapter 4:Unit 4.1. [DOI] [PubMed] [Google Scholar]
- 14. Koppe SW, Sahai A, Malladi P, Whitington PF, Green RM. Pentoxifylline attenuates steatohepatitis induced by the methionine choline deficient diet. J Hepatol 2004;41:592‐598. [DOI] [PubMed] [Google Scholar]
- 15. Brunt EM, Kleiner DE, Wilson LA, Belt P, Neuschwander‐Tetri BA; NASH Clinical Research Network . Nonalcoholic fatty liver disease (NAFLD) activity score and the histopathologic diagnosis in NAFLD: distinct clinicopathologic meanings. Hepatology 2011;53:810‐820. [DOI] [PMC free article] [PubMed] [Google Scholar]
- 16. Dufour JH, Dziejman M, Liu MT, Leung JH, Lane TE, Luster AD. IFN‐gamma‐inducible protein 10 (IP‐10; CXCL10)‐deficient mice reveal a role for IP‐10 in effector T cell generation and trafficking. J Immunol 2002;168:3195‐3204. [DOI] [PubMed] [Google Scholar]
- 17. Nishimura S, Manabe I, Nagasaki M, Eto K, Yamashita H, Ohsugi M, et al. CD8+ effector T cells contribute to macrophage recruitment and adipose tissue inflammation in obesity. Nat Med 2009;15:914‐920. [DOI] [PubMed] [Google Scholar]
- 18. Arindkar S, Bhattacharjee J, Kumar JM, Das B, Upadhyay P, Asif S, et al. Antigen peptide transporter 1 is involved in the development of fructose‐induced hepatic steatosis in mice. J Gastroenterol Hepatol 2013;28:1403‐1409. [DOI] [PubMed] [Google Scholar]
- 19. Qiao Y, Man L, Qiu Z, Yang L, Sun Y, He Y. Isolation and characterization of a novel neutralizing antibody targeting the CD4‐binding site of HIV‐1 gp120. Antiviral Res 2016;132:252‐261. [DOI] [PubMed] [Google Scholar]
- 20. Zhang M, Fei X, Zhang GQ, Zhang PY, Li F, Bao WP, et al. Role of neutralizing anti‐murine interleukin‐17A monoclonal antibody on chronic ozone‐induced airway inflammation in mice. Biomed Pharmacother 2016;83:247‐256. [DOI] [PubMed] [Google Scholar]
- 21. Tanaka T, Narazaki M, Kishimoto T. Immunotherapeutic implications of IL‐6 blockade for cytokine storm. Immunotherapy 2016;8:959‐970. [DOI] [PubMed] [Google Scholar]
Associated Data
This section collects any data citations, data availability statements, or supplementary materials included in this article.
Supplementary Materials
Additional Supporting Information may be found at onlinelibrary.wiley.com/doi/10.1002/hep4.1041/suppinfo.
Supporting Information


