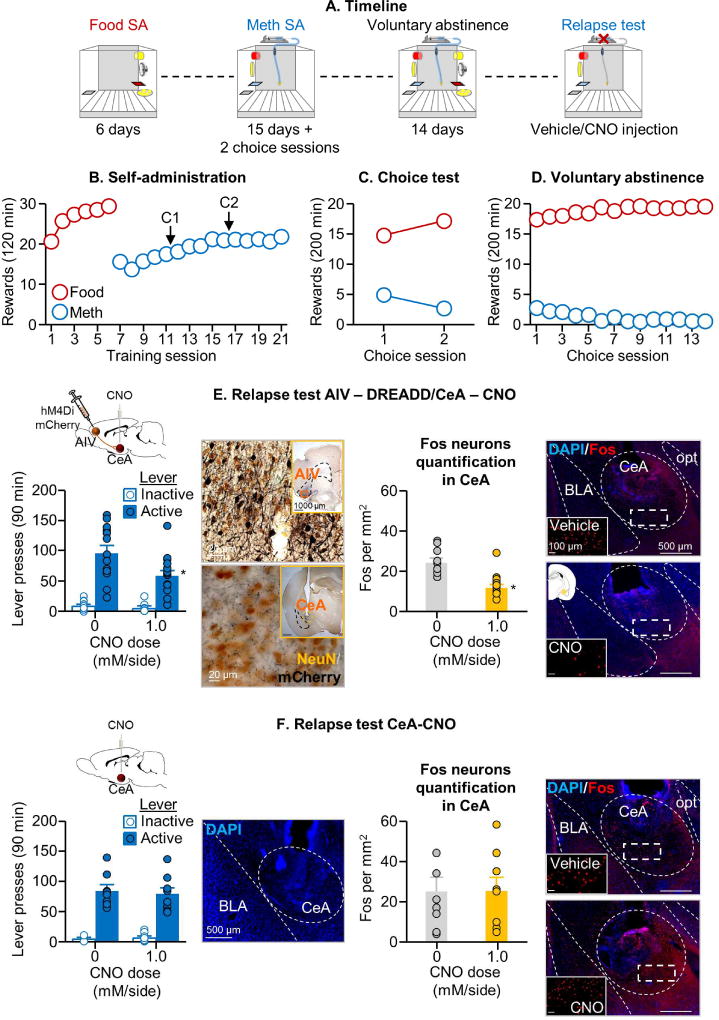
Figure 4. Inhibition of neuronal activity in AIV→CeA projection decreased relapse after voluntary abstinence.
(A) Timeline of the experiment. (B) Self-administration training: Number of food rewards or methamphetamine infusions during the 120-min sessions (total n=47). (C) Discrete choice sessions during training: Food rewards and methamphetamine infusions earned during the 2 discrete choice sessions that were performed during training. (D) Voluntary abstinence: Number of food rewards and methamphetamine infusions earned during the discrete choice sessions. (E) Relapse test with DREADD injection. Left: Lever presses on the active and inactive levers during the 90-min extinction session (n=15 per group). We injected vehicle or CNO (1.0 mM/0.5 µL/side) 30 min before the test session. We include a representative micrograph of NeuN + mCherry double labeling immunohistochemistry in the AIV (cell bodies) and CeA (terminals) (scale=20 µm). Insertions represent virus in AIV and CeA cannula placement (scale=1000 µm). * Different from the active lever in the vehicle condition, p<0.05. Right: Number of Fos-IR positive cell per mm2 in the CeA after vehicle or CNO. We include a representative photomicrograph of cannula placement in CeA for each CNO dose (scale=500 µm). Magnifications represent Fos expression for each CNO dose (scale=100 µm). * Different from the vehicle condition, p<0.05. (F) Relapse test without DREADD injection, Left: Lever presses on the active and inactive levers during the 90-min test session (n=8–9 per group). We injected vehicle or CNO (1.0 mM/0.5 µL/side) 30 min before the test sessions. We added a representative photomicrograph of the cannula placement in CeA (scale=500 µm). Right: Number of Fos-IR positive cell per mm2 in the CeA after vehicle or CNO. Representative photomicrograph of cannula placement in CeA for each CNO dose (scale=500 µm). Magnifications represent Fos expression for each CNO dose (scale=100 µm). * Different from the vehicle condition, p<0.05.

