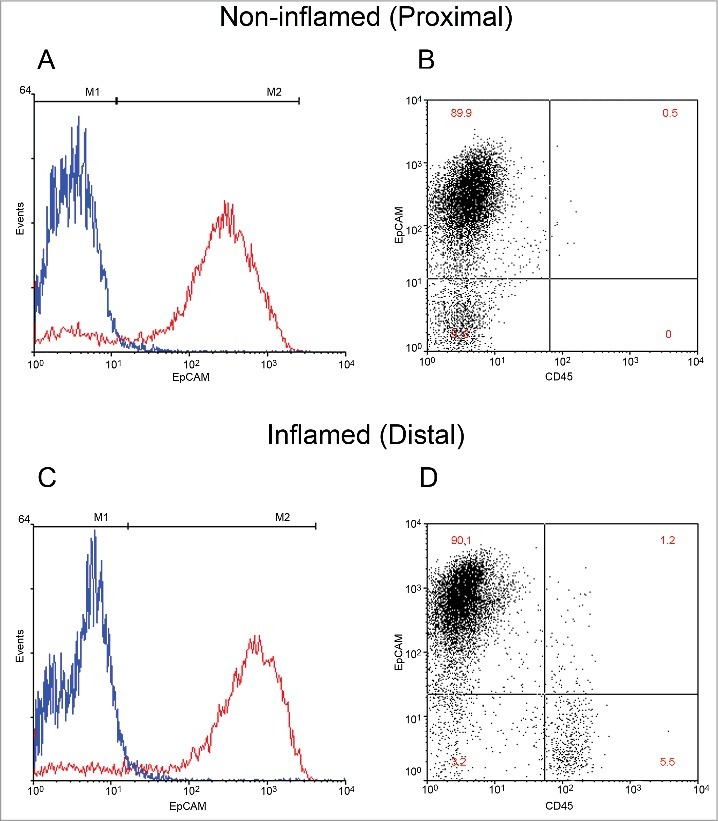
Figure 1.

Classification of cellular proportions in non-inflamed and inflamed colonic regions. Intestinal epithelial cells (IECs) isolated from mucosal pinch biopsies are illustrated (A-D). IECs were labeled with fluorescent antibodies EpCAM and CD45 to distinguish cell populations. Representative histograms of EpCAM positive labeled cells (red) and its isotype control (blue) are illustrated in non-inflamed (A) and inflamed (C) regions. Quantification of the percentage of epithelial cells in the IEC isolate was then performed. Representative scatterplots of epithelial positive cells (upper left), CD45 positive cells (lower right) and double negative cells (lower left and upper right) are illustrated in non-inflamed (B) and inflamed (D) regions.
