

ABSTRACT
Infertility affects one in 6 couples in developed nations, resulting in an increasing use of assisted reproductive technologies (ART). Both ART and subfertility appear to be linked to lower birth weight outcomes, setting infants up for poor long-term health. Prenatal growth is, in part, regulated via epigenetically-controlled imprinted genes in the placenta. Although differences in DNA methylation between ART and control infants have been found, it remains unclear whether these differences are due to the ART procedures or to the underlying parental subfertility and how these methylation differences affect imprinted gene expression. In this study, we examined the expression of 108 imprinted genes in placental tissues from infants born to subfertile parents (n = 79), matched naturally-conceived controls (n = 158), and infants conceived using in vitro fertilization (IVF, n = 18). Forty-five genes were identified as having significantly different expression between the subfertile infants and controls, whereas no significant differences were identified between the IVF and control groups. The expression of 4 genes—IGF2, NAPIL5, PAX8-AS1, and TUBGCP5—was significantly downregulated in the IVF compared with the subfertile group. Three of the 45 genes significantly dysregulated between subfertile and control placentae—GRB10, NDN, and CD44 —were found to have a significant positive correlation between expression and birth weight. Methylation levels for these 3 genes and 4 others—MKRN3, WRB, DHCR24, and CYR61—were significantly correlated with expression. Our findings indicate that epigenetic differences in placentas resulting from IVF pregnancies may be related to the underlying subfertility in parents using IVF rather than the IVF procedure itself.
KEYWORDS: ART, birth weight, imprinted genes, IVF, placenta, subfertility
Introduction
Infertility, the inability to conceive after trying for over a year,1 affects approximately one in 6 couples in developed nations.2 Many of these couples turn to assisted reproductive technologies (ART), including in vitro fertilization (IVF), to conceive. Currently, ART infants account for over 1.5% of live births in the US,3 and this number is increasing as these technologies improve and average maternal age increases. Although most ART children appear healthy, ART infants face increased rates of prematurity, twinning, small for gestational age (SGA) birth, low birth weight (LBW), neonatal intensive care unit (NICU) admission, congenital abnormalities, and imprinting disorders.4-9 Of these, LBW is of particular concern as birth weight has long-term implications for cardiovascular disease, obesity, type 2 diabetes, muscle strength, and cognitive function, per the Developmental Origins of Health and Disease hypothesis.10-13 However, subfertility has been independently linked to similar poor obstetric, infant, and childhood outcomes, including lower birth weights,14-17 in couples who did not use ART to conceive, making it difficult to determine whether the increased risks associated with ART are due to the procedures used or to the underlying subfertility that makes the procedures necessary. Delineation of the impact of ART and subfertility on infant birth weights is essential to providing these infants with the best possible outcomes and a healthy start in life.
Many parental and environmental factors combine to determine birth weight, often by affecting critical functions of the placenta such as nutrient transport or the production of developmentally important growth factors or hormones. The placenta regulates the fetal environment for the duration of gestation by controlling nutrient and hormone supply to the fetus and modulating fetal exposure to the maternal environment, all in response to both genetic programming and environmental influences.18,19 Many of these critical functions are, at least partially, regulated by imprinted genes,20,21 a group of parent-of-origin, monoallelically-expressed genes whose expression is tightly controlled via epigenetic mechanisms, including DNA methylation at CpG sites.22 Overt loss of imprinting of specific imprinted genes is linked to syndromes with well-characterized significant phenotypes.23 Recent research, though, has begun to link more subtle variation in DNA methylation of regions responsible for the control of imprinted genes as well as in the expression of these genes, particularly in the placenta, with differences in birth weight.24-27 Given the role of this set of genes in growth, fetal development, and nutrient transport,20,28 as well as the potential effect that environmental exposures may play on the expression of these genes,29 imprinted genes are an ideal target for exploring the impact of ART on infant growth and development.
Changes in imprinted gene methylation and expression have been identified in ART children's cord blood, buccal swabs, and placental tissue.30-34 However, most studies on the epigenetics of IVF infants use children of parents with normal fertility as the control group. This makes it impossible to determine whether the changes identified are truly due to the procedure or are due to the underlying subfertility, especially given that epigenetic changes have been identified in subfertile parents and appear to be heritable. Identical DNA methylation errors in the H19 and GTL2 loci have been identified in paternal sperm and miscarried conceptuses.35 Epigenetic changes in infants and placenta have also been linked to causes of female infertility.36-38
Differentiating between the effect of underlying subfertility and the effect of the ART procedures used to treat this subfertility is essential to beginning to mitigate the low birth weight effects seen in these infants. In this study, we examined the impact of subfertility and IVF on placental imprinted gene expression and methylation and the relationship between these genes and birth weight from the Rhode Island Child Health Study (RICHS). We aim to differentiate between IVF treatment effects and subfertility to aid in guiding future treatment of subfertility to improve infant birth weight outcomes.
Results
Demographics
Mothers within the cohort were, on average, 31.5 y old [standard deviation (SD) = 4.81] and slightly overweight (BMI M = 26.51, SD = 7.10). Based on the demographics of the source population, as expected, the study population consisted of mostly white participants (81%). Most participants were married, reported an income over $50,000 a year, and had private health insurance. None reported using recreational drugs or alcohol during pregnancy, and 18 (7%) smoked during pregnancy. Infants were born, on average, at 39.29 weeks (SD = 0.90), with no early or late term infants, as only full-term infants were selected for inclusion in the cohort. Just over half of the infants had birth weights appropriate for gestational age (AGA), whereas the proportion of small and large for gestational age (SGA, LGA) infants was higher than normal (14.5% and 29%, respectively). This is expected given that infants were selected for inclusion in the cohort based on being SGA or LGA and then a matched AGA infant was also included. About half of the infants were delivered via cesarean section, with 14 (5.5%) admitted to the NICU following birth.
For every subfertile mother, 2 matched controls were selected. There were no significant differences between the subfertile and control groups in any of the matching variables, which included maternal age, maternal BMI, marital status, household income, infant sex, and potential obstetric complications including maternal smoking during pregnancy, intrauterine growth restriction, and delivery via cesarean section (Table 1).
Table 1.
Demographic characteristics of study population (n = 255) by fertility and IVF procedure.
| All (n = 255) | Controls (n = 158) | Subfertile (n = 79) | IVF (n = 18) | |
|---|---|---|---|---|
| Variable | N(%)/Mean(SD) | N(%)/Mean(SD) | N(%)/Mean(SD) | N(%)/Mean(SD) |
| Maternal Health and Obstetrics | ||||
| Maternal Age** | 31.53 (4.81) | 30.90 (4.74) | 31.78 (4.78) | 35.89 (3.22) |
| Maternal BMI | 26.89 (7.10) | 26.51 (6.49) | 28.00 (8.47) | 25.39 (5.01) |
| Maternal Gravida (including current child) | ||||
| 1 | 51 (20.0) | 34 (21.5) | 14 (17.7) | 3 (16.7) |
| 2 to 3 | 144 (56.5) | 92 (58.2) | 41 (51.9) | 11 (61.1) |
| 4 or more | 60 (23.5) | 32 (20.2) | 24 (30.4) | 4 (22.2) |
| Maternal Perinatal Smoking | 18 (7.1) | 12 (7.7) | 6 (7.7) | 0 (0) |
| Intrauterine Growth Restriction | 16 (6.3) | 7 (4.4) | 9 (11.4) | 3 (16.7) |
| Fetal Distress | 13 (5.1) | 7 (4.4) | 6 (7.76) | 0 (0) |
| Gestational Diabetes | 27 (10.6) | 15 (9.5) | 10 (12.7) | 2 (11.1) |
| Maternal Demographics | ||||
| Maternal Ethnicity | ||||
| White | 208 (81.6) | 128 (81.0) | 63 (79.8) | 17 (94.4) |
| Hispanic | 0 (0) | 0 (0) | 0 (0) | 0 (0) |
| Black | 13 (5.1) | 8 (5.1) | 4 (5.1) | 1 (5.6) |
| Asian | 7 (2.7) | 4 (2.5) | 3 (3.8) | 0 (0) |
| Native/Pacific Islander | 0 (0) | 0 (0) | 0 (0) | 0 (0) |
| Other | 25 (9.8) | 16 (10.1) | 9 (11.4) | 0 (0) |
| Unknown | 2 (0.01) | 2 (1.3) | 0 (0) | 0 (0) |
| Marital Status* | ||||
| Married | 187 (73.3) | 114 (72.2) | 57 (72.2) | 18 (100) |
| Separated/Divorced | 9 (3.5) | 3 (1.9) | 6 (7.6) | 0 (0) |
| Single | 57 (22.4) | 41 (26.0) | 16 (20.2) | 0 (0) |
| Household Income | ||||
| > 100,000 | 73 (28.6) | 44 (27.8) | 19 (24.1) | 10 (55.6) |
| 80,000–99,999 | 42 (16.5) | 31 (19.6) | 9 (11.4) | 2 (11.1) |
| 50,000–79,999 | 41 (16.1) | 22 (13.9) | 15 (19.0) | 4 (22.2) |
| 30,000–49,000 | 33 (12.9) | 21 (13.3) | 10 (12.7) | 2 (11.1) |
| 15,000–29,999 | 31 (12.2) | 23 (14.6) | 8 (10.1) | 0 (0) |
| < 15,000 | 25 (9.8) | 14 (8.9) | 11 (13.9) | 0 (0) |
| unknown/unsure | 10 (3.9) | 3 (1.9) | 7 (8.9) | 0 (0) |
| Maternal Insurance Type* | ||||
| Private | 174 (68.2) | 111 (70.2) | 46 (58.2) | 17 (94.4) |
| Public | 70 (27.5) | 44 (27.8) | 26 (32.9) | 0 (0) |
| Other | 8 (3.1) | 2 (0.01) | 5 (0.1) | 1 (5.6) |
| None | 3 (1.2) | 1 (0.01) | 2 (0.03) | 0 (0) |
| Infant Delivery and Outcome Characteristics | ||||
| Delivered by C-Section | 128 (50.2) | 76 (48.1) | 42 (53.2) | 10 (55.7) |
| Admitted to the NICU | 14 (5.5) | 8 (5.1) | 5 (6.3) | 1 (5.6) |
| Male Infant | 136 (53.3) | 84 (53.2) | 43 (54.4) | 9 (50.0) |
| Gestational Age (Weeks) | 39.29 (0.90) | 39.40 (0.88) | 39.04 (0.95) | 39.12 (0.81) |
| Birth weight (Grams) | 3554.73 (676.34) | 3609.67 (658.26) | 3448.44 (700.82) | 3538.44 (707.06) |
| Birth weight Group | ||||
| Small for Gestational Age | 37 (14.5) | 17 (10.8) | 17 (21.5) | 3 (16.7) |
| Appropriate for Gestational Age | 144 (56.5) | 91 (57.6) | 44 (55.7) | 9 (50.0) |
| Large for Gestational Age | 74 (29.0) | 50 (31.7) | 18 (22.8) | 6 (33.3) |
P < 0.003 for difference between IVF group and subfertile group and between IVF group and control group
P < 0.05 for difference between IVF group and subfertile group and between IVF group and control group
IVF mothers were significantly older, more likely to be married, and more likely to have private insurance than both the subfertile and the control mothers. This is expected given that IVF is a procedure that is usually used by older women. Additionally, IVF is costly and so is usually restricted to women with higher incomes and sufficient health insurance coverage. No other significant differences between groups were identified. There were no significant differences in birth weights between groups.
Relationship between expression of imprinted genes, fertility, and birth weight
Differences in the expression levels of 108 known or putative imprinted genes in the placenta were examined based on subfertility and IVF procedure and compared between the subfertile and control groups, the subfertile and IVF groups, and the IVF and control groups. Of these genes, 22 were found to be significantly differentially expressed between the subfertile and control groups at a conservative Bonferroni-adjusted level of significance (α = 0.05/108 = 0.0046) (Fig. 1A), while an additional 23 genes were also found to be significantly differentially expressed when a less stringent 5% false discovery rate (FDR) correction was used. Two genes, IGF2 and NAP1L5, were found to be significantly differentially expressed between the IVF and subfertile groups with a Bonferroni correction (Fig. 1B), with 3 additional genes, IGF2-AS, PAX8-AS1, and TUBGCP5, significant at a 5% FDR. No significant differences were found between the IVF and control groups (Fig. 1C). Direction of the difference between groups comparing subfertile to controls as well as IVF to controls is predominantly in the negative direction (Fig. 1, Fig. S1), indicating that the genes demonstrating differential expression with risk conditions—subfertility and IVF—appear to show decreased expression. A full list of all imprinted genes, their coefficients of association for each of the comparisons, and P-values is given in Tables S1–S3.
Figure 1.

Volcano plots of the unadjusted P-value (y-axis) and fold change for gene expression (x-axes) of the 3 comparisons: subfertile vs. control placentae (A), IVF vs. subfertile placentae (B) and IVF vs. control placentae (C). Genes represented by purple dots were significant for both Bonferroni and FDR corrections, while genes represented by blue dots were significant at only the FDR threshold. Genes considered significantly differentially expressed are labeled with their gene name.
Of the 5 genes differentially expressed in the IVF to subfertile comparison, all but IGF2-AS were also significant in the comparison between the subfertile and control groups (Fig. 2A). IGF2-AS is the antisense strand of the IGF2 gene, which was significantly differentially expressed in both comparisons. For the other 4 genes (IGF2, NAP1L5, PAX8-AS1, and TUBGCP5), IVF treatment appears to be associated with a further decrease in expression of the gene beyond the decrease associated with subfertility (Fig. 2B). For example, for IGF2, subfertility resulted in a log-adjusted fold change of −0.5, with the IVF procedure leading to an additional 0.64-fold change of reduced expression below that seen in the subfertile group.
Figure 2.
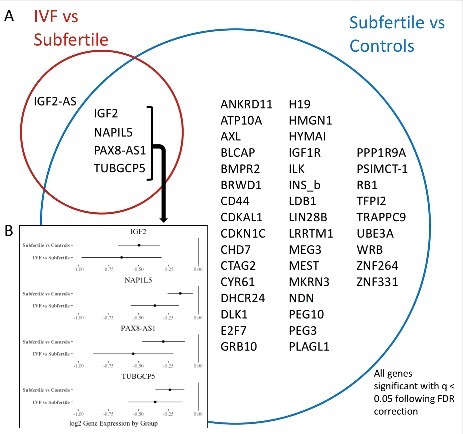
Relationships between groups of genes significant in both comparisons. A) Venn diagram showing all genes that were significantly differentially expressed in any of the comparisons performed. The genes within the blue circle were found to have significantly different RNA expression between subfertile and control placentae, while the genes within the red circle were found to have significantly different expression between IVF and subfertile placentae. Those in both circles were significant in both comparisons. B) Differences in expression between the subfertile vs. control and subfertile vs. IVF comparisons for the 4 genes that were significant for both comparisons. For each gene, the log fold change for each comparison is plotted (dot) with the lower and upper confidence interval (horizontal line).
Linear models exploring the relationship between expression of the 46 genes that were significantly differentially expressed in any of the comparisons identified 3 genes, NDN, GRB10, and CD44, that had a significant positive relationship between expression and birth weight (P-values < 0.05; none survived multiple testing adjustment). Increased expression of each of these genes is associated with a 100–200 g increase in birth weight (Fig. 3). Of the 46 genes, 35 indicated a positive association between expression and birth weight (Fig. S2).
Figure 3.

Results of a linear model of the relationship between gene expression and birth weight in grams for the 3 genes identified as having a significant association between RNA expression and birth weight. The model included BMI, infant sex, and gestational age as potential confounders. A positive estimate indicates that an increase in expression is correlated with an increase in birth weight. Dots indicate the change in birth weight for 1-fold change of increased gene expression.
Methylation data from an Illumina Infinium HumanMethylation450 (450K) array was available on 158 samples examined in this study39 and was used to evaluate relationships between DNA methylation for 42 of the genes identified in the expression analysis (4 did not have available methylation data). A total of 1730 CpGs were examined, annotated to 42 of the genes identified in the expression analysis for which data was available. Twenty CpGs annotated to 7 genes—CD44, CYR61, DHCR24, GRB10, MKRN3, NDN, and WRB—were identified as being significantly correlated with expression levels using a Spearman correlation and after a Bonferroni correction (α = 0.05/1730 = 0.000029, Table 2). For all but 3 of these CpGs—one of those annotated to CD44 and both annotated to NDN—increased methylation was correlated with decreased expression of the gene. A full list of correlation test results is included in Table S4. Relationships between CpG methylation and birth weight were not found to be significant, nor were any relationships between methylation and fertility status (data not shown).
Table 2.
Significant Spearman correlations between CpG methylation and gene expression following a Bonferroni correction.
| Spearman Correlation |
|||||
|---|---|---|---|---|---|
|
P-value |
|||||
| R | Unadjusted | Bonferroni Adjusted | CpG Position | ||
| CD44 | cg16344511 | 0.258 | 0.001 | 0.027 | Body |
| cg21076259 | −0.252 | 0.001 | 0.035 | Body | |
| CYR61 | cg18027683 | −0.255 | 0.001 | 0.023 | Body |
| DHCR24 | cg27168858 | −0.366 | 0.000 | 0.000 | Body |
| cg25536676 | −0.261 | 0.001 | 0.020 | TSS1500 | |
| GRB10 | cg23104539 | −0.313 | 0.000 | 0.004 | TSS1500 |
| MKRN3 | cg05952543 | −0.341 | 0.000 | 0.000 | TSS200 |
| cg20792895 | −0.322 | 0.000 | 0.000 | TSS200 | |
| cg11100640 | −0.307 | 0.000 | 0.001 | 5′UTR, 1stExon | |
| cg23234999 | −0.306 | 0.000 | 0.001 | 1stExon | |
| cg16131766 | −0.295 | 0.000 | 0.002 | TSS200 | |
| cg00215587 | −0.290 | 0.000 | 0.002 | 5′UTR, 1stExon | |
| cg19903927 | −0.288 | 0.000 | 0.002 | 1stExon | |
| cg27046052 | −0.255 | 0.001 | 0.012 | 5′UTR, 1stExon | |
| cg20769842 | −0.245 | 0.002 | 0.019 | TSS1500 | |
| NDN | cg01989224 | 0.258 | 0.001 | 0.014 | TSS1500 |
| cg12138102 | 0.238 | 0.003 | 0.034 | TSS1500 | |
| WRB | cg26315964 | −0.321 | 0.000 | 0.001 | Body |
| cg05717685 | −0.300 | 0.000 | 0.003 | Body | |
| cg27144788 | −0.256 | 0.001 | 0.027 | Body | |
To assess the reliability of the Nanostring measure, we compared the median expression obtained from Nanostring to that obtained from whole transcriptome RNAseq analysis for 80 of the genes that overlapped between the 2 technologies and found a high degree of correlation (average Spearman rho = 0.76).
Discussion
In this study, we have identified 45 imprinted genes that appear to have significantly different mRNA levels in the placentae of subfertile couples compared with matched pairs of normal fertility couples. In contrast, no differences in expression were identified between in vitro fertilization (IVF) placentae and normally-conceived placentae, indicating that IVF infants' clinical outcomes are likely linked to the parents' underlying subfertility rather than the IVF procedures. For 4 genes—IGF2, NAP1L5, PAX8-AS1, and TUBGCP5—treatment with IVF was associated with an even greater decrease in expression than identified in the subfertile group compared with controls. These 4 genes may therefore be affected by the IVF procedure, or there may be some difference in these genes in patients who require IVF to conceive.
Expression levels of 3 of the genes identified as different between the subfertile and control groups—GRB10, NDN, and CD44—were positively associated with birth weight; thus, decreased expression, as seen in the subfertile group, was associated with decreased birth weight. In our prior work, both NDN and CD44 were linked to large or small for gestational age.27 Although we did not previously find association between GRB10 and birth weight, placental expression levels of GRB10 have been negatively correlated with infant head circumference,28 and it was identified as one of 6 genes for which methylation levels explained 78% of the variance in birth weight.25 These correlations provide a mechanistic pathway by which imprinted gene expression differences may be generating the phenotypic effect of low birth weights.
To further establish a pathway by which subfertility and IVF may impact birth weight, we examined the DNA methylation status for CpGs annotated to genes previously found significant and for which data was available. Methylation levels at 20 CpGs for 7 of these genes were identified as being significantly correlated with expression, including the 3 genes associated with birth weight. As expected,22 increased methylation was correlated with decreased expression for most of these CpGs. Our results suggest that DNA methylation may play a role in the overt control of expression of these genes, which then help determine birth weight outcomes. This role may be distinct from the role that DNA methylation plays at imprinting control regions (ICRs, which were not specifically examined using the array-based data), where methylation is involved in allele-specific expression or silencing. Changes at ICRs tend to represent extreme phenotypes, which we would not expect in this healthy, full-term population. The methylation differences identified indicate a role for non-ICR CpGs in subtler phenotypic variation across healthy populations. Further work is needed to more comprehensively characterize the functional implications and regulation of DNA methylation in the non-ICRs of these imprinted genes.
Even though most IVF patients are subfertile, few studies have examined subfertile and IVF groups in comparison to control groups simultaneously. Studies on placentae from donor embryos compared with autologous embryos indicate that methylation differences may be related to both the subfertile condition and the procedure itself.40 In our study, expression levels of several of the commonly identified genes linked to ART epigenetic differences, including IGF2, H19, MEST, and GRB10,31,33,41,42 were found to be different between the subfertile group and controls, indicating that the apparent significance of these genes in studies that compare ART infants to naturally-conceived controls may be confounded by the underlying subfertility.
Most prior studies on imprinted genes in subfertility and IVF use buccal cells and cord blood or other samples from the infant. Given the importance of the placenta in regulating infant growth, placental epigenetic changes may be setting the infant up for long-term health consequences, even if there are no epigenetic changes in the infants' tissue. IVF placenta may also have different exposures than the fetal tissue; the trophectoderm cells from which the placenta develops are directly exposed to IVF media, whereas the inner cell mass that will later develop into the fetus is more protected and may have mechanisms to correct epigenetic changes that placental tissues do not have.43 Our study adds significant findings to the literature on the impact of subfertility and IVF on the placenta and emphasizes the need for further focus on the role of the placenta in prenatal development.
There were several limitations of this study related to the cohort available. Despite having a well-matched sample with no significant differences on matching variables between our subfertile and control groups, the cohort was selected for small and large for gestational age infants, resulting in a lower proportion of appropriate for gestational age infants than would be found in the general population. Also, due to the self-report nature of the subfertility, we do not have clinically documented subfertility diagnoses. As a result, we cannot make any conclusions regarding type of subfertility. Given the diversity of the reasons for subfertility likely to be found within our cohort, our ability to identify differences between the subfertile and control groups supports the idea that subfertility has some underlying genetic variation that is affecting infant birth weight irrespective subfertility cause. Additional studies are needed to determine which of the differences identified here are related to the range of possible causes of subfertility.
Our power to identify an effect of IVF was limited by the small number (n = 18) of IVF infants in our cohort. If there were an effect of the IVF intervention large enough to affect birth weight, however, we would expect to see some differences between the IVF and control groups, despite our small sample size, and none were identified in this study. Although some component of ART treatment may alter the expression of imprinted genes to bring them to normal levels, we identified 4 genes where IVF placentae had significantly lower expression than subfertile patients' placentae, even though these genes were not differently expressed between the IVF and control groups. Further work is needed to elucidate the role of these genes in IVF and the potential impact of ART on imprinted genes.
Our data are restricted to mRNA and CpG methylation levels and we do not have data on placental protein levels. However, the positive association between expression and birth weight found for 3 genes indicates a relationship between expression and phenotypic outcomes. Expression of all 3 of these genes was also correlated with methylation level, indicating that methylation may be the mechanism for the differing expression levels. Although the changes in methylation appear slight, imprinted gene expression is highly controlled, and so small fluctuations in expression can have a large impact on infant outcomes. It should be noted that we have not examined allele-specific DNA methylation and these results should not be interpreted as such, but are instead an average level of methylation at a specific CpG site. In addition, the data obtained represent an “average” signal across the various cells within the sample of tissue examined and likely these samples are heterogeneous. We have aimed to create representative samples of the placenta through our sampling technique, but recognize that there still may be variation inherent between different cell types or even within a given cell type based on the microenvironment of that cell. Although not possible within this study, future work may wish to explore this heterogeneity further through cell-specific techniques such as in situ hybridization, to localize the sources of variation.
Overall, our study indicates that subfertile populations may have differences in their epigenetic regulation at non-ICR CpG sites that affect expression of imprinted genes, resulting in phenotypic changes in birth weight. We did not find any differences between IVF patients' placentae and controls, indicating that subfertility itself, rather than the IVF procedure, is related to changes in placental imprinted gene expression. These findings support the safety of the IVF procedure and are encouraging in terms of the long-term outcome for IVF infants. Future studies are required to determine the role of many of these genes and to associate these findings with specific causes of subfertility.
Patients and methods
Study Population
All study participants were enrolled in the Rhode Island Child Health Study (RICHS), which contains mother/infant pairs who were recruited at Woman and Infant's Hospital of Rhode Island (Providence, RI, USA) between Sept 1, 2009 and Aug 7, 2013. Mothers of term infants (gestational age ≥37 weeks) born small or large for gestational age, based on birth weight and gestational age calculated from the Fenton growth chart, were recruited to the study. Each of these infants was matched with a term infant born appropriate for gestational age (≥10th percentile and ≤90th percentile) matched on gender, gestational age ( ± 3 days), and maternal age ( ± 2 years). All infants were singleton births with no life-threatening conditions or congenital or chromosomal abnormalities. Medical chart review was used to provide obstetric and demographic data, including infant birth outcomes such as birth weight and gestational age. Interviewer-based questionnaire was used to collect additional obstetric and medical history, including pre-pregnancy weight and height (for pre-pregnancy BMI calculation), as well as exposures including maternal smoking. Participants self-identified as experiencing subfertility by indicating that they had tried to conceive for more than a year and also self-reported whether IVF or other medical intervention was used to conceive. All participants provided written informed consent and the study was approved by the Institutional Review Boards at Women and Infants Hospital and Emory University.
Placenta collection and RNA extraction
Within 2 h of delivery, 3 samples were collected from each of 4 quadrants of the placenta from each subject, resulting in 12 placental parenchymal samples (totaling approximately 8–10 g of tissue) per subject. All samples were taken 2 cm from the insertion of the umbilical cord on the fetal side and were free of maternal decidua. Samples were immediately rinsed with and placed in RNAlater (Life Technologies) and stored at 4°C. Within 72 h, placental samples were removed from the RNAlater, blotted dry, and snap-frozen in liquid nitrogen. All collected samples were then homogenized together via pulverization with a stainless steel cup and piston unit (Cellcrusher), creating a mixed sample, and stored at −80°C. DNA and RNA were extracted using QIAmp DNA mini kit (Qiagen, #51306) and RNeasy mini kit (Qiagen, #74106), respectively, following the manufacturer's protocols. RNA was checked for quality and quantity using a Nanodrop ND-1000 spectrophotometer (Thermo Fisher) and integrity assessed using an Agilent bioanalyzer (Agilent). RNA was aliquoted and stored at −80°C.
Gene expression profiling
The details on the probe selection and design and on the methodology of Nanostring detection has been previously published.27 To demonstrate reliability of the Nanostring measures for our cohort, for a subset of probes (80 genes) we compared the expression values obtained from Nanostring to those obtained from whole transcriptome RNAseq studies. RNAseq was acquired from a subset of 200 samples from the original cohort. RNA was isolated using RNAeasy Mini kit and stored at −80°C. Before analysis, RNA was quantified via Nanodrop and RNA integrity was assessed using an Agilent bioanalyzer. rRNA was removed using Ribo-zero kits and then RNA was converted to cDNA using random hexamers. Transcriptome-wide RNA sequencing was performed using the HiSeq 22500 platform. Raw reads are available on NCBI (SRP095010). FastQC was used for quality control and then STAR analyzer was used to map read to human reference genome h19. Read counts were adjusted for GC content. Finally, data was normalized via trimmed means of m-values (TMM) and converted to log2 counts per million reads.
Statistical analysis
All normalization and analyses were conducted using R 3.3.0.44 Normalization of nCounter data was done using the NanoStringNorm package. Raw nCounter code counts were normalized against the geometric mean of positive control counts. Sample-specific background signals were calculated using the negative controls and then counts were normalized against the sample-specific geometric mean of the housekeeping genes GAPDH, RPL19, and RPLP0. Samples below the background threshold of detection—set at 2 standard deviations above the mean of the negative controls—for 50% or more of the genes were removed. Samples with outlying positive control normalization factors and duplicates were also removed resulting in a data set of 672 samples with count data on 108 genes. Counts were log2 transformed and adjusted for batch effects using ComBat from the R package sva.45 Finally, 15 samples were removed due to having more than 10 genes with expression outside of 3 standard deviations of the mean, leaving 657 samples for cohort selection.
Cohort selection
From the 657 samples with imprinting data that met quality control standards, 51 were removed due to use of a different survey format, 2 were removed due to missing maternal BMI, and one was removed due to recreational drug use during pregnancy, leaving 603 samples. Of these, 83 reported experiencing subfertility on the interviewer-based questionnaire and a separate 18 participants reported using in vitro fertilization (IVF). Of the subfertile group, 4 were excluded due to use of fertility drugs without use of IVF, leaving 79 subfertile participants who did not use IVF or fertility treatments. Using the Matching package in R,46 each subfertile mother-infant pair was matched to 2 control pairs on infant sex, intrauterine growth restriction, alcohol and tobacco use during pregnancy, maternal age, BMI, marital status, ethnicity, socioeconomic status, and whether the infant was born via cesarean section. This generated a matched cohort of 237, with a total cohort of 255 including the IVF participants.
Gene expression analysis
Gene expression between groups was evaluated for all 108 genes using the limma package in R.47 One model of gene expression was generated for all 3 groups and then contrasts between groups were evaluated using an empirical Bayes method. Both a Bonferroni adjustment and the Benjamini-Hochberg-based false discovery rate (FDR) were used to account for multiple testing. Genes with differences between groups that were significant at an FDR-adjusted q-value below 0.05 were further analyzed for an effect on birth weight using linear models of gene expression and birth weight, controlling for infant sex, maternal BMI, and gestational age in days. Volcano and forest plots were generated using ggplot2.48
DNA methylation analysis
Methylation data from the Illumina Infinium HumanMethylation450 (450K) array was available for 158 participants and was used to identify a total of 1730 CpGs that have been annotated to one or more of the 42 genes identified in the expression analysis previously described, with 18 of these being annotated to more than one gene of interest. The details on the examination of DNA methylation using the Infinium 450K array (Illumina) has been previously reported in Paquette et al. (2016).39 Data is available on GEO under accession number GSE75248.
Spearman correlations using the rcorr function in the Hmisc package49 were used to explore the relationship between methylation of these CpGs and birth weight and the relationship between CpGs annotated to each gene and that gene's expression levels using gene-specific subsets of CpGs. Bonferroni adjustments were used in all analyses to account for multiple testing. Finally, relationships between subfertile placentae, IVF placentae, and control placentae and methylation were examined for the same 1730 CpGs using ANOVA. One-way student t-tests were used to explore differences between methylation in subfertile and control placentae.
Supplementary Material
Funding Statement
This work was supported by grants from the US National Institutes of Health (R01ES022223; R01MH094609).
Disclosure of potential conflicts of interest
No potential conflicts of interest were disclosed.
References
- 1.Zegers-Hochschild F, Adamson GD, de Mouzon J, Ishihara O, Mansour R, Nygren K, Sullivan E, Vanderpoel S. International Committee for Monitoring Assisted Reproductive Technology (ICMART) and the World Health Organization (WHO) revised glossary of ART terminology, 2009*. Fertil Steril [Internet] 2009; 92:1520–4; PMID:19828144; https://doi.org/10.1016/j.fertnstert.2009.09.009 [DOI] [PubMed] [Google Scholar]
- 2.Thoma ME, McLain AC, Louis JF, King RB, Trumble AC, Sundaram R, Buck Louis GM. Prevalence of infertility in the United States as estimated by the current duration approach and a traditional constructed approach. Fertil Steril [Internet] 2013; 99:1324–31.e1. Available from: PMID:23290741; https://doi.org/10.1016/j.fertnstert.2012.11.037. [DOI] [PMC free article] [PubMed] [Google Scholar]
- 3.Sunderam S, Kissin DM, Crawford SB, Folger SG, Jamieson DJ, Warner L, Barfield WD. Assisted Reproductive Technology Surveillance - United States, 2013. MMWR Surveill Summ 2015; 64:1–28; PMID:26633040; https://doi.org/10.15585/mmwr.ss6411a1 [DOI] [PubMed] [Google Scholar]
- 4.Albertini DF, Evers JLH, Geraedts JPM, Gianaroli L, Sharpe R, Sinclair KD, Sunde A, Van Steirteghem A, Baird DT, Crosignani PG, et al.. Birth defects and congenital health risks in children conceived through assisted reproduction technology (ART): A meeting report. J Assist Reprod Genet 2014; 31:947–58; PMID:24870703; https://doi.org/10.1007/s10815-014-0255-7 [DOI] [PMC free article] [PubMed] [Google Scholar]
- 5.D'Angelo D V., Whitehead N, Helms K, Barfield W, Ahluwalia IB. Birth outcomes of intended pregnancies among women who used assisted reproductive technology, ovulation stimulation, or no treatment. Fertil Steril [Internet] 2011; 96:314–20.e2; PMID:21718990; https://doi.org/10.1016/j.fertnstert.2011.05.073 [DOI] [PubMed] [Google Scholar]
- 6.Hansen M, Bower C. The impact of assisted reproductive technologies on intra-uterine growth and birth defects in singletons. Semin Fetal Neonatal Med [Internet] 2014; 19:228–33; PMID:24746981; https://doi.org/10.1016/j.siny.2014.03.002 [DOI] [PubMed] [Google Scholar]
- 7.Boulet SL, Kirby RS, Reefhuis J, Zhang Y, Sunderam S, Cohen B, Bernson D, Copeland G, Bailey MA, Jamieson DJ, et al.. Assisted reproductive technology and birth defects among liveborn infants in florida, massachusetts, and michigan, 2000-10. JAMA Pediatr [Internet] 2016; 170(6) e154934; PMID:27043648; https://doi.org/10.1001/jamapediatrics.2015.4934. Available from: http://www.ncbi.nlm.nih.gov/pubmed/27043648. [DOI] [PMC free article] [PubMed] [Google Scholar]
- 8.Bradbury K, Sutcliffe A. The health of children born following assisted reproductive technologies. Paediatr Child Health (Oxford) [Internet] 2014; 24:172–6. Available from: http://www.sciencedirect.com/science/article/pii/S175172221300228X; https://doi.org/10.1016/j.paed.2013.09.004 [Google Scholar]
- 9.Palomba S, Homburg R, Santagni S, La Sala GB, Orvieto R. Risk of adverse pregnancy and perinatal outcomes after high technology infertility treatment: a comprehensive systematic review. Reprod Biol Endocrinol [Internet] 2016; 14:76. Available from: http://rbej.biomedcentral.com/articles/ 10.1186/s12958-016-0211-8; PMID:27814762; https://doi.org/10.1186/s12958-016-0211-8 [DOI] [PMC free article] [PubMed] [Google Scholar]
- 10.Hille ETM, Weisglas-Kuperus N, van Goudoever JB, Jacobusse GW, Ens-Dokkum MH, de Groot L, Wit JM, Geven WB, Kok JH, de Kleine MJ, et al.. Functional outcomes and participation in young adulthood for very preterm and very low birth weight infants: the Dutch Project on Preterm and Small for Gestational Age Infants at 19 years of age. Pediatrics [Internet] 2007; 120:e587–95. Available from: http://pediatrics.aappublications.org/cgi/doi/ 10.1542/peds.2006-2407; PMID:17766499; https://doi.org/10.1542/peds.2006-2407 [DOI] [PubMed] [Google Scholar]
- 11.Leijon I, Ingemansson F, Nelson N, Wadsby M, Samuelsson S. Reading deficits in very low birthweight children are associated with vocabulary and attention issues at the age of seven. Acta Paediatr Int J Paediatr 2016; 105:60–8; PMID:26098907; https://doi.org/10.1111/apa.13094 [DOI] [PMC free article] [PubMed] [Google Scholar]
- 12.Yliharsila H, Kajantie E, Osmond C, Forsen T, Barker DJ, Eriksson JG. Birth size, adult body composition and muscle strength in later life. Int J Obes (Lond) 2007; 31:1392–9; PMID:17356523; https://doi.org/10.1038/sj.ijo.0803612 [DOI] [PubMed] [Google Scholar]
- 13.Barker DJP. The Developmental Origins of Adult Disease. Eur J Epidemiol 2003; 18:733–6; PMID:12974544; https://doi.org/10.1023/A:1025388901248 [DOI] [PubMed] [Google Scholar]
- 14.Luke B, Stern JE, Hornstein MD, Kotelchuck M, Diop H, Cabral H, Declercq ER. Is the wrong question being asked in infertility research? J Assist Reprod Genet 2016; 33:3–8; PMID:26634257; https://doi.org/10.1007/s10815-015-0610-3 [DOI] [PMC free article] [PubMed] [Google Scholar]
- 15.Palomba S, Santagni S, Gibbins K, La Sala GB, Silver RM. Pregnancy complications in spontaneous and assisted conceptions of women with infertility and subfertility factors. A comprehensive review. Reprod Biomed Online [Internet] 2016; 33:612–28; PMID:27591135; https://doi.org/10.1016/j.rbmo.2016.08.007 [DOI] [PubMed] [Google Scholar]
- 16.Seggers J, De Walle HEK, Bergman JEH, Groen H, Hadders-Algra M, Bos ME, Hoek A, Haadsma ML. Congenital anomalies in offspring of subfertile couples: A registry-based study in the northern Netherlands. Fertil Steril [Internet] 2015; 103:1001–10.e3. Available from: https://doi.org/10.1016/j.fertnstert.2014.12.113; PMID:25624190; https://doi.org/10.1016/j.fertnstert.2014.12.113 [DOI] [PubMed] [Google Scholar]
- 17.Basso O, Baird DD. Subfertility was associated with increased risks of preterm delivery, low birthweight at term and cesarean delivery. Evidence-based Obstet Gynecol [Internet] 2004; 6:192–3. https://doi.org/10.1016/j.ebobgyn.2004.09.008 [Google Scholar]
- 18.Díaz P, Powell TL, Jansson T. The role of placental nutrient sensing in maternal-fetal resource allocation. Biol Reprod [Internet] 2014; 91:1–10. Available from: http://www.ncbi.nlm.nih.gov/pubmed/25122064; PMID:25122064; https://doi.org/10.1095/biolreprod.114.121798 [DOI] [PMC free article] [PubMed] [Google Scholar]
- 19.Sandovici I, Hoelle K, Angiolini E, Constância M. Placental adaptations to the maternal-fetal environment: Implications for fetal growth and developmental programming. Reprod Biomed Online 2012; 25:68–89; PMID:22560117; https://doi.org/10.1016/j.rbmo.2012.03.017 [DOI] [PubMed] [Google Scholar]
- 20.Reik W, Constância M, Fowden A, Anderson N, Dean W, Ferguson-Smith A, Tycko B, Sibley C. Regulation of supply and demand for maternal nutrients in mammals by imprinted genes. J Physiol 2003; 547:35–44; PMID:12562908; https://doi.org/10.1113/jphysiol.2002.033274 [DOI] [PMC free article] [PubMed] [Google Scholar]
- 21.Moore T. Review: Parent-offspring conflict and the control of placental function. Placenta [Internet] 2012; 33:S33–6. Available from: https://doi.org/ 10.1016/j.placenta.2011.11.016; PMID:22153682; https://doi.org/10.1016/j.placenta.2011.11.016 [DOI] [PubMed] [Google Scholar]
- 22.Jones PA. Functions of DNA methylation: islands, start sites, gene bodies and beyond. Nat Rev Genet [Internet] 2012; 13:484–92. Available from: http://www.ncbi.nlm.nih.gov/pubmed/22641018; PMID:22641018; https://doi.org/10.1038/nrg3230 [DOI] [PubMed] [Google Scholar]
- 23.Butler MG. Genomic imprinting disorders in humans: A mini-review. J Assist Reprod Genet 2009; 26:477–86; PMID:19844787; https://doi.org/10.1007/s10815-009-9353-3 [DOI] [PMC free article] [PubMed] [Google Scholar]
- 24.Koukoura O, Sifakis S, Spandidos DA. DNA methylation in the human placenta and fetal growth (review). Mol Med Rep 2012; 5:883–9; PMID:22294146; https://doi.org/10.3892/mmr.2012.763 [DOI] [PMC free article] [PubMed] [Google Scholar]
- 25.Turan N, Ghalwash MF, Katari S, Coutifaris C, Obradovic Z, Sapienza C. DNA methylation differences at growth related genes correlate with birth weight: a molecular signature linked to developmental origins of adult disease? BMC Med Genomics [Internet] 2012; 5:10. Available from: http://www.biomedcentral.com/1755-8794/5/10; PMID:22498030; https://doi.org/10.1186/1755-8794-5-10 [DOI] [PMC free article] [PubMed] [Google Scholar]
- 26.Li B, Chen S, Tang N, Xiao X, Huang J, Jiang F, Huang X, Sun F, Wang X. Assisted reproduction causes reduced fetal growth associated with downregulation of paternally expressed imprinted genes that enhance fetal growth in mice. Biol Reprod [Internet] 2016; 94:1–11. Available from: http://www.biolreprod.org/cgi/doi/ 10.1095/biolreprod.115.136051; PMID:26764349; https://doi.org/10.1095/biolreprod.115.136051 [DOI] [PubMed] [Google Scholar]
- 27.Kappil MA, Green BB, Armstrong DA, Sharp AJ, Lambertini L, Marsit CJ, Chen J. Placental expression profile of imprinted genes impacts birth weight. Epigenetics 2015; 10:842–9; PMID:26186239; https://doi.org/10.1080/15592294.2015.1073881 [DOI] [PMC free article] [PubMed] [Google Scholar]
- 28.Moore GE, Ishida M, Demetriou C, Al-olabi L, Leon LJ, Thomas AC, Abu-amero S, Frost JM, Stafford JL, Chaoqun Y, et al.. The role and interaction of imprinted genes in human fetal growth. Philos Trans R Soc Lond B Biol Sci 2015; 370:20140074; PMID:25602077; https://doi.org/10.1098/rstb.2014.0074 [DOI] [PMC free article] [PubMed] [Google Scholar]
- 29.Marsit CJ. Influence of environmental exposure on human epigenetic regulation. J Exp Biol [Internet] 2015; 218:71–9. Available from: http://www.ncbi.nlm.nih.gov/pubmed/25568453; PMID:25568453; https://doi.org/10.1242/jeb.106971 [DOI] [PMC free article] [PubMed] [Google Scholar]
- 30.Loke YJ, Galati JC, Saffery R, Craig JM. Association of in vitro fertilization with global and IGF2/H19 methylation variation in newborn twins. J Dev Orig Health Dis [Internet] 2015; 6:115–24. Available from: http://journals.cambridge.org/article_S2040174415000161%5Cnhttp://journals.cambridge.org/action/displayAbstract?fromPage=online&aid=9639532&fileId=S2040174415000161; PMID:25857739; https://doi.org/10.1017/S2040174415000161 [DOI] [PubMed] [Google Scholar]
- 31.Katari S, Turan N, Bibikova M, Erinle O, Chalian R, Foster M, Gaughan JP, Coutifaris C, Sapienza C. DNA methylation and gene expression differences in children conceived in vitro or in vivo. Hum Mol Genet 2009; 18:3769–78; PMID:19605411; https://doi.org/10.1093/hmg/ddp319 [DOI] [PMC free article] [PubMed] [Google Scholar]
- 32.Sakian S, Louie K, Wong EC, Havelock J, Kashyap S, Rowe T, Taylor B, Ma S. Altered gene expression of H19 and IGF2 in placentas from ART pregnancies. Placenta [Internet] 2015; 36:1100–5. Available from: https://doi.org/ 10.1016/j.placenta.2015.08.008; PMID:26386650; https://doi.org/10.1016/j.placenta.2015.08.008 [DOI] [PubMed] [Google Scholar]
- 33.Katagiri Y, Aoki C, Tamaki-Ishihara Y, Fukuda Y, Kitamura M, Matsue Y, So A, Morita M. Effects of assisted reproduction technology on placental imprinted gene expression. Obstet Gynecol Int [Internet] 2010; 2010:4–7; PMID:20706653; Available from: http://www.pubmedcentral.nih.gov/articlerender.fcgi?artid=2913850&tool=pmcentrez&rendertype=abstract; https://doi.org/10.1155/2010/437528 [DOI] [PMC free article] [PubMed] [Google Scholar]
- 34.Huntriss JD, Picton HM. Epigenetic consequences of assisted reproduction and infertility on the human preimplantation embryo. Hum Fertil (Camb) [Internet] 2008; 11:85–94. Available from: http://informahealthcare.com/doi/abs/ 10.1080/14647270802116250; PMID:18569063; https://doi.org/10.1080/14647270802116250 [DOI] [PubMed] [Google Scholar]
- 35.Kobayashi H, Hiura H, John RM, Sato A, Otsu E, Kobayashi N, Suzuki R, Suzuki F, Hayashi C, Utsunomiya T, et al.. DNA methylation errors at imprinted loci after assisted conception originate in the parental sperm. Eur J Hum Genet [Internet] 2009; 17:1582–91. Available from: http://www.pubmedcentral.nih.gov/articlerender.fcgi?artid=2845511&tool=pmcentrez&rendertype=abstract; PMID:19471309; https://doi.org/10.1038/ejhg.2009.68 [DOI] [PMC free article] [PubMed] [Google Scholar]
- 36.Qu F, Wang FF, Yin R, Ding GL, El-prince M, Gao Q, Shi BW, Pan HH, Huang YT, Jin M, et al.. A molecular mechanism underlying ovarian dysfunction of polycystic ovary syndrome: Hyperandrogenism induces epigenetic alterations in the granulosa cells. J Mol Med 2012; 90:911–23; PMID:22349439; https://doi.org/10.1007/s00109-012-0881-4 [DOI] [PubMed] [Google Scholar]
- 37.Stilley JA, Birt JA, Sharpe-Timms KL. Cellular and molecular basis for endometriosis-associated infertility. Cell Tissue Res 2012; 349:849–62; PMID:22298022; https://doi.org/10.1007/s00441-011-1309-0 [DOI] [PMC free article] [PubMed] [Google Scholar]
- 38.Paczkowski M, Schoolcraft WB, Krisher RL. Dysregulation of methylation and expression of imprinted genes in oocytes and reproductive tissues in mice of advanced maternal age. J Assist Reprod Genet 2015; 32:713–23; PMID:25800995; https://doi.org/10.1007/s10815-015-0463-9 [DOI] [PMC free article] [PubMed] [Google Scholar]
- 39.Paquette AG, Houseman EA, Green BB, Lesseur C, Armstrong DA, Lester B, Marsit CJ. Regions of variable DNA methylation in human placenta associated with newborn neurobehavior. Epigenetics 2016; 11:603–13; PMID:27366929; https://doi.org/10.1080/15592294.2016.1195534 [DOI] [PMC free article] [PubMed] [Google Scholar]
- 40.Song S, Ghosh J, Mainigi M, Turan N, Weinerman R, Truongcao M, Coutifaris C, Sapienza C. DNA methylation differences between in vitro- and in vivo-conceived children are associated with ART procedures rather than infertility. Clin Epigenetics [Internet] 2015; 7:41. Available from: http://www.clinicalepigeneticsjournal.com/content/7/1/41; PMID:25901188; https://doi.org/10.1186/s13148-015-0071-7 [DOI] [PMC free article] [PubMed] [Google Scholar]
- 41.Nelissen EC, Dumoulin JC, Daunay A, Evers JL, Tost J, Van Montfoort AP. Placentas from pregnancies conceived by IVF/ICSI have a reduced DNA methylation level at the H19 and MEST differentially methylated regions. Hum Reprod 2013; 28:1117–26; PMID:23343754; https://doi.org/10.1093/humrep/des459 [DOI] [PubMed] [Google Scholar]
- 42.Huntriss JD, Hemmings KE, Hinkins M, Rutherford AJ, Sturmey RG, Elder K, Picton HM. Variable imprinting of the MEST gene in human preimplantation embryos. Eur J Hum Genet [Internet] 2012; 21:40–7. Available from: https://doi.org/10.1038/ejhg.2012.102; PMID:22763377; https://doi.org/10.1038/ejhg.2012.102 [DOI] [PMC free article] [PubMed] [Google Scholar]
- 43.Choux C, Carmignac V, Bruno C, Sagot P, Vaiman D, Fauque P. The placenta: phenotypic and epigenetic modifications induced by Assisted Reproductive Technologies throughout pregnancy. Clin Epigenetics [Internet] 2015; 7:87. Available from: http://www.pubmedcentral.nih.gov/articlerender.fcgi?artid=4546204&tool=pmcentrez&rendertype=abstract; PMID:26300992; https://doi.org/10.1186/s13148-015-0120-2 [DOI] [PMC free article] [PubMed] [Google Scholar]
- 44.Team RC R: A language and environment for statistical computing. [Internet]. 2016; Available from: https://www.r-project.org/ [Google Scholar]
- 45.Leek JT, Johnson WE, Parker HS, Jaffe AE, and Storey JD. The sva package for removing batch effects and other unwanted variation in high-throughput experiments. Bioinformatics 2012; PMID:22257669; https://doi.org/10.1093/bioinformatics/bts034 [DOI] [PMC free article] [PubMed] [Google Scholar]
- 46.Sekhon JS. Multivariate and propensity score matching software with automated balance optimization: the matching package for R. J Stat Softw 2011; 42 1:52; https://doi.org/10.18637/jss.v042.i07 [Google Scholar]
- 47.Ritchie ME, Phipson B, Wu D, Hu Y, Law CW, Shi W, Smyth GK. limma powers differential expression analyses for RNA-sequencing and microarray studies. Nucleic Acids Res 2015; 43:e47; PMID:25605792; https://doi.org/10.1093/nar/gkv007 [DOI] [PMC free article] [PubMed] [Google Scholar]
- 48.Wickhan H, Chang W, RStudio. ggplot2: Create Elegant Data Visualisations Using the Grammar of Graphics. Accessed 6/21/2017 https://cran.r-project.org/web/packages/ggplot2/index.html
- 49.Harrell FE, Dupont C. Hmisc [Internet]. 2016; Available from: https://cran.r-project.org/web/packages/Hmisc/index.html
Associated Data
This section collects any data citations, data availability statements, or supplementary materials included in this article.