

ABSTRACT
The 5-methylcytosine (5mC) modification regulates multiple cellular processes and is faithfully maintained following DNA replication. In addition to DNA methyltransferase (DNMT) family proteins, ubiquitin-like PHD and ring finger domain-containing protein 1 (UHRF1) plays an important role in the maintenance of 5mC levels. Loss of UHRF1 abolishes 5mC in cells and leads to embryonic lethality in mice. Interestingly, UHRF1 has a paralog, UHRF2, that has similar sequence and domain architecture, but its biologic function is not clear. Here, we have generated Uhrf2 knockout mice and characterized the role of UHRF2 in vivo. Uhrf2 knockout mice are viable, but the adult mice develop frequent spontaneous seizures and display abnormal electrical activities in brain. Despite no global DNA methylation changes, 5mC levels are decreased at certain genomic loci in the brains of Uhrf2 knockout mice. Therefore, our study has revealed a unique role of UHRF2 in the maintenance of local 5mC levels in brain that is distinct from that of its paralog UHRF1.
Keywords: Brain, 5-methylcytosine, seizure
Introduction
The 5-methylcytosine (5mC) mark is the most studied modification on DNA. Recent studies have discovered 5mC derivatives, including 5-hydroxymethylcytosine (5hmC), 5-formylcytosine (5fC), and 5-carboxylcytosine (5caC).1-3 The 5mC modification regulates multiple cellular processes, including gene transcription; 5hmC, the most abundant 5mC derivative, has a unique genomic distribution and is implied in transcription regulation.4-9 Loss of 5mC causes defective brain functions.10 Levels of 5hmC are high in brain4,11-13; deregulation of 5hmC also impairs brain functions.14-16
The 5 mC modification is established and faithfully maintained after replication by DNMT family proteins.17,18 In addition, studies in the past decade have revealed that UHRF1 is important for the maintenance of 5mC. UHRF1 recognizes hemimethylated DNA and targets DNMT1 to methylate the nascent DNA during replication.19,20 The 5mC modification is converted into 5hmC by TET enzymes1; however, it is not clear how 5hmC is stably maintained after DNA replication. In addition to binding 5mC, UHRF1 binds 5hmC with similar affinity.21,22 It is still not clear if UHRF1 directly maintains 5hmC levels.
UHRF1 has a paralog, UHRF2, which has similar primary sequence and domain architecture with UHRF1. Although both of them bind 5mC and interact with DNMTs,23 UHRF2 is functionally distinct from UHRF1. Uhrf1 knockout ES cells have shown abolished 5mC levels, suggesting that UHRF2 could not maintain 5mC levels by itself. In addition, overexpression of UHRF2 could not rescue the 5mC defect in Uhrf1 knockout ES cells.23 This suggests that UHRF2 alone is not sufficient for maintaining 5mC levels, but UHRF2 might still contribute to some extent to this process. Recent studies have revealed that UHRF2 is a specific 5hmC reader that has higher affinity to 5hmC than to 5mC.22,24 In addition, UHRF2 has a specific binding partner, ZNF618, that regulates its function as a 5hmC reader in vivo.25 Despite its binding to 5hmC, it is still not clear if UHRF2 is important for maintaining 5hmC levels. Therefore, the function of UHRF2 in regulating 5mC and 5hmC levels remains to be established.
UHRF1 is highly expressed in stem cells,26 and absence of UHRF1 is incompatible with embryonic development.27 On the contrary, UHRF2 is low in stem cells and increases when cells differentiate,26 which suggests that UHRF2 is important for different cell types. In this study, we have disrupted the function of UHRF2 in mice and found that these mice are viable. However, the adult mice develop frequent spontaneous seizures and display abnormal neural activities. UHRF2 is dispensable for global 5mC and 5hmC levels but maintains 5mC levels at certain genomic loci. Therefore, our studies have revealed the physiologic function of UHRF2 that is distinct from UHRF1.
Results
Uhrf2 knockout mice are viable and develop spontaneous seizures
To study the physiologic function of UHRF2, we disrupted UHRF2 in mice using a gene trap approach. The gene-trap allele (Gt) contained a splice acceptor and a β-geo cassette inserted into intron 2 of the Uhrf2 locus, which lead to the production of a fusion protein comprising the N-terminus of UHRF2 and the β-geo protein (Fig. 1a). The fusion protein lacks most functional domains of UHRF2 such as Tudor, PHD, SRA, or RING domains. Therefore, it is likely that this fusion protein is not a functional UHRF2. Unlike Uhrf1 knockout mice, which were embryonic lethal,27 Uhrf2 gene trap homozygous mice (Gt/Gt) were viable (Fig. 1b). Except for the fusion protein, no full length UHRF2 was produced in these mice; UHRF1 expression was not altered (Fig. 1c). Therefore, the Gt allele is a null allele for UHRF2. Therefore, we refer to Uhrf2 Gt/Gt mice as Uhrf2 knockout mice.
Figure 1.
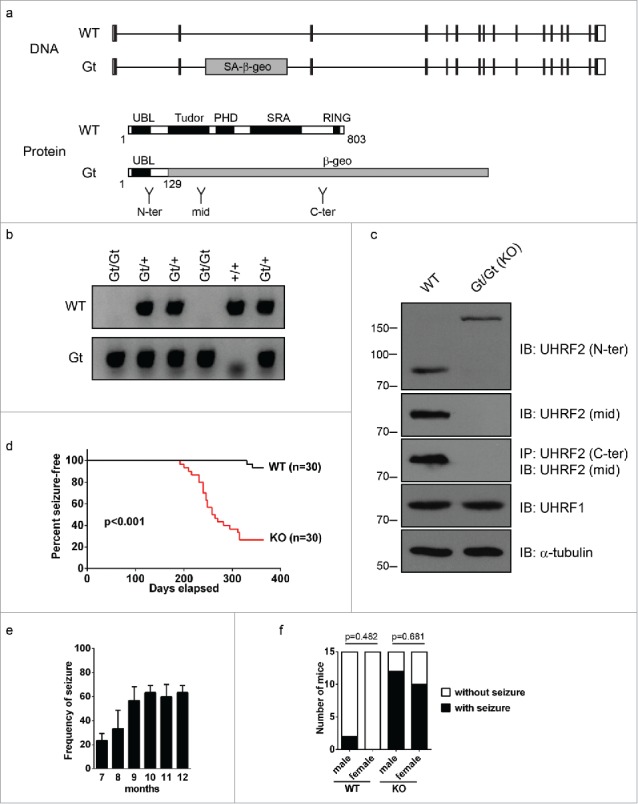
Uhrf2 knockout mice develop spontaneous seizures. (A) Uhrf2 gene structure, domain structure, and the insertion position of the gene trap vector are shown. The gene trap vector contains a splicing acceptor (SA) and β-geo cassette, and the insertion leads to the production of a fusion protein comprising the N-terminus of UHRF2 and the β-geo protein. The antibody recognition regions of 3 UHRF2 antibodies (N-terminal, middle, and C-terminal) are shown. (B) A typical example of genotyping result for a litter of mice from intercross of Uhrf2 heterozygous mice is shown. PCR products were separated by agarose gel electrophoresis. (C) Cell lysates of mouse embryonic fibroblasts (MEF) from wild type (WT) and Uhrf2 knockout (KO) mice were immunoblotted (IB) with antibodies as indicated. The C-terminal antibody is not good for IB and is used for immunoprecipitation (IP) only. Intact UHRF2 is absent in Uhrf2 knockout MEF. The higher band detected by N-terminal antibody represents the fusion protein product between the N-terminus of UHRF2 and β-geo encoded by the gene trap vector. (D) A cohort of Uhrf2 WT and KO was monitored for seizure onsets every 3 d for 1 y. The date of the first seizure onset observed for each mouse was recorded and is summarized in the Kaplan-Meier curve. (E) The frequency of seizure in Uhrf2 knockout mice in each month of age was calculated according to Material and Methods and is summarized. (F) Seizure onset in male and females are shown. Fisher's exact test was performed to test the difference of seizure onset rate between males and females in both WT or Uhrf2 knockout mice and P-values are shown.
Uhrf2 knockout mice developed into adulthood without having obvious growth defects. However, frequent spontaneous seizures were observed in these mice as early as 6 months (Fig. 1d, Supplementary Video S1). In sharp contrast to wild type mice, ∼70% of Uhrf2 knockout mice developed spontaneous seizures within 1 y (Fig. 1d). The seizures were mild in younger mice (6–7 months) and became more severe in older mice (>8 months). The frequency of seizures also increased with age and reached a plateau at 8 months (Fig. 1e). No sex bias was observed in seizure onsets (Fig. 1f).
Uhrf2 knockout mice have abnormal electrical activities in brain
To examine the cause for the frequent seizures in Uhrf2 knockout mice, we analyzed the electrical activities in the brains of these mice using electroencephalography (EEG). A typical spontaneous seizure in Uhrf2 knockout mice was recorded (Fig. 2a). It had a clear evolution beginning, including paroxysmal rhythmic high-amplitude spike or spike-wave activity, associated with behavioral arrest and subtle facial automatisms. This was followed by high frequency, low amplitude clonic jerking. Generalized high amplitude waves, slow in frequency, then developed, associated with rearing and violent tonic-clonic movements. The seizure concluded with a period of continuous rhythmic theta activity coinciding with a cessation of behavioral activity. Interestingly, EEG monitoring also revealed that Uhrf2 knockout mice displayed frequent interictal high-amplitude spike discharges even when no seizure was observed (Fig. 2b), which were not observed in wild type mice. These observations suggested that there were abnormal electrical activities in the brains of Uhrf2 knockout mice. To search for the cause for these abnormalities, we analyzed the brains of these mice, but no obvious weight or morphological differences between wild type and Uhrf2 knockout mice were observed (Fig. 2c). Careful examinations of brain sections did not reveal significant defects in neurogenesis in Uhrf2 knockout mice either (Fig. 2d). Therefore, the seizure onsets in Uhrf2 knockout mice were not caused by major structural abnormalities in brain.
Figure 2.
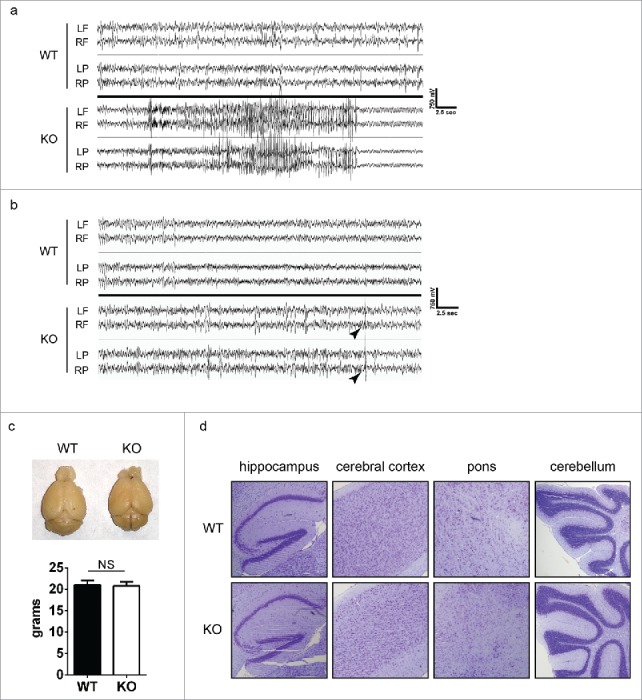
Uhrf2 knockout mice have abnormal neural activities. (A) EEG recording of a typical seizure in Uhrf2 knockout mice is shown. EEG recording of WT mice is shown as a control. LF and RF refer to left and right frontal cortex; LP and RP refer to left and right posterior cortex. (B) EEG recording of a typical interictal high-amplitude spike discharge (arrow head) in Uhrf2 knockout mice is shown. EEG recording of WT mice is shown as a control. (C) A typical picture of brains from 6-month Uhrf2 wild type and knockout mice is shown. The weights of brains are summarized. (D) Sagittal sections of brains from 6-month-old Uhrf2 wild type and knockout mice after Nissl staining are shown.
UHRF2 maintains 5mC levels at certain genomic loci in brain
Previous studies have shown that abnormal 5mC levels in brain induce spontaneous seizure onsets, without having noticeable impact on brain morphology.28,29 Studies have also shown that alteration of 5hmC levels impairs brain functions.14-16 Since UHRF2 binds both 5mC and 5hmC, we examined if 5mC and 5hmC levels were altered in the brains of Uhrf2 knockout mice. Dot blotting with genomic DNA isolated from brains did not show obvious difference in global 5mC or 5hmC levels between wild type and Uhrf2 knockout mice (Fig. 3a). To reveal potential local 5mC and 5hmC changes at certain genomic loci, methylated/hydroxymethylated DNA immunoprecipitation (MeDIP/hMeDIP) was performed using brain DNA from 4 pairs of littermates (to minimize variations between individuals, immunoprecipitated products were pooled for high-throughput sequencing). In agreement with the dot blotting data, similar amount of 5mC and 5hmC could be immunoprecipitated using DNA from wild type and Uhrf2 knockout mice (Fig. 3b). Quantitative comparison of 5mC and 5hmC levels at individual genomic loci revealed no change in 5mC and 5hmC levels at most genomic loci between wild type and Uhrf2 knockout mice (Fig. 3c-d). However, differences were observed in around 10% of total genomic loci analyzed. The numbers of loci with increased (11.5%) and decreased (10.4%) 5hmC levels were similar in Uhrf2 knockout mice (decrease/increase = 0.9) (Fig. 3c), which suggested that loss of UHRF2 did not have a specific impact on 5hmC levels. On the contrary, most loci with changed 5mC levels had decreased 5mC in Uhrf2 knockout mice (10.4% decrease and 3.7% increase, decrease/increase = 2.8) (Fig. 3d). This observation suggested that UHRF2 maintained 5mC levels in certain genomic loci in brain. Further analysis revealed that UHRF2 maintained 5mC levels at regions near transcription start sites (TSS) and distal regions similarly (Fig. 3e-f). Interestingly, gene ontology analyses of loci with decreased 5mC levels, but not those with increased 5mC levels, revealed many ion transport genes (Fig. 3g, Fig. S1). Since 5mC at promoters regulates gene transcription, we examined several ion transport genes (Cacna1e, Grin1, Kcnk2, and Kctd7) with significant decrease in 5mC levels at their promoters (Fig. 3h-i). MeDIP verified that 5mC was decreased at loci within promoters of these genes in Uhrf2 knockout mice (Fig. 3j). Consistently, chromatin immunoprecipitation (ChIP) analyses showed that occupancy of MeCP2, a key 5mC binding protein, was reduced along with decreased 5mC at these promoters (Fig. 3k). These results suggested that UHRF2 was indeed important for 5mC levels at these loci. This observation was also consistent with previous studies that depletion of MeCP2 in brain induced seizure onset.30,31
Figure 3.

Uhrf2 knockout mice have decreased 5mC at certain genomic loci in brain. (A) Dot blotting of serial dilutions of brain DNA from Uhrf2 wild type and knockout mice was performed using anti-5mC and anti-5hmC antibody. (B) After MeDIP/hMeDIP, immunoprecipitated products and input DNA were end processed and ligated to Illumina-compatible adaptors. qPCR was performed using the same primers for generating sequencing libraries. (C) MA plot of relative hMeDIP peak intensities (KO/WT) at all peak positions is shown. Red dots represent increased 5hmC peaks in KO and green dots represent decreased 5hmC peaks in KO. The ratio between the number of peaks decreased and increased in KO is summarized. (D) MA plot of relative MeDIP peak intensities (KO/WT) at all peak positions is shown. Red dots represent increased 5mC peaks in KO and green dots represent decreased 5mC peaks in KO. The ratio between the number of peaks decreased and increased in KO is summarized. (E) The distributions of increased, unchanged, and decreased 5mC peaks near TSS region and in other regions are shown. T-test was performed and no significant difference was identified between peak distribution in 2 regions. (F) For all peaks with 5mC changes, absolute values of the fold-change were calculated. The averages of the log-transformed fold change for peaks near TSS and in other regions are shown. (G) Gene ontology examination was performed for all genes with decreased 5mC in KO. Top 12 GO categories are shown. (H) and (I) Typical UCSC genome browser views of 5mC peaks are shown. Two typical examples of decreased 5mC at the promoters of Kcnk2 and Kctd7 are shown. (J) 5mC levels at the promoters of 4 ion transport genes were quantified by MeDIP. Results between WT and KO are compared. (K) Localization at the promoters of 4 ion transport genes were quantified by ChIP. Results between WT and KO were compared.
UHRF2 regulates multiple gene expression in brain
Reduction of 5mC at promoters of ion transport genes might directly affect the expression of these genes. Surprisingly, qRT-PCR analyses did not reveal significant expression changes of the 4 ion transport genes tested (Fig. 4a). We noticed that for genomic loci where 5mC levels were decreased, 5mC levels were often unaltered at adjacent genomic loci, as shown in the promoters of Kckn2 and Kctd7 (Fig. 2f-g). Therefore, 5mC decrease at most individual genomic loci, even at promoters, was not sufficient to cause significant transcriptional changes. To search for gene expression changes that were responsible for the seizure onsets in Uhrf2 knockout mice, we performed RNA-Sequencing (RNA-Seq) using brains from wild type and Uhrf2 knockout mice. The same 4 pairs of littermates were used for MeDIP/hMeDIP-Seq. Consistent with the absence of major structural abnormalities, gene expression profiles were largely similar between wild type and Uhrf2 knockout mice. Among differentially expressed genes, 186 genes were significantly increased and 62 genes were significantly decreased in Uhrf2 knockout mice (Fig. 4b, Table S1). We failed to identify correlations between genes with expression changes and those with 5mC/5hmC changes that could account for the seizure onsets in Uhrf2 knockout mice (Table S2–3). Interestingly, gene ontology analyses revealed that the genes with increased expression were highly enriched in neural functions (Fig. 4c). In particular, many genes were involved in ion transport and synaptic transmission, which were tightly related with electrical activities in brain and seizure onsets. On the contrary, no neural pathways were identified from genes with decreased expression (Fig. S2). This intriguing observation suggested that the seizure phenotype was likely caused by genes with increased expression in Uhrf2 knockout mice, which was consistent with the predominant decrease in 5mC levels at certain genomic loci. Of all genes with increased expression, 64 genes were directly related to neural functions (Fig. 4d) within which genes with direct link to seizure onsets can be identified and divided into several groups (Fig. 4e). We noticed that expression of most of these genes was only modestly increased in Uhrf2 knockout mice, indicating that seizure onsets might not be due to the disturbance of a single gene but a synergistic effect of the altered expression of many genes. To verify the RNA-Seq analyses, we performed qRT-PCR to examine the expression of individual genes within each group and found that these genes were indeed significantly increased in Uhrf2 knockout mice (Fig. 4f). Therefore, the elevated expression of a group of neural genes was likely the cause for the seizure onset in Uhrf2 knockout mice.
Figure 4.
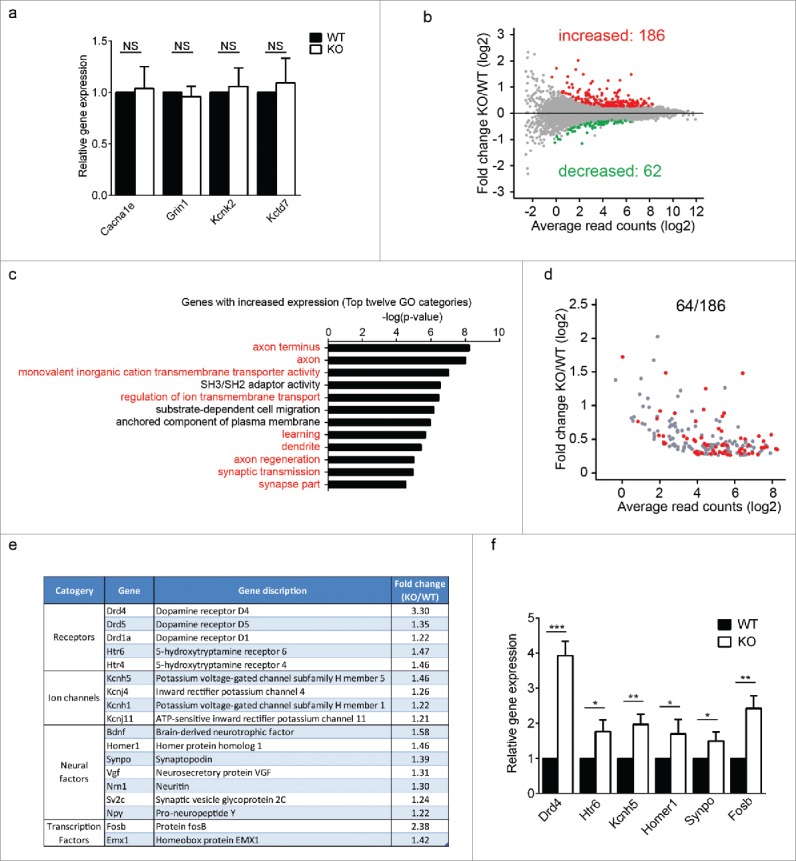
Uhrf2 knockout mice have multiple gene expression increase in brain. (A) Expressions of 4 ion transport genes are compared between WT and KO. (B) MA plot of relative gene expression changes (KO/WT) is shown. Red dots represent increased expression in KO; green dots represent decreased expression in KO. (C) Gene ontology examination was performed for all genes with increased expression in KO. Top 12 GO categories are shown. (D) Among all 186 genes with increased expression in KO, 64 genes are directly related to neural functions and are highlighted in the MA plot. (E) Genes with increased expression and direct link to seizure onsets are listed and divided into several groups. (F) Expressions of several genes with direct link to seizure onsets are compared between WT and KO.
Discussion
In this study, we have revealed that UHRF2 maintains 5mC levels in certain genomic loci in brain. Loss of UHRF2 causes spontaneous seizure onsets. For the first time, our study demonstrates the functional difference between UHRF1 and UHRF2. While UHRF1 is required for maintenance of global 5mC levels,27,32 UHRF2 only maintains 5mC levels at specific genomic loci. This is consistent with the phenotypes observed in mice: global decrease of 5mC levels in Uhrf1 knockout mice causing early embryonic lethality, and mild 5mC defect in Uhrf2 knockout mice being compatible with embryonic development and causing subtle defects in brain. This also agrees with previous gene expression studies that indicate that UHRF2 is highly expressed in somatic cells,26 suggesting that the function of UHRF2 is unlikely required for global 5mC levels that are important in all cells, including stem cells. Instead, the most striking phenotype in Uhrf2 knockout mice occurs in brain, which mainly consists differentiated cells. It is not yet clear why Uhrf2 knockout in mice specifically affect the function of the brain. One possibility is that UHRF2 is highly expressed in brain, as reported by others,26 and plays a more important role in regulating 5mC levels in brain.
It is noteworthy that the 5mC decrease at gene promoters in Uhrf2 knockout mice does not lead to significant gene expression changes. Since UHRF2 does not regulate global 5mC levels, it is possible that not the entire promoter regions have decreased 5mC. For example, for genomic loci where 5mC levels were decreased, 5mC levels were often unaltered at adjacent genomic loci. In addition, 5mC beyond gene promoters also contributes to the gene expression.33 Although we did not identify the direct correlation between changes in 5mC levels and gene expression in Uhrf2 knockout mice, the predominant 5mC decrease and increased transcription still suggest that these 2 events are linked. The decrease in 5mC level at UHRF2 direct target genes might cause subtle expression changes; however, these genes, coding, for example, for transcription factors, could regulate the transcription of other genes and cause more dramatic expression change in genes that are not direct targets of UHRF2.
It remains unresolved why UHRF2 only affects 5mC levels at certain genomic loci. It is possible that UHRF1 and UHRF2 have overlapping and different distributions over the genome. UHRF1 and UHRF2 are similarly enriched at H3K9me3-rich pericentric heterochromatin,26,34 which suggests that they have common binding sites. Since UHRF1 and UHRF2 are different in their SRA domains22 and perhaps in other domains as well, it is possible that UHRF2 has unique binding positions that are not occupied by UHRF1. In addition, we have recently identified a zinc finger protein, ZNF618, that regulates chromatin binding of UHRF2 but not UHRF1.25 It is possible that ZNF618 restricts UHRF2-dependent 5mC to specific genomic loci, which is distinct from UHRF1-dependent global 5mC. In this respect, the UHRF2-ZNF618 complex mimics the G9a-GLP-PRD1-BF1 complex, in which the zinc finger protein PRD1-BF1 facilitates the recruitment of G9a and GLP to certain genomic loci and regulates G9a/GLP-dependent histone H3 methylation and gene transcription at these loci.35 Therefore, it would be interesting to develop ChIP-grade antibodies and compare the genome-wide distributions of UHRF1 and UHRF2.
UHRF2 has recently been shown to be a specific 5hmC reader,24 which raises the possibility that UHRF2 regulates 5hmC levels. In this study, we did not observe a specific impact of UHRF2 deficiency on 5hmC levels. This is not surprising since readers of an epigenetic mark are not always required for the maintenance of that epigenetic mark. Another 5hmC reader, MeCP2, binds 5hmC but is not required for maintaining 5hmC levels.36 Therefore, the biologic significance of the binding between UHRF2 and 5hmC remains to be established.
In summary, we have revealed a unique role of UHRF2 in the maintenance of 5mC levels that is distinct from its paralog UHRF1. This finding extends our understanding of the maintenance of 5mC in the brain. It has been shown that 5mC levels in the brain increase gradually with age,37 but its biologic function is unclear. Our study demonstrates that UHRF2-depedent 5mC is important for preventing seizure onsets in adult mice, which could underlie the importance of 5mC in the adult brain.
Materials and methods
Animals
Uhrf2 gene trap ES cells AD0406 were purchased from BayGenomics. Blastocyst injection was performed by University of Michigan transgenic core. Chimeras were mated with C57BL/6J mice to produce Uhrf2 heterozygous mice, which were subsequently backcrossed to C57BL/6J background 4 times. Uhrf2 knockout mice were then generated by intercrossing Uhrf2 heterozygous mice. All animal procedures were performed in accordance with protocols approved by the University Committee on Use and Care of Animals of the University of Michigan. Animals were kept under a constant 12 h light/dark cycle with access to food and water ad libitum.
Seizure onsets monitoring
A cohort of 30 mice (15 males and 15 females) of each genotype (wild type or Uhrf2 knockout) was monitored for seizure onsets every 3 d (10 times per month in average) for 1 y. The date for every seizure onset was recorded. For each mouse, the date of the first seizure onset observed was used generate the Kaplan-Meier curve. The frequency of seizures in each month of age was calculated by dividing the number of seizure onsets observed in that month by 10 (times of monitoring).
Electrode placement and video/EEG monitoring
Procedures for affixing subdural electrodes were performed as described previously.38,39 Mice were anesthetized with a ketamine/xylazine mix and placed in a stereotaxic mouse adaptor (Stoelting). Six holes were made into the skull using a #56 gauge steel bit. Electrodes were positioned and fastened (left and right frontal, left and right parietal, one cerebellar, and one reference over the sinus cavity) using mounting screws (E363/20; PlasticsOne, Roanoke, VA). The sockets were fitted into a 6-pin electrode pedestal and the entire apparatus was secured with dental cement (Stoelting). Animals received buprenorphine subcutaneously for 3 d. After 3 d for recovery, animals were monitored for 7 d by video/EEG recording (Ceegraph Vision; Bio-logic System Corporation). Recordings were sampled at 256 Hz and concurrent video was analyzed offline and synced with EEG data by an observer blinded to the genotypes. Interictal epileptiform discharges (IEDs) were defined as waveforms lasting 20–200 ms and measuring at least 700 µV in amplitude. Seizures were identified as paroxysmal rhythmic activity (slow wave bursts, spikes/sharp waves or fast activity) that persisted for a minimum of 10 s and displayed an unequivocal evolution in frequency and morphology, and was typically followed by postictal suppression before return to baseline activity.
Paraffin section and Nissl staining
The brains were harvested after being perfusion fixed with 4% PFA for 5 min and post-fixed overnight in 4% PFA. The brains were dehydrated and infiltrated with paraffin. Sections (5 μm) were cut, re-hydrated, and stained with 1% cresyl violet dissolved in 1% acetic acid. The sections were then dehydrated and mounted.
Antibodies
Anti-mouse UHRF2 N-terminal (amino acids 1–141) and C-terminal (amino acids 616–803) polyclonal antibodies were raised in rabbit. The following antibodies were purchased: anti-UHRF1 (Santa Cruz, sc-373750), anti-UHRF2 (Middle, Santa Cruz, sc- 398953), anti-5mC (Millipore, MABE146), anti-5hmC (Active Motif, 39769), anti-MeCP2 (Active Motif, 61285), and anti-α-tubulin (Genscript, A01410).
Methylated and hydroxymethylated DNA immunoprecipitation (MeDIP and hMeDIP)
DNA was extracted from brain using PureLink Genomic DNA Mini Kit (Life Technologies) and sonicated to 200–500 bp long fragments. DNA was denatured at 95°C for 5 min and quickly chilled on ice water for 10 min. MeDIP and hMeDIP were performed using standard protocols. Each MeDIP reaction contains 1 µg DNA, 3 µg anti-5mC antibody, 3 µg rabbit anti-mouse IgG (Jackson ImmunoResearch), and 50 µL protein A beads. Each hMeDIP reaction contains 1 µg DNA, 3 µl anti-5hmC antibody, and 50 µL protein A beads. Methylated/hydroxymethylated DNA and input DNA were end processed using Quick Blunting Kit and dA-Tailing Module, and ligated to Illumina-compatible adaptors. The DNA was then amplified by PCR using barcode-containing primers. The products were pooled for sequencing.
RNA extraction, reverse transcription, and quantitative real-time PCR
RNA was extracted using Trizol (Life Technologies). Reverse transcription was performed using Superscript III reverse transcriptase (Life Technologies) to generate cDNA. Quantitative real-time PCR was performed using StepOne systems (Applied Biosystems). Power SYBR green PCR master mix was used to prepare for the reaction, and the relative expression was analyzed using 2−ΔΔCt method with GAPDH as control. Primer sequences are shown in Table S4.
High-throughput sequencing and data analysis
MeDIP and hMeDIP sequencing was performed using HiSeq 2500 (Illumina) by Harvard biopolymers facility. The resulted 50 bp single-ended short reads were mapped to mouse genome (mm10) using Bowtie2 (version 2.1.0) with default parameters.40 5mC/5 hmC peaks were called using MACS241 with false discovery rate < 0.001. A consensus peak set was generated from the union of wild type (WT) and knockout (KO) sample peaks. For each consensus peak region, read counts were extracted from both MeDIP/hMeDIP and input samples. Normalization factors were calculated for each sample using PePr.42 The normalized WT and KO signals for each window were defined as normalized MeDIP/hMeDIP read counts subtracted by normalized input read counts. Window of significant difference between normalized WT and KO signals was identified based on a Poisson test of P-value < 1.0E−5. Peaks were annotated by the mouse genome mm10 using Hypergeometric Optimization of Motif EnRichment (HOMER) version 4.6.43 Promoter region was defined as −5 kb to TSS. RNA sequencing was performed using HiSeq 2500 (Illumina) by University sequencing core. The resulted 50 bp single-ended short reads were mapped to mouse genome (mm10) using Tophat (v 2.0.9).44 Normalization and differentially expressed gene calling were performed using the Bioconductor package edgeR.45,46 Gene Ontology (GO) terms analysis was performed by the Database for Annotation, Visualization and Integrated Discovery (DAVID) version 6.7,47,48 and Pathway Analysis using Logistic Regression (LRpath).49 The sequencing data are deposited in the GEO database under accession number GSE98362.
Chromatin immunoprecipitation
Brains were cut into small pieces (around 2–3 mm) and fixed with 1% formaldehyde solution. The fixation was terminated 15 min later by adding glycine solution to 125 mM final concentration. After washing with 1 × PBS, cells were dissociated from brain pieces using a glass douncer and collected by centrifugation at 1000 × g. Cells were lysed in lysis buffer (1% SDS, 10mM EDTA and 50mM Tris, pH 8.1) and sonicated to shear the DNA in chromatin to 200–500 bp. The lysates were diluted 10 times using dilution buffer (0.01% SDS, 1.1% Triton X- 100, 1.2 mM EDTA, 16.7 mM Tris-HCl, pH 8.1, 167 mM NaCl) and subjected to immunoprecipitation according to standard protocols. For MeCP2 ChIP, each reaction contained chromatin from 80 mg brain sample, 3 µL anti-MeCP2 antibody, and 50 µL protein A beads.
Western blotting
Cells were lysed with NTN300. The lysate was subjected to polyacrylamide gel electrophoresis. Western blotting was performed according to standard procedures. Full scans of all cropped Western blotting pictures are presented in Fig. S3.
Statistical analysis
For each experiment, at least 3 biologic replicates were used. For each plot, means and standard variations were shown. Two-tailed student t-test was used all statistical analysis.
Supplementary Material
Disclosure of potential conflicts of interest
No potential conflicts of interest were disclosed.
Acknowledgments
We thank University of Michigan transgenic core for blastocyst injection of ES cells. This work was funded by National Key R&D Program of China (2016YFC1000600 to L.L.), National Natural Science Foundation of China (81471494 to L.L. and 81602263 to Y.L.), Zhejiang Provincial Natural Science Foundation of China (LR15H040001 to L.L.), Open Research Funds of the State Key Laboratory of Genetic Engineering, Fudan University (SKLGE-1504 to L.L.), National Institutes of Health (CA130899, CA132755, CA187209, and GM108647 to X.Y. and NS058585 to J.P.). X.Y. is a recipient of Era of Hope Scholar Award from the Department of Defense and a research scholar of Leukemia and Lymphoma Society.
References
- 1.Tahiliani M, Koh KP, Shen Y, Pastor WA, Bandukwala H, Brudno Y, Agarwal S, Iyer LM, Liu DR, Aravind L, et al.. Conversion of 5-methylcytosine to 5-hydroxymethylcytosine in mammalian DNA by MLL partner TET1. Science 2009; 324:930-5; PMID:19372391; https://doi.org/ 10.1126/science.1170116 [DOI] [PMC free article] [PubMed] [Google Scholar]
- 2.Ito S, Shen L, Dai Q, Wu SC, Collins LB, Swenberg JA, He C, Zhang Y. Tet proteins can convert 5-methylcytosine to 5-formylcytosine and 5-carboxylcytosine. Science 2011; 333:1300-3; PMID:21778364; https://doi.org/ 10.1126/science.1210597 [DOI] [PMC free article] [PubMed] [Google Scholar]
- 3.He YF, Li BZ, Li Z, Liu P, Wang Y, Tang Q, Ding J, Jia Y, Chen Z, Li L, et al.. Tet-mediated formation of 5-carboxylcytosine and its excision by TDG in mammalian DNA. Science 2011; 333:1303-7; PMID:21817016; https://doi.org/ 10.1126/science.1210944 [DOI] [PMC free article] [PubMed] [Google Scholar]
- 4.Song CX, Szulwach KE, Fu Y, Dai Q, Yi C, Li X, Li Y, Chen CH, Zhang W, Jian X, et al.. Selective chemical labeling reveals the genome-wide distribution of 5-hydroxymethylcytosine. Nat Biotechnol 2011; 29:68-72; PMID:21151123; https://doi.org/ 10.1038/nbt.1732 [DOI] [PMC free article] [PubMed] [Google Scholar]
- 5.Wu H, D'Alessio AC, Ito S, Wang Z, Cui K, Zhao K, Sun YE, Zhang Y. Genome-wide analysis of 5-hydroxymethylcytosine distribution reveals its dual function in transcriptional regulation in mouse embryonic stem cells. Genes Dev 2011; 25:679-84; PMID:21460036; https://doi.org/ 10.1101/gad.2036011 [DOI] [PMC free article] [PubMed] [Google Scholar]
- 6.Ficz G, Branco MR, Seisenberger S, Santos F, Krueger F, Hore TA, Marques CJ, Andrews S, Reik W. Dynamic regulation of 5-hydroxymethylcytosine in mouse ES cells and during differentiation. Nature 2011; 473:398-402; PMID:21460836; https://doi.org/ 10.1038/nature10008 [DOI] [PubMed] [Google Scholar]
- 7.Xu Y, Wu F, Tan L, Kong L, Xiong L, Deng J, Barbera AJ, Zheng L, Zhang H, Huang S, et al.. Genome-wide regulation of 5 hmC, 5 mC, and gene expression by Tet1 hydroxylase in mouse embryonic stem cells. Mol Cell 2011; 42:451-64; PMID:21514197; https://doi.org/ 10.1016/j.molcel.2011.04.005 [DOI] [PMC free article] [PubMed] [Google Scholar]
- 8.Pastor WA, Pape UJ, Huang Y, Henderson HR, Lister R, Ko M, McLoughlin EM, Brudno Y, Mahapatra S, Kapranov P, et al.. Genome-wide mapping of 5-hydroxymethylcytosine in embryonic stem cells. Nature 2011; 473:394-7; PMID:21552279; https://doi.org/ 10.1038/nature10102 [DOI] [PMC free article] [PubMed] [Google Scholar]
- 9.Stroud H, Feng S, Morey Kinney S, Pradhan S, Jacobsen SE. 5-Hydroxymethylcytosine is associated with enhancers and gene bodies in human embryonic stem cells. Genome Biol 2011; 12:R54; PMID:21689397; https://doi.org/ 10.1186/gb-2011-12-6-r54 [DOI] [PMC free article] [PubMed] [Google Scholar]
- 10.Feng J, Zhou Y, Campbell SL, Le T, Li E, Sweatt JD, Silva AJ, Fan G. Dnmt1 and Dnmt3a maintain DNA methylation and regulate synaptic function in adult forebrain neurons. Nat Neurosci 2010; 13:423-30; PMID:20228804; https://doi.org/ 10.1038/nn.2514 [DOI] [PMC free article] [PubMed] [Google Scholar]
- 11.Globisch D, Munzel M, Muller M, Michalakis S, Wagner M, Koch S, Bruckl T, Biel M, Carell T. Tissue distribution of 5-hydroxymethylcytosine and search for active demethylation intermediates. PLoS One 2010; 5:e15367; PMID:21203455; https://doi.org/ 10.1371/journal.pone.0015367 [DOI] [PMC free article] [PubMed] [Google Scholar]
- 12.Kriaucionis S, Heintz N. The nuclear DNA base 5-hydroxymethylcytosine is present in Purkinje neurons and the brain. Science 2009; 324:929-30; PMID:19372393; https://doi.org/ 10.1126/science.1169786 [DOI] [PMC free article] [PubMed] [Google Scholar]
- 13.Munzel M, Globisch D, Bruckl T, Wagner M, Welzmiller V, Michalakis S, Muller M, Biel M, Carell T. Quantification of the sixth DNA base hydroxymethylcytosine in the brain. Angewandte Chemie 2010; 49:5375-7; PMID:20583021; https://doi.org/ 10.1002/anie.201002033 [DOI] [PubMed] [Google Scholar]
- 14.Zhang RR, Cui QY, Murai K, Lim YC, Smith ZD, Jin S, Ye P, Rosa L, Lee YK, Wu HP, et al.. Tet1 regulates adult hippocampal neurogenesis and cognition. Cell Stem Cell 2013; 13:237-45; PMID:23770080; https://doi.org/ 10.1016/j.stem.2013.05.006 [DOI] [PMC free article] [PubMed] [Google Scholar]
- 15.Kaas GA, Zhong C, Eason DE, Ross DL, Vachhani RV, Ming GL, King JR, Song H, Sweatt JD. TET1 controls CNS 5-methylcytosine hydroxylation, active DNA demethylation, gene transcription, and memory formation. Neuron 2013; 79:1086-93; PMID:24050399; https://doi.org/ 10.1016/j.neuron.2013.08.032 [DOI] [PMC free article] [PubMed] [Google Scholar]
- 16.Rudenko A, Dawlaty MM, Seo J, Cheng AW, Meng J, Le T, Faull KF, Jaenisch R, Tsai LH. Tet1 is critical for neuronal activity-regulated gene expression and memory extinction. Neuron 2013; 79:1109-22; PMID:24050401; https://doi.org/ 10.1016/j.neuron.2013.08.003 [DOI] [PMC free article] [PubMed] [Google Scholar]
- 17.Li E, Bestor TH, Jaenisch R. Targeted mutation of the DNA methyltransferase gene results in embryonic lethality. Cell 1992; 69:915-26; PMID:1606615; https://doi.org/ 10.1016/0092-8674(92)90611-F [DOI] [PubMed] [Google Scholar]
- 18.Okano M, Bell DW, Haber DA, Li E. DNA methyltransferases Dnmt3a and Dnmt3b are essential for de novo methylation and mammalian development. Cell 1999; 99:247-57; PMID:10555141; https://doi.org/ 10.1016/S0092-8674(00)81656-6 [DOI] [PubMed] [Google Scholar]
- 19.Bashtrykov P, Jankevicius G, Jurkowska RZ, Ragozin S, Jeltsch A. The UHRF1 protein stimulates the activity and specificity of the maintenance DNA methyltransferase DNMT1 by an allosteric mechanism. J Biol Chem 2014; 289:4106-15; PMID:24368767; https://doi.org/ 10.1074/jbc.M113.528893 [DOI] [PMC free article] [PubMed] [Google Scholar]
- 20.Berkyurek AC, Suetake I, Arita K, Takeshita K, Nakagawa A, Shirakawa M, Tajima S. The DNA methyltransferase Dnmt1 directly interacts with the SET and RING finger-associated (SRA) domain of the multifunctional protein Uhrf1 to facilitate accession of the catalytic center to hemi-methylated DNA. J Biol Chem 2014; 289:379-86; PMID:24253042; https://doi.org/ 10.1074/jbc.M113.523209 [DOI] [PMC free article] [PubMed] [Google Scholar]
- 21.Frauer C, Hoffmann T, Bultmann S, Casa V, Cardoso MC, Antes I, Leonhardt H. Recognition of 5-hydroxymethylcytosine by the Uhrf1 SRA domain. PLoS One 2011; 6:e21306; PMID:21731699; https://doi.org/ 10.1371/journal.pone.0021306 [DOI] [PMC free article] [PubMed] [Google Scholar]
- 22.Zhou T, Xiong J, Wang M, Yang N, Wong J, Zhu B, Xu RM. Structural basis for hydroxymethylcytosine recognition by the SRA domain of UHRF2. Mol Cell 2014; 54:879-86; PMID:24813944; https://doi.org/ 10.1016/j.molcel.2014.04.003 [DOI] [PubMed] [Google Scholar]
- 23.Zhang J, Gao Q, Li P, Liu X, Jia Y, Wu W, Li J, Dong S, Koseki H, Wong J. S phase-dependent interaction with DNMT1 dictates the role of UHRF1 but not UHRF2 in DNA methylation maintenance. Cell Res 2011; 21:1723-39; PMID:22064703; https://doi.org/ 10.1038/cr.2011.176 [DOI] [PMC free article] [PubMed] [Google Scholar]
- 24.Spruijt CG, Gnerlich F, Smits AH, Pfaffeneder T, Jansen PW, Bauer C, Munzel M, Wagner M, Muller M, Khan F, et al.. Dynamic readers for 5-(hydroxy)methylcytosine and its oxidized derivatives. Cell 2013; 152:1146-59; PMID:23434322; https://doi.org/ 10.1016/j.cell.2013.02.004 [DOI] [PubMed] [Google Scholar]
- 25.Liu Y, Zhang B, Kuang H, Korakavi G, Lu LY, Yu X. Zinc finger protein 618 regulates the function of UHRF2 (Ubiquitin-like with PHD and ring finger domains 2) as a specific 5-hydroxymethylcytosine reader. J Biol Chem 2016; 291:13679-88; PMID:27129234; https://doi.org/ 10.1074/jbc.M116.717314 [DOI] [PMC free article] [PubMed] [Google Scholar]
- 26.Pichler G, Wolf P, Schmidt CS, Meilinger D, Schneider K, Frauer C, Fellinger K, Rottach A, Leonhardt H. Cooperative DNA and histone binding by Uhrf2 links the two major repressive epigenetic pathways. J Cell Biochem 2011; 112:2585-93; PMID:21598301; https://doi.org/ 10.1002/jcb.23185 [DOI] [PMC free article] [PubMed] [Google Scholar]
- 27.Sharif J, Muto M, Takebayashi S, Suetake I, Iwamatsu A, Endo TA, Shinga J, Mizutani-Koseki Y, Toyoda T, Okamura K, et al.. The SRA protein Np95 mediates epigenetic inheritance by recruiting Dnmt1 to methylated DNA. Nature 2007; 450:908-12; PMID:17994007; https://doi.org/ 10.1038/nature06397 [DOI] [PubMed] [Google Scholar]
- 28.Williams-Karnesky RL, Sandau US, Lusardi TA, Lytle NK, Farrell JM, Pritchard EM, Kaplan DL, Boison D. Epigenetic changes induced by adenosine augmentation therapy prevent epileptogenesis. J Clin Invest 2013; 123:3552-63; PMID:23863710; https://doi.org/ 10.1172/JCI65636 [DOI] [PMC free article] [PubMed] [Google Scholar]
- 29.Machnes ZM, Huang TC, Chang PK, Gill R, Reist N, Dezsi G, Ozturk E, Charron F, O'Brien TJ, Jones NC, et al.. DNA methylation mediates persistent epileptiform activity in vitro and in vivo. PLoS One 2013; 8:e76299; PMID:24098468; https://doi.org/ 10.1371/journal.pone.0076299 [DOI] [PMC free article] [PubMed] [Google Scholar]
- 30.Guy J, Hendrich B, Holmes M, Martin JE, Bird A. A mouse Mecp2-null mutation causes neurological symptoms that mimic Rett syndrome. Nat Genet 2001; 27:322-6; PMID:11242117; https://doi.org/ 10.1038/85899 [DOI] [PubMed] [Google Scholar]
- 31.Chen RZ, Akbarian S, Tudor M, Jaenisch R. Deficiency of methyl-CpG binding protein-2 in CNS neurons results in a Rett-like phenotype in mice. Nat Genet 2001; 27:327-31; PMID:11242118; https://doi.org/ 10.1038/85906 [DOI] [PubMed] [Google Scholar]
- 32.Bostick M, Kim JK, Esteve PO, Clark A, Pradhan S, Jacobsen SE. UHRF1 plays a role in maintaining DNA methylation in mammalian cells. Science 2007; 317:1760-4; PMID:17673620; https://doi.org/ 10.1126/science.1147939 [DOI] [PubMed] [Google Scholar]
- 33.Lou S, Lee HM, Qin H, Li JW, Gao Z, Liu X, Chan LL, Kl Lam V, So WY, Wang Y, et al.. Whole-genome bisulfite sequencing of multiple individuals reveals complementary roles of promoter and gene body methylation in transcriptional regulation. Genome Biol 2014; 15:408; PMID:25074712; https://doi.org/ 10.1186/s13059-014-0408-0 [DOI] [PMC free article] [PubMed] [Google Scholar]
- 34.Karagianni P, Amazit L, Qin J, Wong J. ICBP90, a novel methyl K9 H3 binding protein linking protein ubiquitination with heterochromatin formation. Mol Cell Biol 2008; 28:705-17; PMID:17967883; https://doi.org/ 10.1128/MCB.01598-07 [DOI] [PMC free article] [PubMed] [Google Scholar]
- 35.Gyory I, Wu J, Fejer G, Seto E, Wright KL. PRDI-BF1 recruits the histone H3 methyltransferase G9a in transcriptional silencing. Nat Immunol 2004; 5:299-308; PMID:14985713; https://doi.org/ 10.1038/ni1046 [DOI] [PubMed] [Google Scholar]
- 36.Mellen M, Ayata P, Dewell S, Kriaucionis S, Heintz N. MeCP2 binds to 5 hmC enriched within active genes and accessible chromatin in the nervous system. Cell 2012; 151:1417-30; PMID:23260135; https://doi.org/ 10.1016/j.cell.2012.11.022 [DOI] [PMC free article] [PubMed] [Google Scholar]
- 37.Hernandez DG, Nalls MA, Gibbs JR, Arepalli S, van der Brug M, Chong S, Moore M, Longo DL, Cookson MR, Traynor BJ, et al.. Distinct DNA methylation changes highly correlated with chronological age in the human brain. Hum Mol Genet 2011; 20:1164-72; PMID:21216877; https://doi.org/ 10.1093/hmg/ddq561 [DOI] [PMC free article] [PubMed] [Google Scholar]
- 38.Lee CH, Javed D, Althaus AL, Parent JM, Umemori H. Neurogenesis is enhanced and mossy fiber sprouting arises in FGF7-deficient mice during development. Mol Cell Neurosci 2012; 51:61-67; PMID:22889808; https://doi.org/ 10.1016/j.mcn.2012.07.010 [DOI] [PMC free article] [PubMed] [Google Scholar]
- 39.Kehrl JM, Sahaya K, Dalton HM, Charbeneau RA, Kohut KT, Gilbert K, Pelz MC, Parent J, Neubig RR. Gain-of-function mutation in Gnao1: A murine model of epileptiform encephalopathy (EIEE17)? Mamm Genome 2014; 25:202-10; PMID:24700286; https://doi.org/ 10.1007/s00335-014-9509-z [DOI] [PMC free article] [PubMed] [Google Scholar]
- 40.Langmead B, Trapnell C, Pop M, Salzberg SL. Ultrafast and memory-efficient alignment of short DNA sequences to the human genome. Genome Biol 2009; 10:R25; PMID:19261174; https://doi.org/ 10.1186/gb-2009-10-3-r25 [DOI] [PMC free article] [PubMed] [Google Scholar]
- 41.Zhang Y, Liu T, Meyer CA, Eeckhoute J, Johnson DS, Bernstein BE, Nusbaum C, Myers RM, Brown M, Li W, et al.. Model-based analysis of ChIP-Seq (MACS). Genome Biol 2008; 9:R137; PMID:18798982; https://doi.org/ 10.1186/gb-2008-9-9-r137 [DOI] [PMC free article] [PubMed] [Google Scholar]
- 42.Zhang Y, Lin YH, Johnson TD, Rozek LS, Sartor MA. PePr: A peak-calling prioritization pipeline to identify consistent or differential peaks from replicated ChIP-Seq data. Bioinformatics 2014; 30:2568-75; PMID:24894502; https://doi.org/ 10.1093/bioinformatics/btu372 [DOI] [PMC free article] [PubMed] [Google Scholar]
- 43.Heinz S, Benner C, Spann N, Bertolino E, Lin YC, Laslo P, Cheng JX, Murre C, Singh H, Glass CK. Simple combinations of lineage-determining transcription factors prime cis-regulatory elements required for macrophage and B cell identities. Mol Cell 2010; 38:576-89; PMID:20513432; https://doi.org/ 10.1016/j.molcel.2010.05.004 [DOI] [PMC free article] [PubMed] [Google Scholar]
- 44.Trapnell C, Pachter L, Salzberg SL. TopHat: Discovering splice junctions with RNA-Seq. Bioinformatics 2009; 25:1105-11; PMID:19289445; https://doi.org/ 10.1093/bioinformatics/btp120 [DOI] [PMC free article] [PubMed] [Google Scholar]
- 45.Robinson MD, McCarthy DJ, Smyth GK. edgeR: A bioconductor package for differential expression analysis of digital gene expression data. Bioinformatics 2010; 26:139-40; PMID:19910308; https://doi.org/ 10.1093/bioinformatics/btp616 [DOI] [PMC free article] [PubMed] [Google Scholar]
- 46.Robinson MD, Smyth GK. Moderated statistical tests for assessing differences in tag abundance. Bioinformatics 2007; 23:2881-7; PMID:17881408; https://doi.org/ 10.1093/bioinformatics/btm453 [DOI] [PubMed] [Google Scholar]
- 47.Huang da W, Sherman BT, Lempicki RA. Systematic and integrative analysis of large gene lists using DAVID bioinformatics resources. Nat Protoc 2009; 4:44-57; PMID:19131956; https://doi.org/ 10.1038/nprot.2008.211 [DOI] [PubMed] [Google Scholar]
- 48.Huang da W, Sherman BT, Lempicki RA. Bioinformatics enrichment tools: Paths toward the comprehensive functional analysis of large gene lists. Nucleic Acids Res 2009; 37:1-13; PMID:19033363; https://doi.org/ 10.1093/nar/gkn923 [DOI] [PMC free article] [PubMed] [Google Scholar]
- 49.Kim JH, Karnovsky A, Mahavisno V, Weymouth T, Pande M, Dolinoy DC, Rozek LS, Sartor MA. LRpath analysis reveals common pathways dysregulated via DNA methylation across cancer types. BMC Genomics 2012; 13:526; PMID:23033966; https://doi.org/ 10.1186/1471-2164-13-526 [DOI] [PMC free article] [PubMed] [Google Scholar]
Associated Data
This section collects any data citations, data availability statements, or supplementary materials included in this article.