

Abstract
Most cancer patients, including patients with breast cancer, experience multiple symptoms simultaneously while receiving active treatment. Some symptoms tend to occur together and may be related, such as hot flashes and night sweats. Co-occurring symptoms may have a multiplicative effect on patients’ functioning, mental health, and quality of life. Symptom clusters in the context of oncology were originally described as groups of three or more related symptoms. Some authors have suggested symptom clusters may have practical applications, such as the formulation of more effective therapeutic interventions that address the combined effects of symptoms rather than treating each symptom separately. Most studies that have sought to identify clusters in breast cancer survivors have relied on traditional research studies. Social media, such as online health-related forums, contain a bevy of user-generated content in the form of threads and posts, and could be used as a data source to identify and characterize symptom clusters among cancer patients. The present study seeks to determine patterns of symptom clusters in breast cancer survivors derived from both social media and research study data using improved K-Medoid clustering. A total of 50,426 publicly available messages were collected from Medhelp.com and 653 questionnaires were collected as part of a research study. The network of symptoms built from social media was sparse compared to that of the research study data, making the social media data easier to partition. The proposed revised K-Medoid clustering helps to improve the clustering performance by re-assigning some of the negative-ASW (average silhouette width) symptoms to other clusters after initial K-Medoid clustering. This retains an overall non-decreasing ASW and avoids the problem of trapping in local optima. The overall ASW, individual ASW, and improved interpretation of the final clustering solution suggest improvement. The clustering results suggest that some symptom clusters are consistent across social media data and clinical data, such as gastrointestinal (GI) related symptoms, menopausal symptoms, mood-change symptoms, cognitive impairment and pain-related symptoms. We recommend an integrative approach taking advantage of both data sources. Social media data could provide context for the interpretation of clustering results derived from research study data, while research study data could compensate for the risk of lower precision and recall found using social media data.
Index Terms: Breast cancer symptom clusters, K-Medoid clustering, clustering method
I. INTRODUCTION
RECENT years, social media platforms such as Facebook, Twitter, and LinkedIn have drawn increasing attention from both industry and academia. The emergence of social media has enabled information to be disseminated much more widely than ever before in a variety of formats. Moreover, the fact that social media intertwines so closely with people’s everyday activity makes it a vivid reflection of real life, thus presenting an intriguing data source for researchers to explore, understand, and use as the basis for making scientific discoveries. Social media allows individuals with medical concerns or problems to request, receive, and offer social support [1].
Social media generates an enormous amount of content that can be explored in detail. Some of the field of study to which social media data have been applied include symptom development, drug effects, and intervention outcomes. Focusing on patients’ perspectives, this line of research attempts to characterize the real-time feedback from patients through their narratives in online social media, and to uncover facts and patterns not identified described or predicted previously using only research study data.
Despite the enticing prospects, utilizing social media data in biomedical research is challenging. Unlike research studies, where data are collected from participants in systematically designed clinical experiments, the content generated by patients is spontaneous in nature. In addition, the language used by participants may not overlap with the vocabulary of healthcare professionals. This observation necessitates the mapping of users’ narratives to standard terminology [2][3]. Little work has been done to compare data derived from social media with more conventional data sources such as research studies. Such analyses could lead to a triangulated understanding of reality, and interesting interpretations may come out of the overlaps and contrasts of results.
The present paper proposes using two data sources, a research study and an online forum, to investigate symptom clusters in breast cancer survivors. We firs propose an improved K-Medoid algorithm to generate separate cluster patterns for both data sources, and then analyze overlaps and discrepancies in the results. Finally, possible interpretations of the results are given.
The paper is organized as follows: section 2 reviews previous work in symptom clustering using social media data and research study data. Strengths and weakness of utilizing each data source are summarized and analyzed. Section 3 introduces the method for the comparative symptom clustering, including description of the data sources and data analysis. Section 4 reports the results of the analysis. Section 5 is a detailed discussion for the results and its underlying interpretations.
LITERATURE REVIEW
A. General use of social media in health-related research
Social media has been incorporated into medical and healthcare research in many ways. Much work has focused on the exploration of information extracted from social media using a variety of statistical methods and data mining techniques. Taurob et al used machine learning based classifier to differentiate health-related texts from general texts extracted from social media [4]. They found that such an approach was significantly better compared to existing methods of document classification that rely on “bags-of-words.” Sarker et al utilized supervised classification approaches to identify texts pertinent to adverse drug reactions (ADR) on Twitter and DailyStrength [5]. Benton et al identified ADRs (adverse drug reactions) from posts on medical message boards through drug-event co-occurrence analysis, which covered a majority of the ADRs listed on drug labels [6]. Yang et al utilized association mining and Proportional Reporting Ratios to identify ADRs from posts generated by users of social media [7]. Sarker et al introduced a model for ADR detection by selecting NLP-based (natural language processing) features extracted from social media texts. The proposed model utilizes multiple corpuses for training and was shown to improve accuracy [5]. Webster et al presented a new system, HyGen, for translational research, which incorporates both pharmacological databases and social network data. The system is able to identify new knowledge with pseudo-relevance feedback and optimized seed selection [8].
Another application of social media in health-related research is the development of health intervention and disease management approaches on social media platforms. Merolli et al reviewed existing research efforts on chronic disease management using social media, and argue that social media has played a positive role in chronic disease management, especially in psychosocial management. They also emphasize that the affordances of social media must be further investigated [9]. Bull et al found that social media could be plausibly used as intervention on behalf of sexual health in youth, though further investigation into the effects of social media on youth behaviors is needed [10]. Korda et al examined the evidence for using social media to promote health and change behavior, and argued that more research is needed to better understand the effectiveness of various social media platforms [11]. This could lead to the development of guidelines for promoting health through social media.
There is already research underway regarding the design of specific health-related social media features. Subirats et al designed and tested a new social network called “Circle-of-Health,” which features an automatic process of collecting and representing knowledge to users. They found the mutual sharing of experiences on their platform to be helpful for patients seeking to gain new personal knowledge [12]. Chira et al presented a prototype social system called Living Profile designed specifically for teenagers with special healthcare needs [13]. Pratt et al reviewed research in CSCW (computer-supported cooperative work) and suggest recommendations for the design of CSCW platforms in medical care [14].
B. Symptom clustering using clinical data
Symptom clustering is a hot topic in medical research for cancer treatment. A symptom cluster has been define as consisting of two or more symptoms that are related to each other and that occur together [15]. Although there is no definitive evidence suggesting a biological basis for symptom clusters [16], use of symptom clusters could bring utility to clinical trials by helping practitioners evaluate the effects of interventions on multiple symptoms [15].
Many oncology patients experience multiple symptoms simultaneously. In a recent study of persons with advanced cancer newly admitted to palliative care, the median number of symptoms reported was eleven [18]. Some of these symptoms are likely related to each other and may be considered to form a symptom cluster. Symptoms may be related in various ways, such as sharing a common etiology, interacting and influencing one another, or sharing a common variance [19]. For example, the symptoms of pain, fatigue, and sleep disturbance have been reported to form a symptom cluster [17]. Symptoms may interact synergistically to the detriment of patients and predict significant future morbidity [20]. Pain may compromise one’s ability to sleep, leading to increased fatigue and other problems. Ideally, symptom management strategies would consider the relationships between symptoms rather than viewing symptoms as isolated events. By recognizing symptom clusters, providers may be more likely to detect symptoms that frequently co-occur and intervene sooner or address them preemptively. Understanding the relationships between symptoms may lead to more efficient management of symptoms and reduce polypharmacy compared to individual treatment of symptoms. If symptoms do share a common etiology, addressing any underlying cause may alleviate multiple symptoms simultaneously.
The majority of research in symptom clustering utilizes data from research studies and medical databases. For example, Walsh et al analyzed a clinical data set to cluster 25 cancer-related symptoms into seven clusters using an agglomerative hierarchical clustering method [21]. Fan et al utilized principal component analysis to identify three symptom clusters in clinical surveys of patients with metastatic cancer [22]. Also relying on clinical surveys, Tsai et al used explorative factor analysis to identify fi e symptom clusters among cancer patients. Nonhierarchical clustering was used to divide subjects into six groups with differing symptom cluster profile [23]. Laird used clinical survey datasets to identify pain, depression, and fatigue as a symptom cluster among patients with cancer cachexia [24].
More specifically, a considerable amount of research has used research study data to examine symptom cluster patterns among breast cancer patients. Bender used multiple symptom assessment instruments to collect data from breast cancer patients across three phases of the disease. They found multiple clusters for each group and noted that fatigue and mood problems occurred most commonly [25]. Glaus et al focused on a menopausal symptom cluster and found fatigue often co-occurred with symptoms such as hot flashes/sweats tiredness, weight gain, vaginal dryness, and decreased sexual interest [26]. Kim et al found both a psychoneurological and upper GI cluster using a secondary analysis, and investigated a link between cancer treatment and symptoms [27].
C. Vision of incorporating social media and healthcare practices
To our knowledge, little research has used social media data to investigate symptom cluster patterns in breast cancer. Even less research has compared clusters derived from social media with those derived from a research study. In general, studies regarding this topic so far have focused on visionary discussion of future application of incorporating the two platforms and information sources.
First, healthcare social networks could become a supplement of traditional patient care to offer social contexts for patients, which was missing in traditional medical health portals. As advocated in the notion of “people-centered care”, it is beyond only treating the disease that the healthcare was targeted at [28]. Within the social media context, the old communication model of “one-to-one” has been transformed to “many-to-many” among patients and healthcare practitioners [29]. This could benefit patients in so many aspects, such as self education, informational needs, emotional support, following latest research, etc. .[30]. Social media could be a more useful tool in challenging settings such as chronicle condition management .[31] and psychological intervention [10, 32] where social engagement and mutual support is vital.
Second, the big data prospectus allows social media to generate patient self-reported data at incredible speed everyday, where endless analytic tools could be applied to discover useful information and even knowledge. For example, online communities such as PatientsLikeMe, CureTogether, Med-Help, TuDiabetes have millions of patient self-reported data, and some of them are under exploration to be incorporated into PCHR platforms [33].
It is believed in the present study that using both data sources could expand insight into symptom clusters beyond what either source offers alone. By way of analogy, combing Google Flu Trend with CDC data led to better prediction of fl patterns than when either source was used alone [34]. The validity of social media data is not without doubt and there are important differences compared to carefully-conducted scientific research studies. Specifically, data collection processes are very different. However, using both sources of information may expand understanding of the nature of symptom clusters and lead to the identification of previously unknown phenomena.
II. Breast Cancer Symptom Clustering
A. Data sources
There are two types of data sources in the present study. The firs data source is a research study of breast cancer survivors. The participants were all women, 25 years old or older, diagnosed with stage I, II, or III breast cancer. Participants were recruited from two academic cancer centers in U.S., and completed questionnaires answered within 8-months of their diagnosis. A total of 653 women participants completed the baseline questionnaires. The demographics of the participants are presented in Table 1. The questionnaires included a symptom checklist that covered 39 distinct symptoms potentially related to breast cancer. Participants were asked to rate symptoms on a four point scale, where “1” represents “symptom did not occur,” “2” represents “Symptom occurred and was mild,” 3 represents “Symptom occurred and was moderate,” and 4 represents “Symptom occurred and was severe”. More details related to this study were reported in [35].
TABLE I.
Demographics of participants (Age Groups, Stages of Breast Cancer and Treatment Categories)
| Age groups | |
|---|---|
| Age range | Number of participants |
| 25~44 | 132 |
| 45~54 | 209 |
| 55~64 | 167 |
| 65~74 | 102 |
| 75+ | 43 |
| Stages of breast cancer | |
|---|---|
| Stage | Stages of participants |
| I | 34.1% |
| II | 55.3% |
| III | 10.6% |
| Treatment Categories | |
|---|---|
| Treatment | Percentage of Participants |
| Chemotherapy | 81% |
| Radiation | 86% |
The second source of data is collected from a healthcare social media website called Medhelp.com. Medhelp.com is a rapidly growing social networking site with over 12 million active users each month. On Medhelp.com, patients could ask questions, receive advices, share experiences and support each other. More specifically, there are numerous forums on Medhelp.com, each for a typical type of disease or health condition, such as Breast Cancer, Depression, Diarrhea, etc. Each forum is maintained by both establishers and volunteer users, who are familiar with this specific illness, or have experiences with it themselves. Typically when a user has questions, he or she could firs target the right forum that best matches his or her questions in mind, and then initiate a post to discuss the problem with appropriate details. Other users could comment under this post to share about relevant information, their own opinion, or simply emotional support. The comments could in turn trigger a consecutive conversation between the user who initiates the post and the commenters, or between commenters. Another social-media feature of Med-help.com is that it provides a profile page for each user, where user could present his or her personal information, such as interests, status, trackers, journals, initiated posts, communities involved, etc. Moreover, users could “friend” each other as in other social website. This could be beneficial to users in many aspects, such as promoting deeper and more private conversations between interested users, and maintaining a longer-term support for each other. Medhelp.com could be seen as a channel to connect patients. The narratives in the posts and comments are an invaluable source to explore, for that the content generated by patients are self-organized and interactive, which is not so pervasive and available before the emergence of social media.
Given an appropriate permission from the management of Medhelp.com, we crawled 50,426 publicly available messages generated by 12,991 users (including both posts and comments) in the forum “Brest Cancer” from October 1st, 2006 to September 21th, 2014. We firs transformed the JSON format of text data into structured records, each one representing either a post or comment, with the information of the user ID, timestamp, and the content of the message. We took each message as a unit and computed the co-occurrence frequency of each possible pair of symptoms to create a co-occurrence matrix, which was used in the symptom clustering process. In order to detect the symptoms embedded in the unstructured text of social media, we utilized the Consumer Health Vocabulary (CHV) list as a controlled vocabulary [36]. The CHV list provided a mapping from patient vocabulary to professional vocabulary. In CHV list, each symptom is associated with a series of terms. For example, “mood changes” as a standard professional phrase is described with patient phrases of “altered moods”, “altering mood”, “change mood”, “change moods”, “changes mood” etc. that are frequently used by patients. We scan each message to test whether the message contains any of the terms related to a certain symptom. If one or more term exists, the symptom is considered to occur.
There is a discrepancy between the data structure of clinical trial data and the social media data. While social media data contains the co-occurrence of every pair of symptoms, it might be difficult to differentiate the level of severity of certain symptom from natural language. In the contrary, clinical trial data not only contains the co-occurrence information of each pair of symptoms within each participant, it also provides the information of the severity of the symptom in that participant. We transformed the clinical trial data from 4-scale to binary scale in order to have a consistent input format for measuring the similarity between symptoms in both data source. As a result, there were three possible transformations following the three assumptions are described below:
T1: scale of 1 to binary 0, and scale of 2–4 to binary 1.
Assumption: a symptom is considered to occur as long as it occurred, regardless of its severity;
T2: scale of 1–2 to binary 0, and scale of 3–4 to binary 1.
Assumption: a symptom is only considered to occur when it reaches at least “mild” severity;
T2: scale of 1–3 to binary 0, and scale of 4 to binary 1. Assumption: a symptom is only considered to occur when it reaches “severe” severity.
We propose the three possible transformations with the consideration that it may not be clear at which level of severity patients may bring up the symptoms in their narratives in social media. The threshold for a patient to feel it worth mentioning a symptom in the message may vary from individual to individual, and not limited only to the factor of severity. Thus an arbitrary binary transformation from the 4-scale clinical trial data may be inappropriate for the two to compare. Therefore we explore all three transformations T1, T2 and T3, and compare the respective clustering with social media data.
Given the same form of co-occurrence between social media data and clinical trial data, we defin the symptom similarity with the following formulation:
| (1) |
The Similarity[symptom(i), symptom(j)] is the similarity between two symptoms i and j. Co-occurrence[symptom(i), symptom(j)] is the frequency that two symptoms i and j co-occur within each unit (a message in social media data or a patient’s response in clinical trial data). Occurrence[symptom(i)] or Occurrence[symptom(j)] is the frequency of symptom i or j occurs in the data source. Given the symptom similarity formulation, we computed a matrix for all 39 symptoms. For the clinical trial data, we computed three 39×39 matrices, one for each transformation T1, T2 and T3. For the social media data, since only 33 of the 39 symptoms were identifie in the user-generated messages according to the CHV lists, we computed a 33×33 matrix S.
B. Improved K-Medoid Clustering
Similar to K-Means clustering, clustering is a partitioning method that partitions n items into K clusters. K-Medoid takes the member with the minimum overall cost within a cluster as the centroid of the cluster for the next iteration partitioning while K-Means takes the mean of the members within a cluster as the virtual centroid of the cluster for the next iteration partitioning [37]. In this work, we adopt the K-Medoid clustering because the medoid can be considered as an anchoring point for interpreting the entire cluster.
The Average Silhouette Width (ASW) is used in K-Medoid clustering to determine the number of clusters. Average Silhouette Width is an indicator that characterizes how well the current partitioning is, by looking at a measure involving the ratio of dissimilarity of a member with all other members within a cluster, and dissimilarity of a member with members within the next most appropriate cluster [38]. When a partitioning is indeed appropriate, the Average Silhouette Width is higher and closer to 1; when the partitioning is not quite right, the Average Silhouette Width is closer to −1. A value of 0 of Average Silhouette Width indicates that either partitioning is equivalent.
The K-Medoid Clustering has one drawback - the risk of trapping in the local minima [39]. The iteration could terminate immaturely when the overall cost reaches a local minimum, regardless the fact that there are still multiple items incorrectly clustered. In order to mitigate this problem, we propose an additional phase in the K-Medoid Clustering that could improve the clustering performance by reassigning some items without sacrificing the overall cost. More specifically, we identify the items that can be potentially reassigned by calculating their ASW values. Items with negative ASW values are considered as the candidates for reassignment. Secondly, for each potential candidate item, we evaluate the cluster that is most appropriate for the candidate to be reassigned. That means the ASW value of the reassigned item must be non-negative. Thirdly, if the reassignment of the item decreases the overall ASW of the whole clustering, the reassignment of the item is not beneficial to the clustering performance, and therefore, the item will be placed in a waitlist instead of reassigning to a cluster. The items in the waitlist will be revisited after the other candidates are reassigned. If the items in the waitlist cannot be reassigned, the item will be permanently removed from the clustering.
The pseudo code of the improved K-Medoid clustering is presented below:
 // Initializing Symptom Occurrence
 Initialize symptom_counts[n];
 For i=l to n symptoms do
  For j=l to m records do
    If(records.has(symptom[i]))
      symptom_counts[i]<-symptom_counts[i]+1;
    End If
  End For
 End For
 // Compute Symptoms Similarity
 Initialize similarity_matrix[n][n];
 For i=l to n symptoms do
  For j=l to i symptoms do
    For k=l to m records do
      If(records.has(symptom[i]) and
 records.has(symptom[j]))
 similarity_matrix[i][j]<-
 similarity_matrix[i][j]+l;
similarity_matrix[j][i]<-
similarity_matrix[j][i]+l;
      End If
    End For
  End For
End For
For i=l to n symptoms do
 For j=l to n symptoms do
  similarity_matrix[i][j]<-
similarity_matrix[i][j]
  /sqrt(symptom_counts[i]*symptom_counts[j]);
 End For
End For
Initialize dissimilarity_matrix[n][n];
For i=l to n symptoms do
 For j=l to n symptoms do
  dissimilarity_matrix[i][j]=l-
similarity_matrix;
  End For
End For
// Determining the Best k
For k=5 to 10 do
  medoids<-Random(n,k);
  step a: for each non-medoid symptom[i] do
   symptom[i].membership<-
symptom[i].closestNeighborMedoid;
  End step a
  For each medoid symptom[i] do
   For each non-medoid symptom [j] and belong to
medoid symptom[i] do
    cost[j]<-sum
(dissimilarity_matrix[j][within_cluster]);
   End For
   If(symptom[j] has largest cost[j])
    symptom[j]<->medoid[i];
   End If
  End For
  go back to step a until medoids does not change;
  For i=l to n symptoms do
   a[i]<-average
(dissimilarity_matrix[i][within_cluster]);
   b[i]<-average
(dissimilarity_matrix[i][out_cluster]);
   SW[i]<-(b[i]-a[i])/max(b[i]-a[i]);
  End For
End For
Average_SW=average(SW);
Best_k=Max(Average_SW.Number_of_Clusters)&& Size of cluster>l;
// Clustering with Medoids
medoids<-Random(n,Best_k);
step b: for each non-medoid symptom[i] do
  symptom[i].membership<:-
symptom [i].closestNeighborMedoid;
End step b
For each medoid symptom[i] do
  For each non-medoid symptom [j] and belong to
medoid symptom[i] do
   cost[j]<-sum
(dissimilarity_matrix[j] [within_cluster]);
End For
If(symptom[j] has largest cost[j])
symptom[j]<->medoid[i];
End If
End For
go back to step b until medoids does not change;
//Symptoms Reassignment
While(negative-ASW symptom exists)
 Pick the most-negative-ASW symptom s;
 For(i=l;i=Best_k;i++)
   calculate ASW of s at cluster i;
 End For
 C=cluster where symptom s has most positive ASW;
 If(s is re-assigned to cluster C && overall ASW
does not decrease)
   Re-assign symptom s to cluster C;
 Else
   Move symptom s to waitlist W;
 End If
End while
For (each symptom s in waitlist W)
 For(i=l;i=Best_k;i++)
   Calculate ASW of s at cluster i;
 End For
 C=cluster where symptom s has most positive ASW;
 If(s is re-assigned to cluster C && overall ASW
does not decrease)
   Resume symptom s from waitlist W to cluster C;
 Else
   Remove symptom s permanently;
 End If
End For
 End If
End while
For (each symptom s in waitlist W)
 For<i=l;i=Best_k;i++)
  Calculate ASW of s at cluster i;
 End For
 C=cluster where symptom s has most positive ASW;
 If(s is re-assigned to cluster C && overall ASW
does not decrease)
  Resume symptom s from waitlist W to cluster C;
 Else
  Remove symptom s permanently;
 End If
End For
III. RESULTS
In this section, we report clustering results of the social media data, T1, T2 and T3. First, we determine the optimal number of clusters for the K-Medoid clustering by examining the overall Average Silhouette Width (ASW). Second, we perform the improved K-Medoid clustering on the similarity matrices of social media data, T1, T2 and T3 respectively. Third, we analyze the results, taking into consideration network structure, clustering performance, and areas of overlap between social media data and research study data.
A. Clustering Results of Social Media Data
Figure 1 depicts the clustering result of the social media data. One symptom “weight loss” is removed during the reassignment phase, resulting in 32 symptoms in the final clustering result. Each circle represents a unique symptom, and the size of the circle is proportional to the square root value of the number of occurrence of the symptom (raw values of the occurrences are too large to be drawn in a figure) The symptoms are connected with edges, and the thickness of edges represents the similarity between two symptoms. Each cluster of symptoms is fille with one color, and encircled with a rectangle. The medoid symptom of each cluster is highlighted with a solid ring circle, e.g. “Hot flash in cluster 3 and “General ache” in cluster 4. We also highlight the symptoms that have been re-assigned during the reassignment phase of the improved K-Medoid clustering, with a dashed ring circle, e.g. “shakiness” in cluster 1 and “lightheadedness” in cluster 2.
Fig. 1.
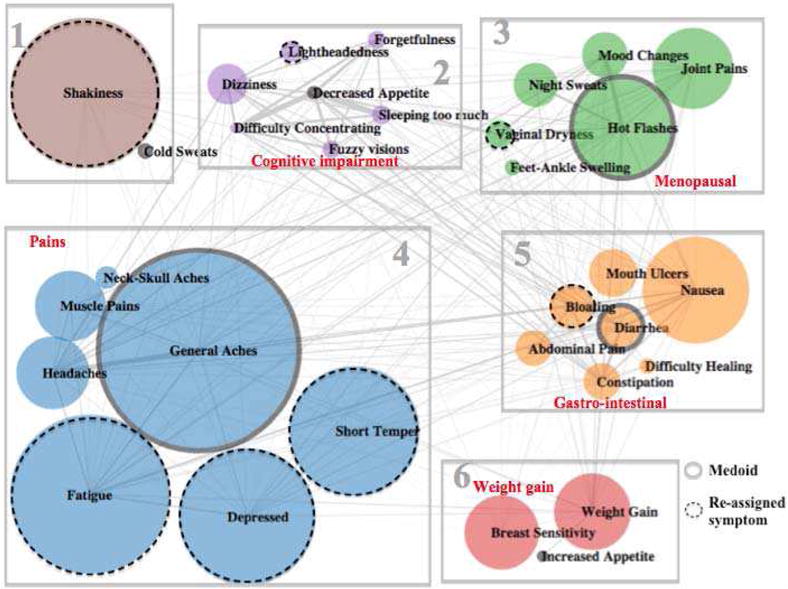
Clustering Results of Social Media Data (k=6)
From the perspective of network structure, there are several observations. First, the network is very sparse. Each symptom is connected to a relatively small proportion of the other symptoms. Also, the similarities between symptoms (denoted by thickness of edges) vary substantially. Second, the sizes of the symptoms also vary significantly, especially given the fact that the sizes are already representing the square root values of the occurrences of the symptoms. Third, symptoms with thicker edges are generally well clustered together, e.g. (“general aches,” “headaches”) (“difficult concentrating,” “decreased appetite,” and “sleeping too much”) and (“hot flashes” “mood changes,” and “night sweats”), which is an indicator that the clustering has good performance.
From the medical perspective, the clusters provide meaningful clinical interpretations. Each cluster was given a theme based on the coherence of the cluster and prior knowledge of symptom clusters reported in the research literature. For example, cluster 2 mainly contains symptoms suggesting a cognitive impairment, e.g. “forgetfulness,” “difficult concentrating,” “sleep too much,” “lightheadedness,” and “dizziness,” as well as “fuzzy vision.” Cluster 3 involves typical postmenopausal symptoms, such as “hot flashes” “night sweats,” and “vaginal dryness.” Cluster 4 covers most symptoms related with pains, namely “general aches,” “headaches,” “neck-skull pains,” and “muscle pain.” Cluster 5 captures a family of gastro-intestinal symptoms, e.g. “nausea,” “abdominal pain,” “bloating,” “constipation,” and “diarrhea.”
We observe that the reassignment phase helps to improve the performance of the clustering. Firstly, the overall ASW is increased from 0.04 to 0.05 during the revision phase. Secondly, individual ASW values of all symptoms are adjusted to be a non-negative in the revision phase. Thirdly, after the revision phase, we could observe that most of the reassignment of symptoms is more meaningful than before the revision. For example, “lightheadedness” is moved from cluster 4 to cluster 2 to be with “dizziness.” “Vaginal dryness” is moved from cluster 2 to cluster 3 into the menopausal symptoms, and “bloating” is moved from cluster 2 to cluster 5 to join the family of gastro-intestinal symptoms.
However, “fatigue”, “depressed”, and “short temper” are moved from cluster 1 to cluster 4, which does not seem to improve the interpretation if these symptoms are assigned to either cluster 1 or cluster 4.
These observations suggest that the reassignment phase could improve the K-Medoid clustering in terms of overall ASW, individual ASW as well as interpretations. This is achieved by re-assigning symptoms with negative ASW values to alternative clusters until they have positive ASW values, while retaining the overall ASW to be non-decreasing. In this way, the reassignment phase is able to mitigate the local minima problem of the K-Medoid clustering.
B. Clustering Results of Clinical Trial Data T1
Unlike in the social media data, the sizes of clusters in research data T1 are extremely uneven. The largest cluster has over half of the symptoms while many clusters have only one symptom. This can be explained by how T1 transforms the 4-scale measure of symptom severity to binary-scale. All symptoms with mild, moderate, or sever are transformed to 1 in the binary scale. As a result, the connectivity of the symptoms is very high and many symptoms are assigned to one cluster. The symptoms that do not occur as frequently are assigned to a separate cluster as a singleton. Figure 2 depicts such effect of high connectivity between symptoms. Because of this, the clustering result does not correspond to any meaningful clinical interpretation.
Fig. 2.
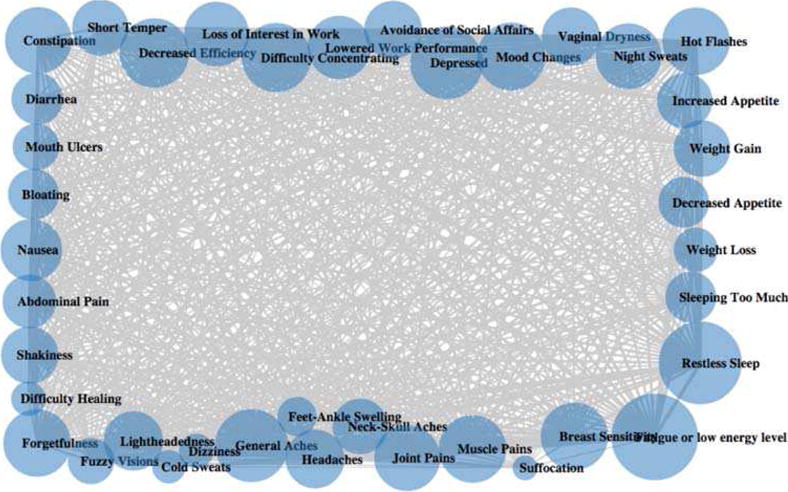
Network of T1
C. Clustering Results of Clinical Trial Data T2
Figure 3 depicts the clustering result of research data T2. Four symptoms, “restless sleep,” “fatigue,” “nausea,” and “mouth ulcer” are removed during the reassignment phase, resulting in 35 symptoms in the final clustering result. The illustration convention is the same as that of the clustering result of social media data in Figure 1 for circles, edges, solid ring circles, dashed ring circles, as well as rectangles. In addition, we highlight the symptoms that appear in one cluster both in social media data and research data (T2) with enclosed red dot-dash circles.
Fig. 3.
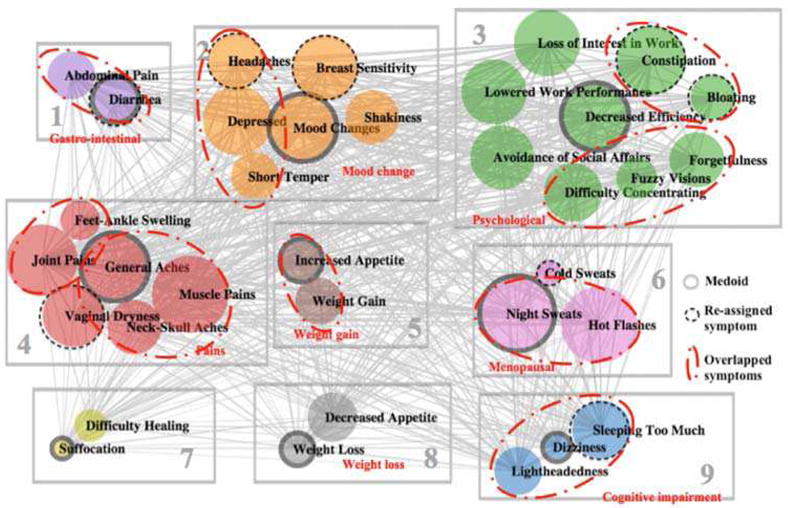
Clustering Results of Clinical Data (Experiment 2, k=9)
From the perspective of network structure, there are three observations. Firstly, compared to the almost complete graph of T1 (Figure 2), there are fewer edges in the network of T2. But the density is still higher than that of the network of social media (Figure 1). Secondly, compared to the almost equal-thickness edges in T1 network (Figure 2), the similarities between symptoms in T2 have a higher variation, but not as much as those in social media data. Thirdly, compared to the dramatically different sizes of circles in social media data (Figure 1), the occurrences of the symptoms in T2 are relatively evenly distributed (similar sizes of circles). T2 transforms the 4-scale measure to binary scale by transforming those symptoms that co-occur with at least moderate severity to 1. This transformation reduces many edges that exist in the T1 network. Such reduction of edges allows the clustering to focus on the association between symptoms that are at least moderate in severity.
As with the results from the social media data, many of the clusters seem to fit well with clinical interpretation. For example, cluster 1 includes gastro-intestinal symptoms, e.g. “abdominal pain” and “diarrhea.” Cluster 3 covers symptoms or impaired functioning particularly related to work., e.g. “loss of interest in work,” “lowered work performance,” “decreased efficiency”, and “avoidance of social affairs.” Cluster 4 covers most pain-related symptoms, e.g. “general aches,” “muscle pains,” “neck-skull aches,” and “joint pains,” although “feet-ankle swelling” is also included. Cluster 6 contains menopausal symptoms, e.g. “hot flashes and “night sweats.” Cluster 8 seems to indicate decreased appetite, which would result in weight loss. However, cluster 7 seems to defy clear interpretation.
The reassignment phase of the improved K-Medoid clustering helps to improve the performance of the clustering. The overall ASW is increased from 0.12 to 0.15 after the reassignment phase. Individual ASW values of all symptoms are adjusted to be a non-negative in the reassignment phase. We observe that most of the symptom reassignment are meaningful. For example, “diarrhea” is moved from cluster 3 to cluster 1 to be with “abdominal pain”. The other two gastro-intestinal (GI) symptoms “constipation” and “bloating” are moved from cluster 1 and cluster 2 to cluster 3 respectively. Although it would make more sense to have “constipation” and “bloating” in cluster 1, it is still useful to move these two symptoms from separate clusters to one cluster. “Sleep too much” is moved from cluster 1 to cluster 9, which makes sense since it is very unlikely to be related to the GI symptoms. Similarly, “headache” and “breast sensitivity” are moved from cluster 1 to cluster 2, since they are not related to GI symptoms. “Cold sweats” are moved from cluster 7 to cluster 6. One explanation is that cold sweats are vasomotor symptoms and could occur along with hot flashes and night sweats. “Vaginal dryness” is moved from cluster 6 to cluster 4, which is an unexpected movement, since “vaginal dryness” is expected to be related with menopausal symptoms, e.g. “hot flashes and “night sweats” in cluster 6. However, “vaginal dryness”, could also be associated with aches and pains as signs of aging. Despite this changes, some of which are somewhat unexpected, we would say the revision phase generally improves the K-Medoid clustering in terms of overall ASW, individual ASW as well as interpretations.
When compared with the social media clustering, we observe that there are some overlapping between T2 and social media clustering results, as highlighted by the dot-dash red circles. Consider that T2 contains more symptoms (35) than social media data (32), the overlapping is even more significant when we remove the symptoms that appear in only either one data source. Most of the overlapped symptoms are related to GI (cluster 1 and cluster 3), mood (cluster 2), pain (cluster 4), menopausal (cluster 6) as well as cognitive impairment (cluster 9).
D. Clustering Results of Clinical Trial Data T3
Figure 4 depicts the clustering result of research study data using the T3 classification Only the symptom of “fatigue” was removed during the reassignment phase, resulting in a total of 38 symptoms in the final clustering result. The illustration convention is the same as that of the clustering result of social media data in Figure 2 for circles, edges, solid ring circles, dashed ring circles, rectangles, as well as enclosed red dot-dash circles.
Fig. 4.
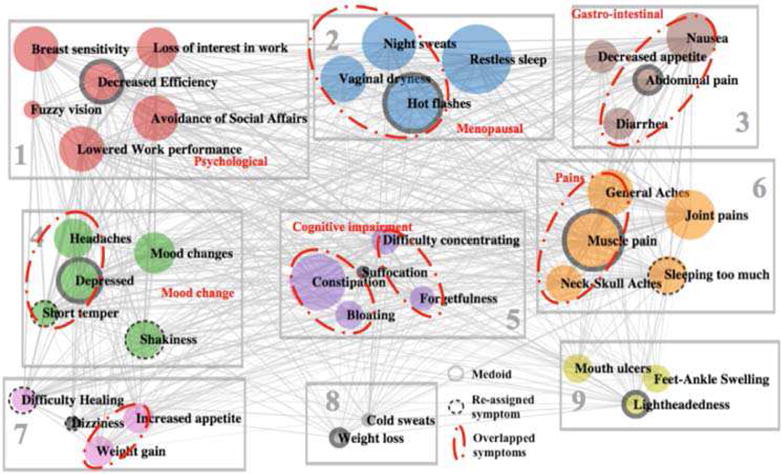
Clustering Results of Clinical Data (Experiment 3, k=9)
From the perspective of network structure, there are even fewer edges in the network of T3 comparing with that of T1 and T2. T2 transforms the 4-scale measure to a binary scale by transforming only severe symptoms to 1.
From the medical perspective, we observe that cluster 1 includes psychosocial-related symptoms, e.g. “loss of interest in work,” “lowered work performance,” “decreased efficiency,” and “avoidance of social affairs.” Cluster 2 contains menopausal symptoms, e.g. “hot flashes” “vaginal dryness,” and “night sweats.” Cluster 3 includes gastrointestinal symptoms, e.g. “nausea,” “abdominal pain,” and “diarrhea.” Cluster 6 covers pain-related symptoms, e.g. “general aches,” “muscle pains,” and “neck-skull aches.”
The reassignment phase of the improved K-Medoid clustering increases the overall ASW from 0.11 to 0.13. The individual ASW values of all symptoms are adjusted to non-negative values. We also observe that some of the symptom reassignments are meaningful. For example, “short temper” is moved from cluster 5 to cluster 4 to join the family of “mood change.” “Shakiness” is moved from cluster 1 to cluster 4 since cluster 1 is mainly about impaired functioning symptoms. The other three movements seem random and difficult to interpret, e.g. “sleeping too much” is moved from cluster 3 to cluster 6, and “difficult healing” and “dizziness” are moved from cluster 5 to cluster 7. These three reassignments do not seem to improve or degrade the clustering performance because these symptoms do not fit well in any existing clusters.
When compared with the social media clustering, we observe that there are substantial agreements between the clustering results of T3 and social media, as highlighted by the dot-dash red circles. Considering that T3 contains more symptoms (38) than social media data (32), the overlapping is even more significant when we remove the symptoms that appear in only one data source. Most of the overlapped symptoms are related to menopausal (cluster 2), GI (cluster 3), mood change (cluster 4), cognitive impairment (cluster 5), pain symptoms (cluster 6), as well as weight gain (cluster 7).
E. Comparison with Results from Previous Literature
The symptom clusters we identified in our two samples appear reasonable given the amount of overlap with results published in other articles including both general cancer patients and breast cancer patients in particular [40–42]. Analysis of medical study data indicated that fatigue was not clustered with pain, while forum data showed that fatigue and pain did cluster together. Both cluster relationships have been reported previously [43–47]. Menopausal, psychological, and gastrointestinal clusters have also been identified [26, 27]. A review by Nguyen et al [48] lists symptom clusters reported among breast cancer patients.
We note direct comparison of results with previous reports may be hindered due to differences in patient populations and statistical methods. For example, samples may differ in terms of cancer stage, time since diagnosis, and active treatment or treatment received. Although we used k-medoid clustering, other studies have used various methods including hierarchical cluster analysis, principal component analaysis, and explorative factor analysis [21, 23, 49–51]. Also, the use of social media as a data source is also novel among similar studies.
IV. DISCUSSION
The present study provides insight into multiple issues. Results contrast the symptom clusters derived from research data and social data. This raises the question, should we rely on one type of data or both? Notable finding and unresolved questions are discussed below.
We fin that some clusters of symptoms are consistent across social media data, T2 and T3, e.g. GI related symptoms (“abdominal pain,” “diarrhea”), (“constipation,” “bloating”), menopausal symptoms (“hot flashes” “night sweats”), negative mood- symptoms (“depressed,” “short temper”), cognitive impairment (“difficult concentrating,” “forgetfulness”), (“dizziness,” “lightheadedness,” “sleeping too much”), pain-related symptoms (“general aches,” “muscle pains,” “neck-skull aches”). Some impaired functioning symptoms are consistent in T2 and T3 (but not identified in social media data), e.g. “loss of interest in work,” “lowered work performance,” “decreased efficiency,” and “avoidance of social affairs.” This suggests that unsolicited social media data can capture many meaningful clusters that are also identified from standard symptom checklists used in research studies. These clusters of symptoms can be useful in post-treatment monitoring, as well as improving life quality of breast-cancer patients. For example, knowledge of these clusters may help clinicians to monitor for other symptoms in the same cluster when a single symptom is identified
The structures of the network of the symptoms generated by social media data and data from a research study checklist are different. The network of social media data is sparse, while the network of symptom checklist data has higher density. The thickness of edges (co-occurrence) and the sizes of nodes (occurrence) vary substantially for social media data, but remain almost equal for research data. These could all be attributed to how the data are collected in these two different data sources. For social media data, the symptoms are embedded in people’s narratives in online posts and comments where symptoms are raised without a prompt. As such, they are probably more salient or bothersome to the person than less bothersome symptoms that are less likely to be discussed in social media. It is also possible that the people may be hesitant to raise a symptom on social media or have trouble identifying a term for it. One example is the unexpectedly low occurrence rate of restless sleep in social media data. Restless sleep was very common in the research study data but it did not yield high occurrences in the social media data. We speculate that restless sleep did occur but simply was not detected or captured, either because people are unlikely to report this symptom on the forum or when it was reported it fell outside the bounds of the text mining algorithm. Research studies typically present participants with a checklist of of symptoms. The formation of clusters would therefore be a function of both the length of the checklist, the response scale of the checklist. In this paper, the checklist contains a substantial number of symptoms, and compared to unstructured social media data, more symptoms could be checked with various scores, resulting in a network of symptoms with higher density. We design three experiments, e.g. T1, T2 and T3 to evaluate the sensitivity of the clusters to how we transform the 4-scales into binary values. As we set a stricter criterion on scale transformation, we retain fewer connections between symptoms. T1 does not produce any meaningful clustering. T2 yields better clustering performance than T3 based on the clinical interpretation. The underlying reasons are (1) T1 generates a network with a very high density and the symptoms are impossible to be partitioned (2) the network generated by T3 is too sparse and some valuable associations between symptoms are lost. (3) T2 make a good balance between T1 and T3, and therefore produces the best clustering results.
The reassignment phase in the improved K-Medoid clustering helps to improve the clustering performance. K-Medoid clustering has a risk of trapping in local minima. To find the global optima of the K-Medoid clustering is a NP-hard problem. The improved K-Medoid clustering could help to jump out of the local minima, by reassigning some of the negative-ASW symptoms to other clusters after initial K-Medoid clustering without sacrificing the overall ASW. The clustering results show that the reassignment phase helps to improve the clustering performance in terms of overall ASW, individual ASW, and interpretation of the final clustering.
The incorporation of the two sources of data is more powerful than relying on only one of them. On one hand, a network of symptoms built on social media data is more likely to be sparse, and easier to be partitioned, compared to research study data. On the other hand, only relying on social media data may miss some important symptom clusters. For example, no impaired functioning symptoms (“loss of interest in work”, “lowered work performance”, “decreased efficiency”, and “avoidance of social affair”) are identified in the social media data. On the other hand, the research study data is advantageous to collect the occurrence of symptoms that are not identified in social media, since they are well define and described to the participants in the survey. However, data based on a long symptom checklist, as is the case here, tends to generate network with high density and the vague boundaries between clusters. Cross-validation can be conducted if we adopt more than one data source. In addition, given the social media data, we may conduct semantic analysis from the patient contributed content to acquire insights about the associations between symptoms and to interpret the meaning of the identified clusters.
The symptom clusters found in this study has implications in practical symptom management. Symptom management does not view symptoms as isolated events but consider the relationships between symptoms for more effective intervention. Considering symptoms that share a common etiology, address the underlying cause may ease multiple symptoms at the same time.
V. CONCLUSION
The present paper provides an exemplar of two approaches to cluster symptoms in breast cancer populations with both social media data and research data using an improved K-Medoid clustering. Due to the different ways the data are collected, the network of symptoms constructed from social media is sparse while the network built from study data has a higher density. The high density of research network makes the boundaries between clusters of symptoms less clear and the transformation of the 4-scale measure to the binary scale using the moderate severity as the threshold produce the best performance. The improved K-Medoid clustering helps to improve the clustering performance by reassigning some of the negative-ASW symptoms to other clusters without sacrificing the overall ASW. The improvement is suggested by the overall ASW, individual ASW as well as interpretation of the final clustering result. The clustering results suggest that some symptom clusters are consistent across social media data and research data, e.g. GI related symptoms, menopausal symptoms, mood-change symptoms, cognitive impairment and pain-related symptoms. Some psychological symptoms are consistently found in T2 and T3, but not identified in social media data. We conclude that an integrative approach to take advantage of both data sources is recommended. Given that social media data has relatively clear boundaries of symptoms but risks missing some important clusters, the missing clusters can be compensated for with research data. The social media data can offer additional insights by conducting semantic analysis of the patient contributed content.
Acknowledgments
This work was supported in part by the National Science Foundation under the Grant DIBBs-1443019, IIS-1650531 and SES-1424875, the National Institutes of Health under the Grant P50-CA-180905-01 and R21AG042761, and the U.S. Department of Defense under Grant 17-01-1-0446.
Contributor Information
Qing Ping, PhD student in the College of Computing & Informatics, Drexel University, Philadelphia, PA 19104 USA.
Christopher C. Yang, College of Computing & Informatics, Drexel University, Philadelphia, PA 19104 USA.
Sarah A. Marshall, Department of Biostatistical Sciences, Wake Forest School of Medicine, Winston-Salem, NC 27157, USA
Nancy E. Avis, Department of Social Sciences and Health Policy, Wake Forest University School of Medicine, Winston-Salem, NC 27157 USA
Edward H. Ip, Department of Biostatistical Sciences and the Department of Social Sciences & Health Policy, Wake Forest University School of Medicine, Winston-Salem, NC 27157 USA
References
- 1.Zhang M, Yang CC. Social Support and Exchange Patterns in an Online Smoking Cessation Intervention Program,” in. IEEE International Conference on Healthcare Informatics. 2013:219–228. [Google Scholar]
- 2.Jiang L, Yang CC, Li J. Discovering Consumer Health Expressions from Consumer-Contributed Content,” in. Social Computing, Behavioral-Cultural Modeling and Prediction. 2013:164–174. [Google Scholar]
- 3.Jiang L, Yang CC. Using Co-occurrence Analysis to Expand Consumer Health Vocabularies from Social Media Data,” in. Proceedings of IEEE International Conference on Healthcare Informatics. 2013:74–81. [Google Scholar]
- 4.Tuarob S, Tucker CS, Salathe M, Ram N. An ensemble heterogeneous classification methodology for discovering health-related knowledge in social media messages. Journal of biomedical informatics. 2014;49:255–268. doi: 10.1016/j.jbi.2014.03.005. [DOI] [PubMed] [Google Scholar]
- 5.Sarker A, Gonzalez G. Portable Automatic Text Classification for Adverse Drug Reaction Detection via Multi-corpus Training. Journal of biomedical informatics. 2014;53:196–207. doi: 10.1016/j.jbi.2014.11.002. [DOI] [PMC free article] [PubMed] [Google Scholar]
- 6.Benton A, Ungar L, Hill S, Hennessy S, Mao J, Chung A, Leonard CE, Holmes JH. Identifying potential adverse effects using the web: A new approach to medical hypothesis generation. Journal of biomedical informatics. 2011;44(6):989–996. doi: 10.1016/j.jbi.2011.07.005. [DOI] [PMC free article] [PubMed] [Google Scholar]
- 7.Yang CC, Yang H, Jiang L, Zhang M. Social media mining for drug safety signal detection,” in. Proceedings of the 2012 international workshop on Smart health and wellbeing. 2012:33–40. [Google Scholar]
- 8.Webster YW, Dow ER, Koehler J, Gudivada RC, Palakal MJ. Leveraging health social networking communities in translational research. Journal of biomedical informatics. 2011;44(4):536–544. doi: 10.1016/j.jbi.2011.01.010. [DOI] [PubMed] [Google Scholar]
- 9.Merolli M, Gray K, Martin-Sanchez F. Health outcomes and related effects of using social media in chronic disease management: A literature review and analysis of affordances. Journal of biomedical informatics. 2013;46(6):957–969. doi: 10.1016/j.jbi.2013.04.010. [DOI] [PubMed] [Google Scholar]
- 10.Bull SS, Levine DK, Black SR, Schmiege SJ, Santelli J. Social media–delivered sexual health intervention: a cluster randomized controlled trial. American journal of preventive medicine. 2012;43(5):467–474. doi: 10.1016/j.amepre.2012.07.022. [DOI] [PMC free article] [PubMed] [Google Scholar]
- 11.Korda H, Itani Z. Harnessing social media for health promotion and behavior change. Health promotion practice. 2013;14(1):15–23. doi: 10.1177/1524839911405850. [DOI] [PubMed] [Google Scholar]
- 12.Subirats L, Ceccaroni L, Lopez-Blazquez R, Miralles F, García-Rudolph A, Tormos JM. Circles of health: Towards an advanced social network about disabilities of neurological origin. Journal of biomedical informatics. 2013;46(6):1006–1029. doi: 10.1016/j.jbi.2013.09.001. [DOI] [PubMed] [Google Scholar]
- 13.Chira P, Nugent L, Miller K, Park T, Donahue S, Soni A, Nugent D, Sandborg C. Living Profiles Design of a health media platform for teens with special healthcare needs. Journal of biomedical informatics. 2010;43(5):9–12. doi: 10.1016/j.jbi.2010.05.008. [DOI] [PubMed] [Google Scholar]
- 14.Pratt W, Reddy MC, McDonald DW, Tarczy-Hornoch P, Gennari JH. Incorporating ideas from computer-supported cooperative work. Journal of biomedical informatics. 2004;37(2):128–137. doi: 10.1016/j.jbi.2004.04.001. [DOI] [PubMed] [Google Scholar]
- 15.Kim HJ, McGuire DB, Tulman L, Barsevick AM. Symptom clusters: concept analysis and clinical implications for cancer nursing. Cancer nursing. 2005;28(4):270–282. doi: 10.1097/00002820-200507000-00005. [DOI] [PubMed] [Google Scholar]
- 16.Miaskowski C, Aouizerat BE. Is there a biological basis for the clustering of symptoms? Seminars in oncology nursing. 2007;23(2):99–105. doi: 10.1016/j.soncn.2007.01.008. [DOI] [PubMed] [Google Scholar]
- 17.Dodd MJ, Miaskowski C, Paul SM. Symptom clusters and their effect on the functional status of patients with cancer,” in. Oncology nursing forum. 2001:465–470. [PubMed] [Google Scholar]
- 18.Walsh D, Donnelly S, Rybicki L. The symptoms of advanced cancer: relationship to age, gender, and performance status in 1,000 patients. Supportive Care in Cancer. 2000;8:175–179. doi: 10.1007/s005200050281. [DOI] [PubMed] [Google Scholar]
- 19.Miaskowski C, Aouizerat BE, Dodd M, Cooper B. Conceptual issues in symptom clusters research and their implications for quality-of-life assessment in patients with cancer. Journal of the National Cancer Institute Monographs. 2006:39–46. doi: 10.1093/jncimonographs/lgm003. [DOI] [PubMed] [Google Scholar]
- 20.Given CW, Given B, Azzouz F, Kozachik S, Stommel M. Predictors of pain and fatigue in the year following diagnosis among elderly cancer patients. Journal of pain and symptom management. 2001;21:456–466. doi: 10.1016/s0885-3924(01)00284-6. [DOI] [PubMed] [Google Scholar]
- 21.Walsh D, Rybicki L. Symptom clustering in advanced cancer. Supportive Care in Cancer. 2006;14(8):831–836. doi: 10.1007/s00520-005-0899-z. [DOI] [PubMed] [Google Scholar]
- 22.Fan G, Hadi S, Chow E. Symptom clusters in patients with advanced-stage cancer referred for palliative radiation therapy in an outpatient setting. Supportive cancer therapy. 2007;4(3):157–162. doi: 10.3816/SCT.2007.n.010. [DOI] [PubMed] [Google Scholar]
- 23.Tsai JS, Wu CH, Chiu TY, Chen CY. Significancy of symptom clustering in palliative care of advanced cancer patients. Journal of pain and symptom management. 2010;39(4):655–662. doi: 10.1016/j.jpainsymman.2009.09.005. [DOI] [PubMed] [Google Scholar]
- 24.Laird BJ, Scott AC, Colvin LA, McKeon AL, Murray GD, Fearon KC, Fallon MT. Pain, depression, and fatigue as a symptom cluster in advanced cancer. Journal of pain and symptom management. 2011;42(1):1–11. doi: 10.1016/j.jpainsymman.2010.10.261. [DOI] [PubMed] [Google Scholar]
- 25.Bender CM, Ergÿn FS, Rosenzweig MQ, Cohen SM, Sereika SM. Symptom clusters in breast cancer across 3 phases of the disease. Cancer Nursing. 2005;28(3):219–225. doi: 10.1097/00002820-200505000-00011. [DOI] [PubMed] [Google Scholar]
- 26.Glaus A, Boehme CH, Thürlimann B, Ruhstaller T, Schmitz SH, Morant R, Senn HJ, von Moos R. Fatigue and menopausal symptoms in women with breast cancer undergoing hormonal cancer treatment. Annals of oncology. 2006;17(5):801–806. doi: 10.1093/annonc/mdl030. [DOI] [PubMed] [Google Scholar]
- 27.Kim HJ, Barsevick AM, Tulman L, McDermott PA. Treatment-related symptom clusters in breast cancer: a secondary analysis. Journal of Pain and Symptom Management. 2008;36(5):468–479. doi: 10.1016/j.jpainsymman.2007.11.011. [DOI] [PubMed] [Google Scholar]
- 28.Shachak A, Jadad AR. Electronic health records in the age of social networks and global telecommunications. JAMA. 2010;303:452–453. doi: 10.1001/jama.2010.63. [DOI] [PubMed] [Google Scholar]
- 29.Hawn C. Take two aspirin and tweet me in the morning: how Twitter, Facebook, and other social media are reshaping health care. Health affairs. 2009;28:361–368. doi: 10.1377/hlthaff.28.2.361. [DOI] [PubMed] [Google Scholar]
- 30.Courtney K. The use of social media in healthcare: organizational, clinical, and patient perspectives. Enabling Health and Healthcare Through ICT: Available, Tailored, and Closer. 2013;183:244. [PubMed] [Google Scholar]
- 31.van der Eijk M, Faber MJ, Aarts JW, Kremer JA, Munneke M, Bloem BR. Using online health communities to deliver patient-centered care to people with chronic conditions. Journal of Medical Internet Research. 2013;15 doi: 10.2196/jmir.2476. [DOI] [PMC free article] [PubMed] [Google Scholar]
- 32.Cavallo DN, Tate DF, Ries AV, Brown JD, De Vellis RF, Ammerman AS. A social media–based physical activity intervention: a randomized controlled trial. American journal of preventive medicine. 2012;43:527–532. doi: 10.1016/j.amepre.2012.07.019. [DOI] [PMC free article] [PubMed] [Google Scholar]
- 33.Pearson JF, Brownstein CA, Brownstein JS. Potential for electronic health records and online social networking to redefind medical research. Clinical chemistry. 2011;57:196–204. doi: 10.1373/clinchem.2010.148668. [DOI] [PMC free article] [PubMed] [Google Scholar]
- 34.Lazer D, Kennedy R, King G, Vespignani A. The Parable of Google Flu: Traps in Big Data Analysis. Science. 2014;343:1203–1205. doi: 10.1126/science.1248506. [DOI] [PubMed] [Google Scholar]
- 35.Avis N, Levine B, Naughton M, Case LD, Naftalis E, Van Zee KJ. Age Related Longitudinal Changes in Depressive Symptoms Following Breast Cancer Diagnosis and Treatment. Breast Cancer Res Treat. 2013;139(10):199–206. doi: 10.1007/s10549-013-2513-2. [DOI] [PMC free article] [PubMed] [Google Scholar]
- 36.Zeng QT, Tse T. Exploring and developing consumer health vocabularies. Journal of the American Medical Informatics Association. 2006;13(1):24–29. doi: 10.1197/jamia.M1761. [DOI] [PMC free article] [PubMed] [Google Scholar]
- 37.Kaufman L, Rousseeuw PJ. Clustering by Means of Medoids. In: Dodge Y, editor. Statistical Data Analysis Based on the L1–Norm and Related Methods. 1987. pp. 405–416. [Google Scholar]
- 38.Rousseeuw PJ. Silhouettes: a Graphical Aid to the Interpretation and Validation of Cluster Analysis. Journal of Computational and Applied Mathematics. 1987;20:53–65. [Google Scholar]
- 39.Cambria E, Hussain A. Sentic computing: Techniques, tools, and applications. Springer Science & Business Media. 2012:57–58. [Google Scholar]
- 40.Fan G, Filipczak L, Chow E. Symptom clusters in cancer patients: a review of the literature. Current Oncology. 2007;14:173. doi: 10.3747/co.2007.145. [DOI] [PMC free article] [PubMed] [Google Scholar]
- 41.Fan G, Filipczak L, Chow E. Symptom clusters in cancer patients: a review of the literature. Current Oncology. 2007;14:173. doi: 10.3747/co.2007.145. [DOI] [PMC free article] [PubMed] [Google Scholar]
- 42.Fan G, Filipczak L, Chow E. Symptom clusters in cancer patients: a review of the literature. Current Oncology. 2007;14:173. doi: 10.3747/co.2007.145. [DOI] [PMC free article] [PubMed] [Google Scholar]
- 43.Broeckel JA, Jacobsen PB, Horton J, Balducci L, Lyman GH. Characteristics and correlates of fatigue after adjuvant chemotherapy for breast cancer. Journal of Clinical Oncology. 1998;16:1689–1696. doi: 10.1200/JCO.1998.16.5.1689. [DOI] [PubMed] [Google Scholar]
- 44.Berger AM, Farr L. The influence of daytime inactivity and nighttime restlessness on cancer-related fatigue,” in. Oncology nursing forum. 1998:1663–1671. [PubMed] [Google Scholar]
- 45.Byar KL, Berger AM, Bakken SL, Cetak MA. Impact of adjuvant breast cancer chemotherapy on fatigue, other symptoms, and quality of life,” in. Oncology Nursing Forum. 2006:E18–26. doi: 10.1188/06.ONF.E18-E26. [DOI] [PubMed] [Google Scholar]
- 46.Ho S-Y, Rohan KJ, Parent J, Tager FA, McKinley PS. A longitudinal study of depression, fatigue, and sleep disturbances as a symptom cluster in women with breast cancer. Journal of pain and symptom management. 2015;49:707–715. doi: 10.1016/j.jpainsymman.2014.09.009. [DOI] [PMC free article] [PubMed] [Google Scholar]
- 47.Gaston-Johansson F, Fall-Dickson JM, Bakos AB. Fatigue, Pain, and Depression in Pre-Autotransplant Breast Cancer Patients. Cancer practice. 1999;7:240–247. doi: 10.1046/j.1523-5394.1999.75008.x. [DOI] [PubMed] [Google Scholar]
- 48.Nguyen J, Cramarossa G, Bruner D, Chen E, Khan L, Leung A, et al. A literature review of symptom clusters in patients with breast cancer. 2011 doi: 10.1586/erp.11.55. [DOI] [PubMed] [Google Scholar]
- 49.Denieffe S, Cowman S, Gooney M. Symptoms, clusters and quality of life prior to surgery for breast cancer. Journal of clinical nursing. 2014;23:2491–2502. doi: 10.1111/jocn.12430. [DOI] [PubMed] [Google Scholar]
- 50.Fan G, Hadi S, Chow E. Symptom clusters in patients with advanced-stage cancer referred for palliative radiation therapy in an outpatient setting. Supportive cancer therapy. 2007;4:157–162. doi: 10.3816/SCT.2007.n.010. [DOI] [PubMed] [Google Scholar]
- 51.Gleason JF, Case D, Rapp SR, Ip E, Naughton M, Butler JM, Jr, et al. Symptom clusters in patients with newly-diagnosed brain tumors. J Support Oncol. 2007;5:427–433. [PubMed] [Google Scholar]