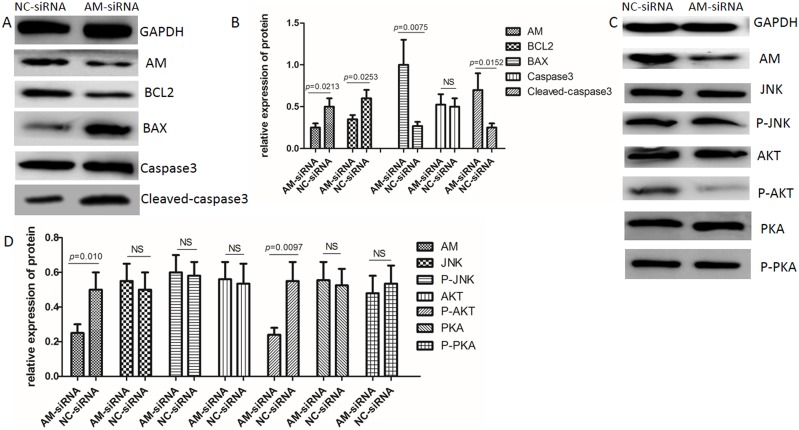
Figure 4. The AKT signaling pathway is down-regulated resulting in cell apoptosis.
(A) Western blot showing that Bcl2 levels are reduced while Bax and cleaved-caspase3 are elevated in response to AM knockdown. (B) Gray-scale scanning histogram of (A). The data represent the mean ± SEM (P-value=0.0213; P-value=0.0253; P-value=0.0075; P-value=0.0152). (C) Western blot showing P-AKT levels are reduced in response to AM knockdown. (D) Gray-scale scanning histogram of (C). The data represent the mean ± SEM (P-value=0.010; P-value=0.0097).

