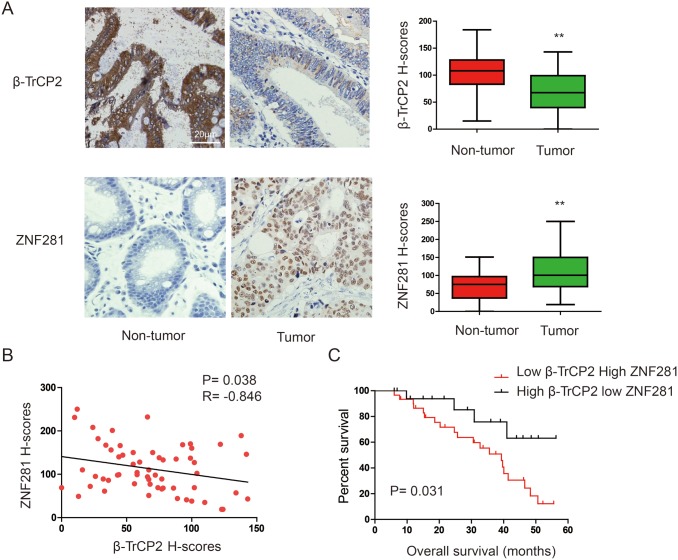
Figure 1. Expression patterns of β-TrCP2 and ZNF281 in human CRC.
(A) representative images of IHC staining of β-TrCP2 and ZNF281 conducted in CRC tissues and paired non-tumor tissues (left panel). The expression was quantified by H-scores (right panel). (B) Linear correlation analysis was used to detect the correlationship between β-TrCP2 and NF90 expression. (C) Kaplan-Meier curves show that HCC patients with high ZNF281 and low β-TrCP2 H-scores had a poorer prognosis than patients with low ZNF281 and high β-TrCP2 H-scores did. **P < 0.01.

