

Abstract
Background
Worsening heart failure (WHF) symptoms despite initial therapy during admission for acute heart failure (AHF) is associated with worse outcomes. The association between the time of the WHF event and the intensity of WHF therapy with outcomes is unknown.
Methods and results
In the PROTECT trial of 2033 AHF patients, we investigated the association between time of occurrence of WHF and intensity of therapy, with subsequent outcomes. WHF was defined by standardized, physician-determined assessment. Early WHF was defined as occurring on days 2–3 and late on days 4–7. Low intensity included restarting/increasing diuretics or vasodilators and high intensity included initiation of inotropes, vasopressors, inodilators, or mechanical support. Outcomes were death or cardiovascular/renal hospitalization over 60 days and death over 180 days. Of the 1879 patients with complete follow-up after day 7, 12.7% (n = 238) experienced WHF: 47.9% early and 52.1% late. Treatment intensity was low in 72.3% and high in 24.8% (2.9% missing). After adjusting for baseline predictors of outcome, WHF was associated with a trend toward increased 60-day death or cardiovascular/renal hospitalization [hazard ratio (HR) 1.26; 95% confidence interval (CI) 0.99–1.60; P = 0.063] and increased 180-day death (HR 1.77; 95% CI 1.33–2.34; P < 0.001). There was no evidence of a differential association between the time of occurrence of WHF and outcomes. High-intensity therapy was not significantly associated with increased event rates (180-day mortality: HR 1.44; 95% CI 0.80–2.59 vs. low).
Conclusions
Inhospital WHF was associated with increased 180-day death. The time of occurrence and intensity of WHF therapy may provide less prognostic information than whether or not WHF occurred.
Keywords: Worsening heart failure, Acute heart failure, Timing, Intensity, Outcomes
Introduction
After hospitalization for acute heart failure (AHF), worsening heart failure (WHF), typically defined as persistent or worsening symptoms requiring an escalation of therapy,1,2 is associated with worse outcomes3–5 and the prevention of WHF has become an important endpoint in AHF trials.6–10 The impact of WHF time of occurrence (i.e. early vs. late during hospitalization) and the intensity of therapy directed at WHF on clinical outcomes are unknown. Specifically, it has not been determined whether WHF occurring late during hospitalization is associated with poorer outcomes compared with WHF occurring early after admission. It is hypothesized that WHF occurring early after admission may be simply caused by underdosing of early intravenous treatment, with insufficient decongestion or control of hypertension, whereas the events occurring late may be more tightly associated with the severity of the disease (e.g. diuretic resistance). We hypothesized that WHF requiring low intensity intervention [e.g. diuretic intensification or intravenous (IV) vasodilators] may have different implications compared with high intensity intervention (e.g. intravenous inotropes, circulatory support) both with respect to the severity of the disease and the untoward effects of the drugs administered (e.g. arrhythmias, hypotension).11 We performed a retrospective analysis of the PROTECT trial (Placebo-Controlled Randomized Study of the Selective A1 Adenosine Receptor Antagonist Rolofylline for Patients Hospitalized With Acute Decompensated Heart Failure and Volume Overload to Assess Treatment Effect on Congestion and Renal Function), which included AHF patients with renal dysfunction and used a standardized, physician-determined assessment of WHF.7,8 Our aim was to investigate the association between time of occurrence of WHF and intensity of WHF therapy with post-discharge outcomes.
Methods
Data source
The international PROTECT trial enrolled 2033 patients admitted to the hospital with acute heart failure (HF) and mild or moderate renal impairment. The design and results of PROTECT have been published previously.7,8 Briefly, the inclusion criteria were: (i) previous history of HF treated for at least 14 days with diuretic therapy; (ii) hospitalization for worsening breathlessness owing to HF requiring intravenous diuretic therapy; (iii) admission creatinine clearance 20–80 mL/min by the Cockcroft–Gault equation; (iv) a brain natriuretic peptide (BNP) level ≥500 pg/mL or N-terminal pro-BNP level ≥2000 pg/mL; and (iv) systolic blood pressure (SBP) ≥95 mmHg. Key exclusion criteria were use of inotropic agents or mechanical support, severe pulmonary disease; significant stenotic valvular disease, recent acute coronary syndrome or significant arrhythmias, and history of seizure/stroke within 2 years.
Patients were enrolled from 2007 to 2009 and randomly assigned to the intravenous administration of the A1-receptor antagonist rolofylline or placebo. Worsening heart failure was defined based on a standardized, physician-determined assessment of worsening of the patients’ signs or symptoms of HF requiring intervention during the preceding 24 h as described previously.1,7,8 The WHF status was documented daily from day 2 to day 7. Death from any cause or rehospitalization for cardiovascular or renal causes to day 60 was a pre-specified secondary endpoint. Vital status was assessed at 180 days. An independent Clinical Events Committee adjudicated the primary reason for rehospitalization and cause of death to day 60. The investigation conforms with the principles outlined in the Declaration of Helsinki. The PROTECT study was approved by the appropriate regulatory authorities and Ethics Committees before patient enrolment, and written informed consent was obtained from each patient before entry (ClinicalTrials.gov numbers NCT00328692 and NCT00354458).
Analysis cohort
For the present post hoc analysis, we limited the cohort to patients surviving to day 7 with documentation of follow-up past day 7. Patients without documentation of WHF evaluation were also excluded.
Definitions
For the present analysis, time of occurrence of WHF was determined based on the first occurrence of WHF, with early WHF defined as days 2–3 while late WHF occurred on days 4–7. These time-points were selected a priori for this post hoc analysis based on perceived clinical relevance and the availability of WHF documentation from days 2–7. The level of intensification of therapy was also defined a priori for this post hoc analysis as high intensity [documented initiation of inotropes, vasopressors and inodilators; circulatory support, ventilator support, and ultrafiltration [UF] at any time through day 7] vs. low intensity (restarting/increasing diuretics or initiating vasodilators without high intensity interventions). We performed an additional analysis to assess whether reclassifying the vasodilator patients as high-intensity changed the overall findings (i.e. low-intensity consisted of diuretic-based initiation/escalation alone).
Outcomes of interest
The outcomes for the present analysis were assessed from day 7 post-randomization and included death or cardiovascular/renal hospitalization to 60 days, death or all-cause hospitalization to 60 days, and death to 180 days post-randomization. Primary outcome evaluation was performed after day 7 since WHF was assessed through this time-point and patients who died on or before day 7 were excluded. Inhospital mortality, index hospital length of stay and duration of stay in intensive care were assessed. We were also interested in identifying clinical factors associated with the time of occurrence of WHF and the intensity of therapy for WHF.
Statistical methods
Demographics, physical and laboratory findings, medical history, and therapies were summarized as frequencies and percentages for categorical variables and by the medians and 25th and 75th percentiles for continuous variables for three different comparisons: WHF vs. no WHF, early vs. late WHF and low-intensity vs. high-intensity therapy. Baseline characteristics were compared using the Wilcoxon rank sum test for continuous variables, and chi-square tests or exact tests for categorical variables as appropriate.
Logistic regression models were generated in order to describe the association between baseline covariates and WHF, late WHF (vs. early WHF), and high-intensity intervention (vs. low-intensity intervention). The covariates included in the models were chosen based on previous PROTECT analysis12,13 and were: history of diabetes mellitus, hospitalization for HF in past year, respiratory rate, blood urea nitrogen (BUN), cholesterol, albumin, pulse, and SBP. We also assessed whether treatment with rolofylline was associated with WHF, early vs. late WHF and low-intensity vs. high-intensity therapy for WHF.
We report the event rates for outcomes, hospital length of stay, and intensive care days for the WHF groups. We assessed the association between WHF time of occurrence and the intensity of treatment with the clinical endpoints. Cox regression models for the time to first occurrence of each endpoint were fitted to quantify the hazard ratio for each comparison group. An unadjusted model was fit first, followed by an adjusted model using baseline covariates, and then an updated adjusted model using the same covariates updated with their day 7 values. Variables previously shown to be associated with the outcomes were used for the multivariable analyses:12,13 age, hospitalization for HF in past year, severity of peripheral oedema, systolic blood pressure, serum sodium, BUN, creatinine, and albumin. We examined the interaction between randomized treatment (rolofylline or placebo) and WHF with regard to each outcome using an interaction term (treatment × WHF) in the multivariable model for each endpoint. Hazard ratios (HRs) were calculated with corresponding 95% confidence intervals (CIs). Event rate curves were shown using Kaplan–Meier estimates. Statistical significance was assessed using two-sided P-values. A P-value <0.05 was considered statistically significant. In all regression models, the assumption of a linear relationship between the dependent variable and each continuous covariate was evaluated by comparing the goodness of fit with a more flexible restricted cubic spline model, and a logarithmic or linear spline transformation was applied to approximate the non-linear association where appropriate. In the Cox regression models, the assumption of proportional hazards for the variables of primary interest (e.g. WHF) was evaluated by allowing the coefficient for this variable to vary as a function of log time in the models adjusting for baseline covariates and testing the statistical significance of the time-varying component. For the adjustment covariates, the assumption of proportional hazards had been evaluated previously13 and was not examined in this analysis. All statistical analysis was conducted at the Duke Clinical Research Institute (Durham, NC, USA) using SAS version 9.2 or higher (SAS Institute Inc., Cary, NC, USA).
Results
Figure 1 presents the patients included in this analysis. Of 1879 AHF patients, 12.7% (n = 238) experienced WHF: 47.9% early and 52.1% late. Treatment intensity was low in 72.3% and high in 24.8% (2.9% missing). The baseline patient characteristics by WHF group are presented in Table 1. Table 2 presents the qualifying events for WHF in the different patient groups. Patients with WHF more often had hospitalization owing to HF in the previous year, had an increased prevalence of diabetes, lower baseline systolic blood pressure, and higher BUN and creatinine compared with those who did not experience WHF. There were relatively few between-group differences when comparing patients with early vs. late WHF. Patients with late WHF had a trend toward younger age and had higher baseline haemoglobin compared with those with early WHF. Compared with patients receiving low-intensity therapy, patients receiving high intensity therapy were younger, with increased baseline jugular venous pressure (JVP) and BUN, and lower SBP and serum sodium. In terms of medication differences between the groups, patients that experienced WHF and specifically those receiving high-intensity therapy had similar baseline use of angiotensin-converting enzyme (ACE) inhibitors/angiotensin receptor antagonists (ARBs) and beta-blockers but lower use at discharge compared with those without WHF.
Figure 1.
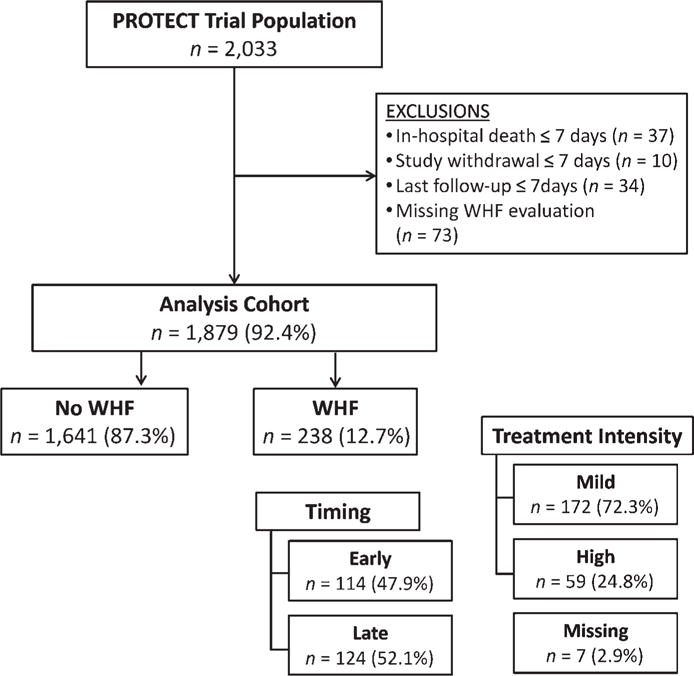
Study population. PROTECT, Placebo-Controlled Randomized Study of the Selective A1 Adenosine Receptor Antagonist Rolofylline for Patients Hospitalized With Acute Decompensated Heart Failure and Volume Overload to Assess Treatment Effect on Congestion and Renal Function; WHF, worsening heart failure.
Table 1.
Characteristics of the study population based on time of occurrence of worsening heart failure (WHF) and intensity of therapy
| Characteristic | Presence or absence of WHF
|
Time of occurrence of WHF
|
Intensity of therapy
|
||||||
|---|---|---|---|---|---|---|---|---|---|
| No WHF (n = 1641) |
WHF (n = 238) |
P-value | Early WHF (n = 114) |
Late WHF (n = 124) |
P-value | Low intensity (n = 172) |
High intensity (n = 59) |
P-value | |
| Age, years | 72 (62, 79) | 72 (62, 78) | 0.93 | 73 (65, 78) | 70 (60, 78) | 0.077 | 73 (63, 79) | 68 (57, 75) | <0.001 |
| Male sex | 1090 (66.4) | 168 (70.6) | 0.20 | 78 (68.4) | 90 (72.6) | 0.48 | 118 (68.6) | 45 (76 3) | 0.27 |
| HF history | |||||||||
| HF hospitalization in previous year | 783 (47.7) | 1 41 (59.2) | <0.001 | 67 (58.8) | 74 (59.7) | 0.89 | 97 (56.4) | 41 (69.5) | 0.077 |
| Ischaemic aetiology | 1130 (68.9) | 170 (71.7) | 0.38 | 80 (70.8) | 90 (72.6) | 0.76 | 125 (73.1) | 40 (67.8) | 0.44 |
| Ejection fraction, % | 30 (23, 40) | 27 (20, 38) | 0.038 | 29 (24, 40) | 25 (20, 35) | 0.15 | 27 (20, 38) | 26 (1 6, 40) | 0.30 |
| Ejection fraction <40% | 561 (72.0) | 93 (76.2) | 0.33 | 42 (72.4) | 51 (79.7) | 0.35 | 64 (77.1) | 26 (74.3) | 0.74 |
| NYHA class 1 month previously | 0.018 | 0.59 | 0.11 | ||||||
| None/I/II | 347 (21.1) | 57 (24.2) | 30 (26.5) | 27 (22.0) | 47 (27.6) | 9 (15.3) | |||
| III | 784 (47.8) | 127 (53.8) | 57 (50.4) | 70 (56.9) | 89 (52.4) | 33 (55.9) | |||
| IV | 510 (31.1) | 52 (22.0) | 26 (23.0) | 26 (21.1) | 34 (20.0) | 17 (28.8) | |||
| Past medical history | |||||||||
| Hypertension | 1307 (79.6) | 1 89 (79.4) | 0.93 | 94 (82.5) | 95 (76.6) | 0.27 | 140 (81.4) | 42 (71 2) | 0.098 |
| Diabetes mellitus | 724 (44.1) | 133 (56.1) | <0.001 | 61 (54.0) | 72 (58.1) | 0.53 | 101 (59.1) | 26 (44 1) | 0.046 |
| Atrial fibrillation or flutter | 876 (53.7) | 137 (58.1) | 0.21 | 71 (62.8) | 66 (53.7) | 0.15 | 97 (57.1) | 35 (59.3) | 0.76 |
| Stroke or PVD | 297 (18.1) | 48 (20.3) | 0.43 | 26 (23.0) | 22 (1 7.7) | 0.31 | 31 (18.1) | 13 (22.0) | 0.51 |
| Signs and Symptoms of HF on Day 1 | |||||||||
| Peripheral oedema | 0.029 | 0.54 | 0.61 | ||||||
| 0 | 242 (14.7) | 25 (10.5) | 12 (10.5) | 13 (10.5) | 19 (11.0) | 4 (6.8) | |||
| 1+ | 289 (17.6) | 50 (21.0) | 28 (24.6) | 22 (17.7) | 37 (21.5) | 12 (20.3) | |||
| 2+ | 674 (41.1) | 84 (35.3) | 36 (31.6) | 48 (38.7) | 63 (36.6) | 20 (33.9) | |||
| 3+ | 436 (26.6) | 79 (33.2) | 38 (33.3) | 41 (33.1) | 53 (30.8) | 23 (39.0) | |||
| Rales | 0.86 | 0.49 | 0.068 | ||||||
| No rales | 166 (10.1) | 22 (9.2) | 11 (9.6) | 11 (8.9) | 11 (6.4) | 9 (15.3) | |||
| Rales <1/3 | 477 (29.1) | 75 (31.5) | 34 (29.8) | 41 (33.1) | 54 (31.4) | 1 6 (27.1) | |||
| Rales 1/3–2/3 | 838 (.51.1) | 117 (49.2) | 54 (47.4) | 63 (50.8) | 92 (53.5) | 25 (42.4) | |||
| Rales >2/3 | 158 (9.6) | 24 (10.1) | 15 (13 .2) | 9 (7.3) | 15 (8.7) | 9 (15.3) | |||
| JVP | 0.46 | 0.94 | 0.003 | ||||||
| <6 cm | 176 (11.9) | 24 (1 0.9) | 12 (11.7) | 12 (10.3) | 22 (13.8) | 1 (1 .8) | |||
| 6–10 cm | 712 (48.0) | 98 (44.5) | 45 (43.7) | 53 (45.3) | 75 (47.2) | 20 (35.7) | |||
| >1 0 cm | 595 (40.1) | 98 (44.5) | 46 (44.7) | 52 (44.4) | 62 (39.0) | 35 (62.5) | |||
| Orthopnoea | 0.070 | 0.55 | 0.61 | ||||||
| None | 62 (3.8) | 11 (4.7) | 6 (5.3) | 5 (4.1) | 10 (5.9) | 1 (1.7) | |||
| One pillow (10 cm) | 192 (11.8) | 29 (12.3) | 11 (9.6) | 18 (14.8) | 19 (11.2) | 8 (13.6) | |||
| Two pillows (20 cm) | 679 (41.9) | 78 (33.1) | 36 (31.6) | 42 (34.4) | 55 (32.4) | 20 (33.9) | |||
| >30degrees | 688 (42.4) | 118 (50.0) | 61 (53.5) | 57 (46.7) | 86 (50.6) | 30 (50.8) | |||
| Persistent congestion day 1 | 1611 (98.2) | 228 (95.8) | 0.018 | 110 (96.5) | 118 (95.2) | 0.64 | 1 66 (96.5) | 56 (94.9) | 0.56 |
| Physical Examination | |||||||||
| BMI, kg/m2 | 27.7 (24.4, 31.8) | 28.4 (24.7, 32.6) | 0.16 | 27.8 (24.5, 32.3) | 29.0 (24.9, 32.7) | 0.30 | 28.5 (25.2, 32.8) | 27.6 (24.3, 32.3) | 0.55 |
| Systolic BP, mmHg | 125 (110, 140) | 120 (106, 132) | <0.001 | 120 (105, 134) | 115 (108, 131) | 0.47 | 120 (109, 135) | 110 (100, 122) | 0.001 |
| Heart rate, bpm | 79 (70, 90) | 77 (70, 90) | 0.80 | 75 (68, 90) | 78 (70, 88) | 0.79 | 76 (69, 90) | 77 (70, 90) | 0.51 |
| Respiratory rate, resp/min | 20 (1 8, 24) | 22 (19, 24) | 0.015 | 22 (19, 24) | 22 (20, 24) | 0.72 | 22 (20, 24) | 20 (1 8, 24) | 0.22 |
| Laboratories on day 1 | |||||||||
| Sodium, mmol/L | 140 (137, 142) | 140 (136, 142) | 0.050 | 139 (136, 143) | 140 (136, 141) | 0.76 | 140 (137, 142) | 138 (135, 140) | 0.002 |
| Creatinine, mg/dL | 1.3 (1.1, 1.7) | 1.5 (1.3, 2.1) | <0.001 | 1.5 (1.2, 2.1) | 1.6 (1.3, 2.1) | 0.43 | 15 (1.3, 2.0) | 1.7 (1.3, 2.2) | 0.077 |
| eGFR*, mL/min.1.73 m2 | 47.4 (35.6, 61.1) | 37.5 (29.2, 51.8) | <0.001 | 37.9 (29.6, 53.9) | 37.1 (28.9, 51.7) | 0.95 | 37.9 (29.3, 53.3) | 34.2 (27.7, 48.7) | 0.22 |
| Blood urea nitrogen, mg/dL | 28 (21, 39) | 38 (27, 53) | <0.001 | 38 (27, 50) | 38 (27, 53) | 0.79 | 35 (27, 48) | 45 (29, 61) | 0.011 |
| Haemoglobin, g/dL | 12.7 (11.3, 14.1) | 12.2 (11.0, 13.7) | 0.01 3 | 11.9 (10.9, 13.3) | 12.5 (11.3, 14.1) | 0.048 | 12.2 (11.3, 13.5) | 11.6 (10.6, 14.1) | 0.88 |
| Albumin, g/dL | 3.9 (3.6, 4.2) | 3.8 (3.5, 4.1) | 0.024 | 3.8 (3.5, 4.0) | 3.8 (3.6, 4.1) | 0.23 | 3.8 (3.6, 4.1) | 3.8 (3.4, 4.1) | 0.72 |
| Total cholesterol, mg/dL | 144 (119, 175) | 128 (103, 160) | <0.001 | 128 (101, 161) | 1 28 (1 04, 1 59) | 0.71 | 131 (109, 162) | 120 (95, 149) | 0.033 |
| ALT, U/L | 21 (1 5, 32) | 20 (1 5, 30) | 0.19 | 21 (16, 30) | 19 (14, 30) | 0.28 | 20 (15, 30) | 20 (14, 30) | 0.90 |
| BNP, pg/mL | 0.37 | 0.86 | 0.030 | ||||||
| <1000 | 159 (37.9) | 22 (31.0) | 11 (31.4) | 11 (30.6) | 11 (22.9) | 11 (50.0) | |||
| 1000–1999 | 144 (34.3) | 22 (31.0) | 12 (34.3) | 10 (27.8) | 16 (33.3) | 5 (22.7) | |||
| 2000–2999 | 54 (12.9) | 12 (16.9) | 6 (17.1) | 6 (16.7) | 7 (1 4.6) | 5 (22.7) | |||
| >3000 | 63 (1 5.0) | 15 (21.1) | 6 (17.1) | 9 (25.0) | 14 (29.2) | 1 (4.5) | |||
| NT-proBNP, pg/mL | 0.75 | 0.56 | 0.68 | ||||||
| <1 000 | 3 (0.2) | 0 (0.0) | – | – | – | – | |||
| 1000–1 999 | 17 (1.4) | 1 (0.6) | 0 (0.0) | 1 (1.1) | – | – | |||
| 2000–2999 | 242 (19.5) | 31 (18.6) | 16 (20.3) | 15 (17.0) | 23 (18.5) | 8 (21.6) | |||
| >3000 | 982 (78.9) | 135 (80.8) | 63 (79.7) | 72 (81.8) | 101 (81.5) | 29 (78.4) | |||
| Baseline medications (2weeks before admission) and devices | |||||||||
| ACE-inhibitor or ARB | 1254 (76.4) | 174 (73.1) | 0.26 | 86 (75.4) | 88 (71.0) | 0.44 | 131 (76.2) | 38 (64.4) | 0.079 |
| Beta blocker | 1 258 (76.7) | 190 (79.8) | 0.28 | 91 (79.8) | 99 (79.8) | 1.00 | 137 (79.7) | 48 (81.4) | 0.78 |
| Aldosterone antagonists | 726 (44.2) | 100 (42.0) | 0.52 | 48 (42.1) | 52 (41.9) | 0.98 | 63 (36.6) | 35 (59.3) | 0.002 |
| Nitrates | 41 9 (25.5) | 63 (26.5) | 0.76 | 31 (27.2) | 32 (25.8) | 0.81 | 44 (25.6) | 17 (28.8) | 0.63 |
| Digoxin | 468 (28.5) | 70 (29.4) | 0.78 | 33 (28.9) | 37 (29.8) | 0.88 | 47 (27.3) | 21 (35.6) | 0.23 |
| ICD | 247 (15.1) | 62 (26.1) | <.001 | 28 (24.6) | 34 (27.4) | 0.62 | 36 (20.9) | 25 (42.4) | 0.001 |
| Biventricular pacemaker | 1 55 (9.5) | 36 (15.1) | 0.007 | 14 (12.3) | 22 (17.7) | 0.24 | 20 (11.6) | 16 (27.1) | 0.005 |
| Loop diuretic between randomization and discharge or day 7 if earlier | |||||||||
| Total IV loop diuretic (furosemide equiv.), mg | 240 (120, 480) | 585 (260, 1300) | <.001 | 710 (280, 1461) | 490 (250, 1148) | 0.089 | 490 (240, 1023) | 1255 (440, 2997) | <0.001 |
| Total oral loop diuretic (furosemide equiv.), mg | 160 (80, 320) | 100 (0, 300) | <.001 | 90 (0, 240) | 110 (0, 320) | 0.15 | 120 (0, 320) | 0 (0, 250) | 0.010 |
| Medications at Discharge (or day 7 if earlier) | |||||||||
| ACE-inhibitor or ARB | 1394 (84.9) | 165 (69.3) | <0.001 | 79 (69.3) | 86 (69.4) | 0.99 | 129 (75.0) | 30 (50.8) | <0.001 |
| Beta blocker | 1422 (86.7) | 187 (78.6) | <0.001 | 90 (78.9) | 97 (78.2) | 0.89 | 145 (84.3) | 37 (62.7) | <0.001 |
| Aldosterone antagonists | 1021 (62.2) | 122 (51.3) | 0.001 | 58 (50.9) | 64 (51.6) | 0.91 | 87 (50.6) | 31 (52.5) | 0.80 |
| Nitrates | 327 (20.0) | 54 (22.7) | 0.33 | 29 (25.4) | 25 (20.2) | 0.33 | 38 (22.1) | 14 (23.7) | 0.80 |
| Digoxin | 539 (32.9) | 86 (36.1) | 0.32 | 44 (38.6) | 42 (33.9) | 0.45 | 56 (32.6) | 29 (49.2) | 0.023 |
ACE, angiotensin converting enzyme; ALT, alanine aminotransferase; ARB, angiotensin receptor blocker; BMI, body mass index; BP, blood pressure; BUN, blood urea nitrogen; EF, ejection fraction; eGFR, estimated glomerular filtration rate; EQ-5D, EuroQol questionnaire measuring health outcome; HF, heart failure; ICD, implantable cardioverter defibrillator; JVP, jugular venous pressure; NYHA, New York Heart Association; PVD, peripheral vascular disease.
Values are presented as median (IQR) or n (percentage).
eGFR calculated from central laboratory using MDRD formula.
Table 2.
Treatments received by patients with worsening heart failure (WHF)
| Any WHF (n = 238) | Time of occurrence
|
Intensity
|
|||
|---|---|---|---|---|---|
| Early WHF (n = 114) | Late WHF (n = 124) | Low (n = 172) | High (n = 59) | ||
| Initiation of medication* | |||||
| Inotropes | 44 (18.8) | 20 (17.5) | 24 (20.0) | – | 44 (74.6) |
| Vasopressor | 4 (1.7) | 4 (3.5) | 0 (0.0) | – | 4 (6.8) |
| Vasodilator | 30 (12.8) | 21 (18.4) | 9 (7.5) | 24 (14.0) | 6 (10.2) |
| Inodilator | 12 (5.1) | 2 (1.8) | 10 (8.3) | – | 12 (20.3) |
| Restarting or increasing IV loop diuretic | 182 (77.8) | 93 (81.6) | 89 (74.2) | 150 (87.2) | 32 (54.2) |
| Thiazide diuretic | 10 (4.3) | 8 (7.0) | 2 (17) | 8 (4.7) | 2 (3.4) |
| Circulatory support | 1 (0.4) | 1 (0.9) | 0 (0.0) | – | 1 (1.7) |
| Ventilator support | 6 (2.6) | 4 (3.5) | 2 (17) | – | 6 (10.2) |
| Ultrafiltration | 6 (2.6) | 2 (1.8) | 4 (3.3) | – | 6 (10.2) |
Data presented as n (%).
Initiation of inotropes (dobutamine or dopamine), vasopressors (noradrenaline, adrenaline, or phenylephrine), vasodilators (nesiritide, nitroglycerine, or nitroprusside), inodilators (milrinone, levosimendan, or enoximone), and thiazides (chlorthiazide or metolazone).
In general, physician-diagnosed WHF was most commonly treated by restarting or increasing intravenous loop diuretic therapy. Inotrope initiation was the second most common therapeutic intervention, while circulatory or ventilatory support were relatively uncommon. Early WHF more commonly involved vasodilator initiation and thiazide diuretic use, while late WHF involved increased use of inodilator and UF therapy. High-intensity therapy consisted mostly of inotrope use.
Factors associated with WHF as well as the time of occurrence and intensity of therapy are presented in Table 3. The strongest factor associated with the presence of WHF and the use of high-intensity therapy was BUN. Other factors associated with WHF included a history of diabetes, higher respiratory rate, and lower baseline SBP. None of the pre-specified variables were significantly associated with the time of occurrence of WHF. The addition of rolofylline to the WHF models (i.e. presence of WHF, late WHF or high-intensity therapy) did not result in a significant association (all P > 0.18)
Table 3.
Variables associated with time of occurrence of worsening heart failure (WHF) and intensity of therapy*
| Covariate | Presence of WHF
|
Late WHF
|
High Intensity
|
||||||
|---|---|---|---|---|---|---|---|---|---|
| OR (95% CI) | Chi-square | P-value | OR (95% CI) | Chi-square | P-value | OR (95% CI) | Chi-square | P-value | |
| History of diabetes mellitus (Yes vs. No) | 1.47 (1.10, 1.97) | 6.7 | 0.010 | 1.27 (0.74, 2.18) | 0.8 | 0.38 | 0.53 (0.27, 1.03) | 3.5 | 0.063 |
| Hospitalization for HF in past year (Yes vs. No) | 1.31 (0.98, 1.74) | 3.3 | 0.067 | 0.99 (0.58, 1.69) | 0.0 | 0.98 | 1.58 (0.81, 3.10) | 1.8 | 0.18 |
| Respiratory rate (5 breaths/min increase) | 1.32 (1.12, 1.55) | 11.4 | <.001 | 0.91 (0.67, 1.22) | 0.4 | 0.52 | 0.94 (0.64, 1.39) | 0.1 | 0.77 |
| BUN (20% increase) | 1.20 (1.13, 1.27) | 35.8 | <.001 | 1.04 (0.93, 1.15) | 0.4 | 0.50 | 1.20 (1.05, 1.37) | 7.2 | 0.007 |
| Cholesterol (40 mg/dL increase) | 6.7 | 0.035 | 0.8 | 0.67 | 2.7 | 0.25 | |||
| For cholesterol <160 mg/dL | 0.75 (0.59, 0.95) | 1.17 (0.76, 1.80) | 0.66 (0.39, 1.11) | ||||||
| For cholesterol ≥160 mg/dL | 1.00 (0.76, 1.32) | 1.06 (0.64, 1.77) | 1.42 (0.77, 2.62) | ||||||
| Albumin (0.5 g/dL increase) | 0.92 (0.77, 1.09) | 1.0 | 0.32 | 1.19 (0.87, 1.63) | 1.2 | 0.28 | 1.04 (0.70, 1.54) | 0.0 | 0.85 |
| Pulse (5 bpm increase) | 1.03 (0.98, 1.08) | 1.7 | 0.20 | 1.01 (0.93, 1.10) | 0.1 | 0.82 | 1.09 (0.98, 1.21) | 2.4 | 0.12 |
| Systolic BP (10 mmHg increase) | 0.87 (0.79, 0.95) | 10.1 | 0.001 | 0.92 (0.79, 1.08) | 1.1 | 0.30 | 0.79 (0.64, 0.98) | 4.8 | 0.029 |
BP, blood pressure; BUN, blood urea nitrogen; HF, heart failure; WHF, worsening heart failure within 7 days of randomization.
Reference is ‘no WHF’ for the column with presence of WHF; ‘early WHF’ for the late WHF column and ‘low intensity’ for the high-intensity column. To account for non-linear associations, BUN was modelled using a logarithmic transformation and cholesterol was modelled using a linear spline transformation with a knot at 160 mg/dL.
Table 4 presents the event rate and length of stay data by WHF group. Length of stay and ICU days were increased in patients with WHF compared to those without WHF, with the most marked increase in the group requiring high-intensity therapy. In-hospital death, as well as the 60- and 180-day outcomes, were markedly increased in patients with WHF compared with those without. In general, event rates were similar when comparing early and late WHF. Figure 2 displays the unadjusted event rate curves. After adjusting for baseline predictors of outcomes, WHF was associated with a trend toward increased 60-day death or cardiovascular/renal hospitalization (HR 1.26, 95% CI 0.99–1.60) and increased 180-day death (HR 1.77, 95% CI 1.33–2.34) (Table 5). There was no evidence of a significant differential association between the time of occurrence or intensity of therapy and outcomes. For example, high-intensity therapy was not associated with a significant difference in 60-day death or cardiovascular/renal hospitalization (HR 1.27, 95% CI 0.76–2.14, P = 0.36) or 180-day death (HR 1.44 95% CI 0.80–2.59, P = 0.23), although HR estimates are imprecise because of small subgroup sizes. For the comparison of high-intensity vs. low-intensity intervention, there was evidence that the relative hazards for mortality changed over the 180-day follow-up period (P = 0.0053 for interaction with log time) with the HR higher earlier during follow-up and decreasing as a function of follow-up time. Owing to small subgroup sizes and few events later in the follow-up period, HR estimates broken down by different follow-up intervals are likely to be imprecise and were not estimated. No evidence of non-proportional hazards was found for other endpoints or comparison groups. Adjustment for day 7 variables yielded similar results (see the Supplementary material online, Table S1). When the vasodilator group was reclassified to high-intensity, the nominal association between high-intensity therapy and outcomes was further attenuated (see the Supplementary material online, Table S2).
Table 4.
Event rates and length of stay by worsening heart failure (WHF) group
| Presence of WHF
|
Late WHF
|
Intervention intensity
|
|||||||
|---|---|---|---|---|---|---|---|---|---|
| No WHF (n = 1641) |
WHF (n = 238) |
P-value | Early WHF (n = 114) |
Late WHF (n = 124) |
P-value | Low (n = 172) |
High (n = 59) |
P-value | |
| Length of stay (days) | 8 (6, 13) | 13 (8, 19) | <0.001 | 12 (7, 18) | 14 (8, 19) | 0.70 | 12 (7, 16) | 17 (13, 26) | <0.001 |
| Days in intensive care | 1 (0, 4) | 3 (0, 8) | <0.001 | 4 (0, 9) | 2 (0, 7) | 0.059 | 3 (0, 7) | 7 (2, 14) | <0.001 |
| In-hospital death# | 15 (0.9) | 14 (5.9) | <0.001 | 8 (7.0) | 6 (4.9) | 0.49 | 6 (3.5) | 8 (13.8) | 0.005 |
| Death or CV/renal rehospitalization (60 days)* | 400 (27.4) | 84 (35.9) | <0.001 | 39 (34.2) | 45 (37.4) | 0.77 | 56 (32.6) | 25 (42.5) | 0.15 |
| Death or rehospitalization (60 days)* | 475 (32.0) | 99 (42.6) | <0.001 | 45 (40.2) | 54 (44.9) | 0.57 | 68 (40.1) | 28 (47.6) | 0.22 |
| Death up to day 180* | 209 (12.8) | 67 (28.2) | <0.001 | 32 (28.1) | 35 (28.4) | 0.99 | 46 (26.9) | 21 (35 6) | 0.094 |
CV, cardiovascular.
Data presented as median (IQR) or number of events (%) unless otherwise indicated. P-values for length of stay and days in intensive care were calculated using Wilcoxon test; P-values for inhospital death were calculated using chi-square test; P-values for 60- and 180-day endpoints were calculated using the log-rank test.
37 patients with death on/before day 7 were excluded from analysis.
Presented as number of patients with event (cumulative % with event at end of follow-up period). Cumulative % estimated by the Kaplan-Meier method, using first event occurring after day 7.
Figure 2.
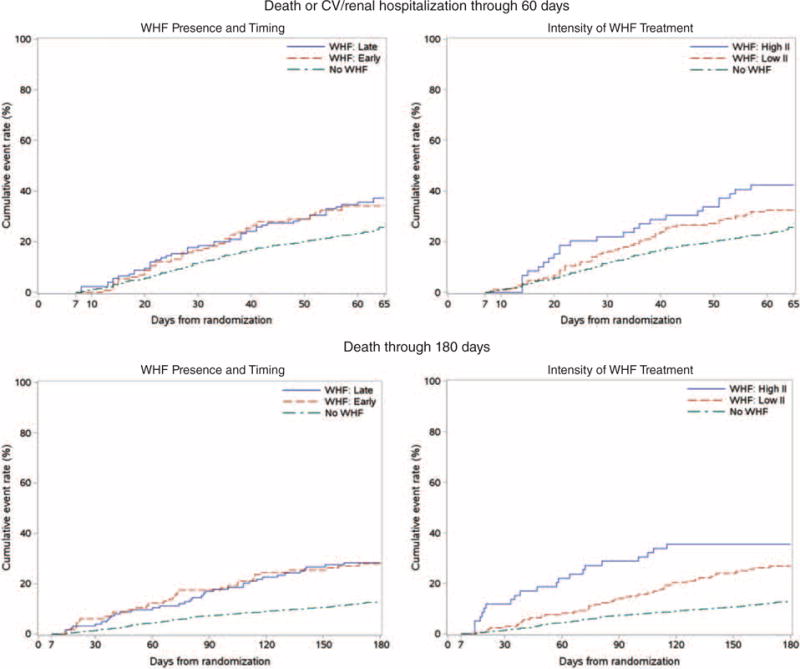
Unadjusted event rate curves by worsening heart failure (WHF) group. (A) Death or CV/renal hospitalization up to 60 days; (B) death up to 180 days.
Table 5.
Association between outcomes and worsening heart failure (WHF)
| Outcomes | Presence of WHF
|
Late WHF
|
High Intensity
|
|||||||||
|---|---|---|---|---|---|---|---|---|---|---|---|---|
| Unadjusted HR (95% CI) | P-value | Adjusted* HR (95% CI) | P-value | Unadjusted HR (95% CI) | P-value | Adjusted* HR (95% CI) | P-value | Unadjusted HR (95% CI) | P-value | Adjusted* HR (95% CI) | P-value | |
| Death or CV/renal rehospitalization (60 days) | 1.54 (1.22, 1.95) | <0.001 | 1.26 (0.99, 1.60) | 0.063 | 1.07 (0.70, 1.64) | 0.77 | 1.17 (0.75, 1.83) | 0.50 | 1.41 (0.88, 2.26) | 0.15 | 1.27 (0.76, 2.14) | 0.36 |
| Death or rehospitalization (60 days) | 1.55 (1.25, 1.93) | <0.001 | 1.29 (1.03, 1.61) | 0.027 | 1.12 (0.75, 1.67) | 0.57 | 1.17 (0.78, 1.76) | 0.46 | 1.32 (0.85, 2.05) | 0.22 | 1.19 (0.73, 1.93) | 0.48 |
| Death up to day 180 | 2.46 (1.87, 3.25) | <0.001 | 1.77 (1.33, 2.34) | <0.001 | 1.00 (0.62, 1.61) | 0.99 | 1.07 (0.65, 1.75) | 0.80 | 1.55 (0.93, 2.60) | 0.096 | 1.44 (0.80, 2.59) | 0.23 |
CI, confidence interval; CY cardiovascular; HR, hazard ratio.
The reference for HR is ‘no WHF’ for the column with presence of WHF; ‘early WHF’ for the late WHF column and ‘low intensity’ for the high-intensity column.
Adjusted for PROTECT model covariates age, hospitalisation for HF in the past year, severity of peripheral oedema (day 1), systolic blood pressure, serum sodium (day 1), urea (day 1), creatinine (day 1), and albumin (day 1). To account for non-linear associations, blood urea nitrogen and albumin were modelled using a linear spline transformation with knots at 45 mg/dL and 3.5 g/dL, respectively.
There was evidence of a significant interaction between rolofylline and WHF for the endpoint of 180-day death (interaction P = 0.020), but not for the other endpoints (both interaction p-value> 0.3). On unadjusted analysis, the association between WHF and 180-day mortality in patients randomized to placebo yielded a HR of 3.88 (95% CI 2.46–6.11) vs. 1.96 (95% CI 1.38–2.78) in patients randomized to rolofylline. Following adjustment for baseline covariates, the interaction P-value remained significant (interaction P-value=0.007) with a HR of 2.99 (95% CI 1.89–4.74) with placebo vs. 1.35 (95% CI 0.94–1.93) with rolofylline. Thus, randomization to rolofylline attenuated the association between WHF and increased 180-day mortality.
Discussion
In a large international acute HF trial, we found that WHF as diagnosed by a standardized, physician-determined assessment occurred in approximately 13% of patients and was associated with a 77% increase in 180-day mortality. Our findings related to the time of occurrence of WHF and intensity of therapy did not support our hypothesis. We did not observe a differential association between the time of occurrence or intensity of therapy and outcomes. Although high intensity therapy was associated with a nominal increase in both 60-day and 180-day outcomes compared with low-intensity therapy, these differences did not reach statistical significance. These data suggest that the occurrence of physician-determined WHF may be associated with increased mortality through 180 days regardless of the time of occurrence or intensity of therapy required. We also found that rolofylline appeared to attenuate the association between WHF and increased 180-day mortality.
The primary finding of this analysis was that occurrence of WHF appears to have prognostic value independent of its time of occurrence or the therapeutic intensity used to manage WHF. Previous studies demonstrating the association between WHF and poor outcomes4 did not assess whether there were prognostic implications related to the time of occurrence of WHF. Moreover, previous studies tended to define WHF based on documented use of intravenous therapies, intensive care unit transfers and/or mechanical support,4 but did not involve a standardized physician assessment. The strength of the present analysis is that therapy adjustment was documented to result from physician-assessed WHF and not merely from inadequate initial diuresis, comorbid diseases (e.g. renal dysfunction) or other non-specific criteria. Thus, the development of WHF should be recognized for its important prognostic implications. Once WHF has been identified, clinicians can focus efforts on identifying the cause for the deterioration and individualize targeted therapies.
Several baseline characteristics were associated with the development of WHF. In particular, a history of diabetes, baseline respiratory rate and SBP, and BUN appear to be the strongest factors associated with WHF. Interestingly, none of the pre-specified clinical characteristics were associated with the time of occurrence of the development of WHF. Similarly, only higher BUN and lower SBP were observed to correlate with an increased intensity of therapy directed at WHF. Further efforts are needed to better identify patients who are more likely to develop WHF and could benefit from closer monitoring and early intervention.
Despite earlier studies demonstrating that WHF was associated with worse short-term and long-term outcomes,4 we found the strongest association with 180-day mortality. The specific reasons for these observations are unclear. We hypothesize that WHF may be the clinical manifestation of an underlying pathophysiological insult with long-term consequence. These data are supported by recent data from the RELAXin in Acute Heart Failure (RELAX-AHF) trial, which showed that serelaxin use during AHF hospitalization is associated with a reduction in WHF and a survival benefit at 180 days.9 Recent biomarker data from RELAX-AHF14 provide mechanistic data to support serelaxin’s role in positively effecting the underlying pathophysiological abnormalities in AHF patients. The present data further support the hypothesis that WHF during AHF has an association with 180-day endpoints. Interestingly, we found that rolofylline attenuated the association between WHF and increased 180-day mortality. While the primary PROTECT trial was neutral for the primary end-point including survival,8 HF status, and changes in renal function, these findings are hypothesis-generating and support further investigation related to a role for short-term inhospital therapies to improve long-term outcomes.
While there was a nominal increase in events associated with high-intensity therapy for WHF compared with low-intensity therapy, these associations were not statistically significant. The specific reasons for these observations are unclear. One possibility is that this subgroup analysis was underpowered. Alternatively, adjustment variables may act as mediators of the outcomes association such that inclusion of variables such as renal function may attenuate the association. Moreover, it is possible that alternative definitions of low- vs. high-intensity therapy may support a stronger association with outcomes.
This was a retrospective analysis from a clinical trial and patients met specific entry criteria. These data may not apply to patients with different clinical characteristics from those included in the PROTECT trial. Despite adjustment, other measured and unmeasured variables may have influenced these results. Further stratifying the WHF group into early vs. late and low- vs. high-intensity led to modest sample sizes in the different groups and likely limited statistical power. Alternative definitions of the time of occurrence or intensity of therapy should be explored in future analysis in order support the current observations. No consensus definition of WHF has been established and the present definition incorporates a clinician’s subjective assessment that may vary across world region.15 Future prospective studies could also document investigator perceptions of whether the development of WHF may have been related to insufficient initial therapy (e.g. insufficient early decongestion). An improved understanding of WHF symptoms within the first 24 h could also support expedited identification and therapeutic intervention.
Conclusion
In a large international HF trial, WHF during index hospitalization was associated with increased 180-day death and a trend toward worse 60-day morbidity/mortality. The time of occurrence and intensity ofWHF therapy may provide less prognostic information than whether or not WHF occurred.
Supplementary Material
Acknowledgments
Funding
C.McK. was supported by NIH grant T32 HL079896. No extramural funding was used to support this work. The authors are solely responsible for the design and conduct of this study, all study analyses, the drafting, and editing of the paper and its final contents.
Footnotes
Supplementary Information
Additional Supporting Information may be found in the online version of this article:
R.J.M. receives research support from the NIH, Amgen, AstraZeneca, Bristol-Myers Squibb, GlaxoSmithKline, Gilead, Novartis, Otsuka, and ResMed; honoraria from Novartis, Thoratec and HeartWare; and has served on an advisory board for Luitpold Pharmaceuticals, Inc. A.A.V. received consultancy fees and/or research grants from Alere, Amgen, AstraZeneca, Bayer, Boehringer Ingelheim, Cardio3Biosciences, Celladon, Merck/MSD, Novartis, Servier, Sphingotec, Singulex, Torrent, Trevena, and Vifor. M.M. received consulting incomes from Bayer, Novartis, and Servier, and honoraria for speeches from Abbott Vascular. E.A.D., G.C. and O.M. are employees of Momentum Research Inc., which was contracted to perform work on the project by Merck. J.G.F.C. was on the steering committee for the study, served on the advisory board for MSD, and received payments for both. J.R.T. has received research funds and consulting fees from Merck and has also received research funds and consulting fees from Abbott, Amgen, Biogen Idec, Corthera, Cytokinetics, Johnson & Johnson/Scios, Novartis, Relypsa, and Solvay for research in related areas. D.M.B. is an employee of Merck. M.M.G. has received institutional research support and served on a scientific Advisory Board for Merck. H.C.D. had ownership in NovaCardia and served as a consultant to Merck. P.P. has received honoraria from Merck, consulting fees from Vifor Pharma and Amgen, Inc., honoraria from Vifor Pharma, and travel/accommodation expenses covered by Vifor Pharma and Amgen, Inc. C.M.O’C. is a consultant to Merck and Amgen. All other authors have reported no relationships relevant to the contents of this paper.
References
- 1.Cotter G, Metra M, Weatherley BD, Dittrich HC, Massie BM, Ponikowski P, Bloomfield DM, O’Connor CM. Physician-determined worsening heart failure: a novel definition for early worsening heart failure in patients hospitalized for acute heart failure – association with signs and symptoms, hospitalization duration, and 60-day outcomes. Cardiology. 2010;115:29–36. doi: 10.1159/000249280. [DOI] [PubMed] [Google Scholar]
- 2.Weatherley BD, Milo-Cotter O, Michael Felker G, Uriel N, Kaluski E, Vered Z, O’Connor CM, Adams KF, Cotter G. Early worsening heart failure in patients admitted with acute heart failure – a new outcome measure associated with long-term prognosis? Fundam Clin Pharmacol. 2009;23:633–639. doi: 10.1111/j.1472-8206.2009.00697.x. [DOI] [PubMed] [Google Scholar]
- 3.Torre-Amione G, Milo-Cotter O, Kaluski E, Perchenet L, Kobrin I, Frey A, Rund MM, Weatherley BD, Cotter G. Early worsening heart failure in patients admitted for acute heart failure: time course, hemodynamic predictors, and outcome. J Card Fail. 2009;15:639–644. doi: 10.1016/j.cardfail.2009.04.001. [DOI] [PubMed] [Google Scholar]
- 4.DeVore AD, Hammill BG, Sharma PP, Qualls LG, Mentz RJ, Waltman Johnson K, Fonarow GC, Curtis LH, Hernandez AF. In-hospital worsening heart failure and associations with mortality, readmission, and healthcare utilization. J Am Heart Assoc. 2014;3:e001088. doi: 10.1161/JAHA.114.001088. [DOI] [PMC free article] [PubMed] [Google Scholar]
- 5.Cotter G, Metra M, Davison BA, Senger S, Bourge RC, Cleland JG, Jondeau G, Krum H, O’Connor CM, Parker JD, Torre-Amione G, van Veldhuisen DJ, Milo O, Kobrin I, Rainisio M, McMurray JJ, Teerlink JR. Worsening heart failure, a critical event during hospital admission for acute heart failure: results from the VERITAS study. Eur J Heart Fail. 2014;16:1362–1371. doi: 10.1002/ejhf.186. [DOI] [PubMed] [Google Scholar]
- 6.McMurray JJ, Teerlink JR, Cotter G, Bourge RC, Cleland JG, Jondeau G, Krum H, Metra M, O’Connor CM, Parker JD, Torre-Amione G, van Veldhuisen DJ, Lewsey J, Frey A, Rainisio M, Kobrin I. Effects of tezosentan on symptoms and clinical outcomes in patients with acute heart failure: the VERITAS randomized controlled trials. JAMA. 2007;298:2009–2019. doi: 10.1001/jama.298.17.2009. [DOI] [PubMed] [Google Scholar]
- 7.Weatherley BD, Cotter G, Dittrich HC, DeLucca P, Mansoor GA, Bloomfield DM, Ponikowski P, O’Connor CM, Metra M, Massie BM. Design and rationale of the PROTECT study: a placebo-controlled randomized study of the selective A1 adenosine receptor antagonist rolofylline for patients hospitalized with acute decompensated heart failure and volume overload to assess treatment effect on congestion and renal function. J Card Fail. 2010;16:25–35. doi: 10.1016/j.cardfail.2009.10.025. [DOI] [PubMed] [Google Scholar]
- 8.Massie BM, O’Connor CM, Metra M, Ponikowski P, Teerlink JR, Cotter G, Weatherley BD, Cleland JG, Givertz MM, Voors A, DeLucca P, Mansoor GA, Salerno CM, Bloomfield DM, Dittrich HC. Rolofylline, an adenosine A1-receptor antagonist, in acute heart failure. N Engl J Med. 2010;363:1419–1428. doi: 10.1056/NEJMoa0912613. [DOI] [PubMed] [Google Scholar]
- 9.Teerlink JR, Cotter G, Davison BA, Felker GM, Filippatos G, Greenberg BH, Ponikowski P, Unemori E, Voors AA, Adams KF, Jr, Dorobantu MI, Grinfeld LR, Jondeau G, Marmor A, Masip J, Pang PS, Werdan K, Teichman SL, Trapani A, Bush CA, Saini R, Schumacher C, Severin TM, Metra M. Serelaxin, recombinant human relaxin-2, for treatment of acute heart failure (RELAX-AHF): a randomised, placebo-controlled trial. Lancet. 2013;381:29–39. doi: 10.1016/S0140-6736(12)61855-8. [DOI] [PubMed] [Google Scholar]
- 10.Packer M, Colucci W, Fisher L, Massie BM, Teerlink JR, Young J, Padley RJ, Thakkar R, Delgado-Herrera L, Salon J, Garratt C, Huang B, Sarapohja T. Effect of levosimendan on the short-term clinical course of patients with acutely decompensated heart failure. JACC Heart Fail. 2013;1:103–111. doi: 10.1016/j.jchf.2012.12.004. [DOI] [PubMed] [Google Scholar]
- 11.Cuffe MS, Califf RM, Adams KF, Jr, Benza R, Bourge R, Colucci WS, Massie BM, O’Connor CM, Pina I, Quigg R, Silver MA, Gheorghiade M. Short-term intravenous milrinone for acute exacerbation of chronic heart failure: a randomized controlled trial. J Am Med Assoc. 2002;287:1541–1547. doi: 10.1001/jama.287.12.1541. [DOI] [PubMed] [Google Scholar]
- 12.O’Connor CM, Mentz RJ, Cotter G, Metra M, Cleland JG, Davison BA, Givertz MM, Mansoor GA, Ponikowski P, Teerlink JR, Voors AA, Fiuzat M, Wojdyla D, Chiswell K, Massie BM. The PROTECT in-hospital risk model: 7-day outcome in patients hospitalized with acute heart failure and renal dysfunction. Eur J Heart Fail. 2012;14:605–612. doi: 10.1093/eurjhf/hfs029. [DOI] [PubMed] [Google Scholar]
- 13.Cleland JG, Chiswell K, Teerlink JR, Stevens S, Fiuzat M, Givertz MM, Davison BA, Mansoor GA, Ponikowski P, Voors AA, Cotter G, Metra M, Massie BM, O’Connor CM. Predictors of postdischarge outcomes from information acquired shortly after admission for acute heart failure: a report from the Placebo-Controlled Randomized Study of the Selective A1 Adenosine Receptor Antagonist Rolofylline for Patients Hospitalized with Acute Decompensated Heart Failure and Volume Overload to Assess Treatment Effect on Congestion and Renal Function (PROTECT) study. Circulation. 2014;7:76–87. doi: 10.1161/CIRCHEARTFAILURE.113.000284. [DOI] [PubMed] [Google Scholar]
- 14.Metra M, Cotter G, Davison BA, Felker GM, Filippatos G, Greenberg BH, Ponikowski P, Unemori E, Voors AA, Adams KF, Jr, Dorobantu MI, Grinfeld L, Jondeau G, Marmor A, Masip J, Pang PS, Werdan K, Prescott MF, Edwards C, Teichman SL, Trapani A, Bush CA, Saini R, Schumacher C, Severin T, Teerlink JR. Effect of Serelaxin on Cardiac, Renal, and Hepatic Biomarkers in the Relaxin in Acute Heart Failure (RELAX-AHF) development program: correlation with outcomes. J Am Coll Cardiol. 2013;61:196–206. doi: 10.1016/j.jacc.2012.11.005. [DOI] [PubMed] [Google Scholar]
- 15.Mentz RJ, Cotter G, Cleland JG, Stevens SR, Chiswell K, Davison BA, Teerlink JR, Metra M, Voors AA, Grinfeld L, Ruda M, Mareev V, Lotan C, Bloomfield DM, Fiuzat M, Givertz MM, Ponikowski P, Massie BM, O’Connor CM. International differences in clinical characteristics, management, and outcomes in acute heart failure patients: better short-term outcomes in patients enrolled in Eastern Europe and Russia in the PROTECT trial. Eur J Heart Fail. 2014;16:614–624. doi: 10.1002/ejhf.92. [DOI] [PMC free article] [PubMed] [Google Scholar]
Associated Data
This section collects any data citations, data availability statements, or supplementary materials included in this article.