Abstract
Objective
Explore relationship between insurance status and survival, determine outcomes that vary based on insurance status, and identify potential areas of intervention.
Study Design
Retrospective cohort analysis of patients who underwent resection of an upper aerodigestive tract malignancy at a single tertiary care hospital during a 5-year period.
Methods
Patients were categorized into four groups by insurance status: Medicaid or uninsured, Medicare and under 65 years of age, Medicare and 65 years or older, and private insurance. Data were collected from the medical record and analyzed with respect to survival and other outcomes.
Results
The final cohort consisted of 860 patients. Survival analysis demonstrated a hazard ratio of 2.1 (95% confidence interval [CI], 1.5–3.0) for the Medicaid/uninsured group when compared to the private insurance group. When adjusted for other variables, mortality was still different across insurance groups (P = 0.002). The following also were different across insurance groups: tumor stage (P < 0.001), American Society of Anesthesiologists score (P < 0.001), length of stay (P < 0.001), and complications (P = 0.021). The Medicaid/uninsured group was most likely to have a complication (odds ratio [OR] = 2.10, 95% CI 1.24–3.56, P = 0.006).
Conclusion
Medicaid/uninsured patients present with more advanced tumors and have poorer survival than privately insured patients. Insurance status is predictive of tumor stage, comorbidity burden, length of stay, and complications. Specifically, the Medicaid/uninsured group had high rates of tobacco use and alcohol abuse, advanced stage tumors, and postoperative complications. Because alcohol abuse and advanced stage also were predictors of poor survival, they may contribute to the survival disparity for socially disadvantaged patients.
Keywords: Head and neck cancer, head and neck reconstruction, socioeconomic status, social determinants of health, surgical outcomes, insurance type
Introduction
In 2015, the Centers for Disease Control and Prevention reported that 10.5% of American adults under 65 years of age were uninsured. An additional 23.5% of this age group was covered by a public healthcare plan.1 Compared to patients with private insurance or Medicare, cancer patients who are uninsured or covered by Medicaid tend to present with more advanced stage tumors and have worse outcomes for several different cancers, including head and neck cancer.2
Head and neck cancer patients who are uninsured or covered by Medicaid have demonstrated worse survival than privately insured patients, even when controlling for factors such as age, gender, race, alcohol and tobacco use, stage at diagnosis, and treatment strategy.2 These patients may have low health literacy and knowledge of concerning symptoms, increased barriers to accessing primary care services, and inability to afford regular dental care. These patients also may have a higher comorbidity burden at the time of surgery, different risk factors for postoperative complications, or insufficient access to follow-up. Medicaid provides improved access to healthcare compared to no insurance; however, both groups are likely to have limited healthcare resources, potentially affecting outcomes. Although theoretical barriers exist and a survival deficit has been demonstrated, no published study has sought to explain this deficit with a comprehensive assessment of the patient's presentation and treatment course. The authors hypothesize that a survival deficit will exist for Medicaid and uninsured patients in our cohort and will be influenced by late stage presentation and high comorbidity burden. Identification of specific contributors to mortality unique to these patients could clarify the direct and indirect influences of insurance status on survival.
Materials and Methods
After receiving approval from the Institutional Review Board at our institution, we performed a retrospective review of all patients who underwent surgery for upper aerodigestive tract malignancies at Wake Forest Baptist Medical Center between January 1, 2007, and August 31, 2012. Patients with International Classification of Diseases, Ninth Revision (ICD-9) diagnoses 140.0 through 149.9 and 160.0 through 162.0 were identified. All such patients who underwent resection by the three head-and-neck oncology faculty members at our institution were included in the database. Patients under 18 years of age were excluded, as were patients who did not have malignancy or who had a nonaerodigestive tract malignancy (i.e., thyroid, salivary gland, skin). Patients with prior surgical resection of an aerodigestive tract tumor, patients with nodal dissection only and unknown primary, and patients with incomplete medical records also were excluded.
For all included patients, basic demographic and risk factor information were recorded, including history of prior radiation, tracheostomy use, alcohol abuse (2 or more drinks per day), and lifetime tobacco use. Insurance status at the time of surgery was recorded from the medical record. Patients aged 65 years and older all were considered Medicare, even if they had some component of private insurance.2 Medicare patients aged under 65 comprised their own group. Tumor and nodal stage were recorded, as was reconstruction type. Length of stay was defined as days from surgery to hospital discharge. Postoperative complications were organized into two groups: wound-related and non-wound–related complications. Wound-related complications included flap complications, fistula formation, donor site or primary site breakdown, bleeding, infection, hematoma, chyle leak, and cerebrospinal fluid leak. Non-wound–related complications included pneumonia, cardiac events, electrolyte disturbance requiring intervention, anemia requiring transfusion, altered mental status or other neurological complications, pulmonary embolism, sepsis, renal complications, gastrointestinal disturbances, and urinary tract infection. Hospital readmission within 90 days of discharge for an issue related to resection was included. Finally, date of death or date of last follow-up was queried from the institution's prospective cancer registry.
Analysis was performed with SPSS 23.0 (IBM, Armonk, New York) and SAS 9.4 (SAS Institute, Inc., Cary, NC). Descriptive statistics were generated for all variables and stratified by the independent variable of interest, insurance status. Each demographic, perioperative, and postoperative variable was analyzed across the different insurance status groups, using analysis of variance (ANOVA) for continuous variables and Fisher's exact test for categorical variables. Cox proportional hazards models were analyzed for all single variables with a theoretical potential effect on survival. Then, a multivariate Cox proportional hazards model was constructed including these individual variables. Finally, a Kaplan-Meier survival curve was plotted and stratified by insurance status, both before and after controlling for variables identified in Cox proportional hazards modeling. Regression analyses were undertaken to identify the specific contribution of insurance status to several variables identified as being different across insurance groups and related to survival. For each of these, all theoretical predictors were tested for association with ANOVA or Fisher's exact test. All variables with P value less than or equal to 0.2 were included in regression analyses for these outcome variables. Binary regression models were constructed for categorical outcomes. A linear regression model was created for the one continuous outcome: length of stay.
Results
The final cohort consisted of 860 patients. There were 66 patients uninsured and 74 patients with Medicaid at time of surgery. Many demographic and outcome variables were different among the four insurance status groups in bivariate testing (Tables (I and II)). Specifically, the Medicaid and uninsured group had a much higher proportion of advanced stage tumors (Fig. 1).
Table I.
Description of the Study Population According to Insurance Status.
| Number of Patients (%) | |||||
|---|---|---|---|---|---|
|
|
|||||
| Medicaid/Uninsured (n = 140) | Medicare, < 65 years (n = 172) | Medicare, ≥ 65 years (n = 353) | Private (n = 195) | P Value | |
| Age, years, mean (std dev) | 52.3 (7.5) | 56.0 (7.1) | 73.8 (6.5) | 50.7 (9.1) | < .001 |
| Male gender (n = 618) | 115 (82.1) | 128 (74.4) | 240 (68.0) | 135 (69.2) | 0.011 |
| Race | |||||
| White (n = 743) | 100 (71.4) | 145 (84.3) | 322 (91.2) | 176 (90.3) | < .001 |
| Black/African American (n = 88) | 31 (22.1) | 25 (14.5) | 22 (6.2) | 10 (5.1) | |
| Other (n = 29) | 9 (6.4) | 2 (1.2) | 9 (2.5) | 9 (4.6) | |
| Positive tobacco history (n = 676) | 131 (93.6) | 148 (86.0) | 265 (75.1) | 132 (67.7) | < .001 |
| Heavy alcohol use (n = 197) | 69 (49.3) | 51 (29.7) | 48 (13.6) | 29 (14.9) | < .001 |
| ASA Score | |||||
| ASA 1 or 2 (n = 161) | 32 (22.9) | 20 (11.6) | 37 (10.5) | 72 (36.9) | < .001 |
| ASA 3 (n = 612) | 92 (65.7) | 134 (77.9) | 273 (77.3) | 113 (57.9) | |
| ASA 4 (n = 87) | 16 (11.4) | 18 (10.5) | 43 (12.2) | 10 (5.1) | |
| Tumor stage | |||||
| T1 (n = 224) | 23 (16.4) | 33 (19.2) | 97 (27.5) | 71 (36.4) | < .001 |
| T2 (n = 220) | 32 (22.9) | 45 (26.2) | 88 (24.9) | 55 (28.2) | |
| T3 (n = 145) | 29 (20.7) | 37 (21.5) | 55 (15.6) | 24 (12.3) | |
| T4 (n = 271) | 56 (40.0) | 57 (33.1) | 113 (32.0) | 45 (23.1) | |
| Node positive (N+) (n = 307) | 78 (55.7) | 64 (37.2) | 97 (27.5) | 68 (34.9) | < .001 |
| Pedicle or free flap reconstruction (n = 425) | 74 (52.9) | 86 (50.0) | 177 (50.1) | 89 (45.6) | 0.605 |
Categorical variables analyzed with Fisher's exact test and continuous variables with ANOVA.
ANOVA = analysis of variance; ASA = American Society of Anesthesiologists; std dev = standard deviation.
Table II.
Selected Outcomes According to Insurance Status.
| Number of Patients (%) | |||||
|---|---|---|---|---|---|
|
|
|||||
| Medicaid/Uninsured (n = 140) | Medicare, < 65 years (n = 172) | Medicare, ≥ 65 years (n = 353) | Private (n = 195) | P Value | |
| Length of stay, days, mean (std dev) | 10.7 (6.9) | 9.1 (5.9) | 10.0 (11.0) | 7.9 (7.2) | < .001 |
| Any complication (n = 480) | 96 (68.6) | 107 (62.2) | 191 (54.1) | 86 (44.1) | < .001 |
| Wound-related complication (n = 309) | 62 (44.3) | 71 (41.3) | 114 (32.3) | 62 (31.8) | 0.021 |
| Non-wound–related complication (n = 336) | 68 (48.6) | 68 (39.5) | 143 (40.5) | 57 (29.2) | 0.004 |
| Hospital readmission (n = 128) | 24 (17.1) | 26 (15.1) | 57 (16.1) | 21 (10.8) | 0.305 |
Categorical variables analyzed with Fisher's exact test and continuous variables with ANOVA.
ANOVA = analysis of variance; std dev = standard deviation.
Fig. 1.
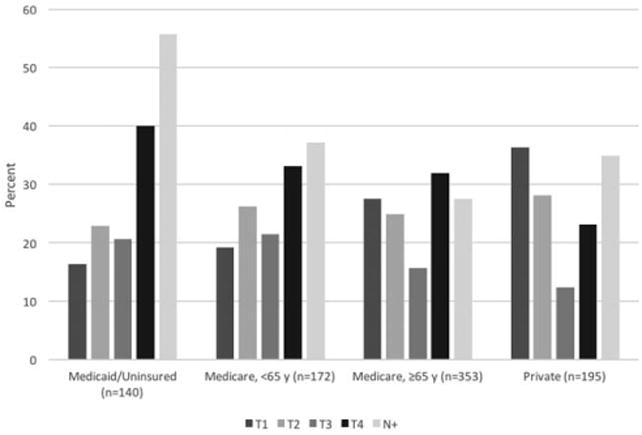
Tumor and nodal stage by insurance status group. T1 = tumor stage 1; T2 = tumor stage 2; T3 = tumor stage 3; T4 = tumor stage 4; and N+ = node positive tumor
Univariate survival analysis demonstrated a significant effect on survival for insurance status, and also for age, alcohol history, prior tracheostomy, prior radiation, advanced American Society of Anesthesiologists (ASA) score, tumor stage, nodal stage, reconstruction type, and complications. Multivariate survival analysis demonstrated that even when accounting for the effects of these other variables, insurance status still is significantly correlated with survival (P = 0.002) (Table III). In pairwise comparison, the Medicaid/uninsured group demonstrated a hazard ratio (HR) of 1.4 (95% confidence interval [CI], 1.0–2.1; P = 0.063) when compared to the private insurance group (Table III). The adjusted survival curve can be seen in Figure 2.
Table III.
Unadjusted and Adjusted Survival Modeling.
| Unadjusted Hazard Ratio (95% CI) | Adjusted Hazard Ratio (95% CI) | |
|---|---|---|
| Age (for 10-year increase) | 1.3 (1.2, 1.4) | 1.4 (1.2, 1.7) |
| Insurance status | ||
| Medicaid or uninsured | 2.1 (1.5, 3.0) | 1.4 (1.0, 2.1) |
| Medicare < 65 | 1.2 (0.8, 1.6) | 0.7 (0.5, 1.1) |
| Medicare 65+ | 1.9 (1.5, 2.6) | 0.7 (0.5, 1.1) |
| Male gender | 1.1 (0.9, 1.4) | 1 (0.7, 1.2) |
| Race | ||
| Black/African American | 0.9 (0.6, 1.2) | 0.7 (0.5, 1.0) |
| Other | 1.1 (0.7, 2.0) | 1.4 (0.8, 2.4) |
| History of tobacco use | 1.3 (1.0, 1.6) | 1 (0.7, 1.3) |
| Heavy alcohol use | 1.4 (1.1, 1.7) | 1.4 (1.1, 1.8) |
| History of radiation | 1.8 (1.4, 2.2) | 1.2 (0.9, 1.5) |
| ASA score | ||
| ASA 3 | 2.1 (1.5, 2.8) | 1.4 (1.0, 1.9) |
| ASA 4 | 3.4 (2.3, 5.2) | 2.1 (1.4, 3.2) |
| Tumor stage | ||
| T2 | 2.0 (1.5, 2.8) | 1.7 (1.2, 2.4) |
| T3 | 2.7 (1.9, 3.8) | 2.1 (1.5, 3.0) |
| T4 | 2.8 (2.1, 3.8) | 1.9 (1.4, 2.7) |
| Node positive (N+) | 1.3 (1.1, 1.7) | 1.3 (1.0, 1.6) |
| Pedicle or free flap | 1.8 (1.5, 2.2) | 1.3 (1.0, 1.6) |
| Any complication | 1.7 (1.4, 2.1) | 1.2 (0.9, 1.5) |
Hazard ratios determined with Cox regression modeling.
Private insurance is the reference category for insurance status; white is the reference category for race; ASA score 1 or 2 is the reference category for ASA score; and T1 is the reference category for tumor stage.
ASA = American Society of Anesthesiologists; CI = confidence interval; T = tumor.
Fig. 2.
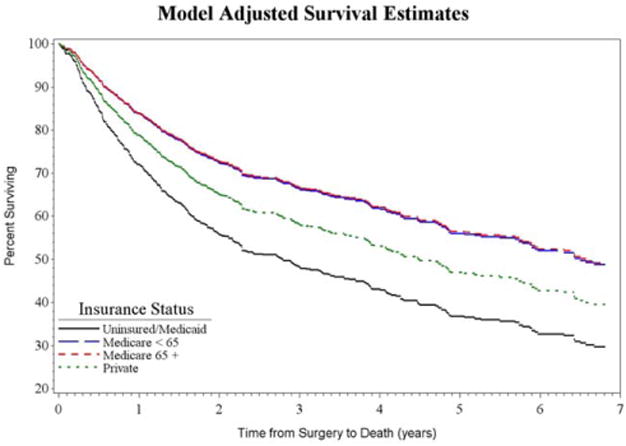
Kaplan-Meier survival curve by insurance status, adjusted for age, gender, race, tobacco and alcohol history, prior radiation, American Society of Anesthesiologists score, tumor and nodal stage, reconstruction type, and postoperative complications. Survival differences between insurance status groups are significant (P = 0.0015). [Color figure can be viewed in the online issue, which is available at www.laryngoscope.com.]
The subsequent regression analyses reveal the specific connection between insurance status and comorbidity burden (estimated by ASA score), length of stay, and complications. Each of these variables was significantly different across insurance status groups.
For ASA score, the final regression model included age, tobacco use, tumor stage, race, and insurance status. After accounting for the effects of these other variables, insurance status was a significant predictor (P = 0.005) with Medicare < 65 years old and Medicare ≥ 65 years old each having significant predictive power over ASA score (Fig. 3).
Fig. 3.
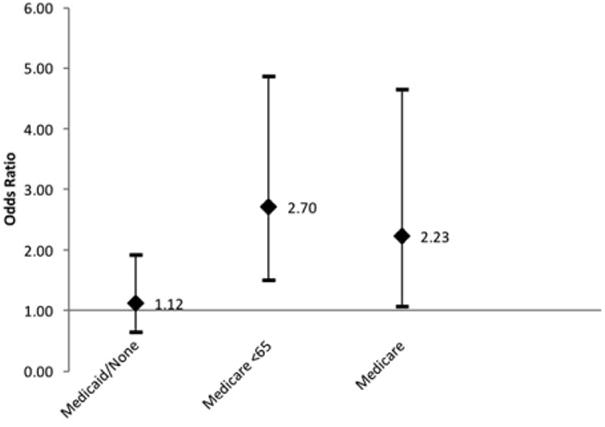
Adjusted odds ratios with 95% confidence intervals for the outcome of American Society of Anesthesiologists score for insurance status groups, compared to private insurance reference group.
For length of stay, the final model included race, tobacco, prior tracheostomy, reconstruction type, tumor stage, and insurance status. After accounting for the effects of these other variables, insurance status was not a significant predictor of length of stay (P = 0.081) (Fig. 4).
Fig. 4.
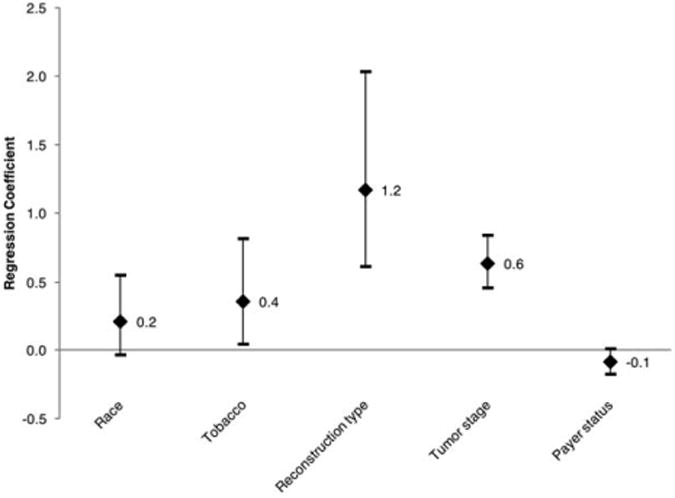
Adjusted regression coefficients with 95% confidence intervals for variables contributing to the outcome length of stay. In this analysis, race is nonwhite versus white; reconstruction type is pedicle or free flap versus other reconstruction types; tumor stage includes T2 through T4, with T1 as a reference; and payer status is Medicaid/uninsured versus other insurance types.
For all complications, the final model included gender, race, ASA score, reconstruction type, tumor stage, and insurance status. After accounting for the effects of these other variables, insurance status was a significant predictor of complications (P = 0.029). Inclusion in the Medicaid/uninsured group was especially predictive of complications (odds ratio [OR], 2.10; 95% CI, 1.24–3.56; P = 0.006) (Fig. 5). Insurance status was not a significant predictor of either subgroup of complications: wound-related and nonwound–related.
Fig. 5.
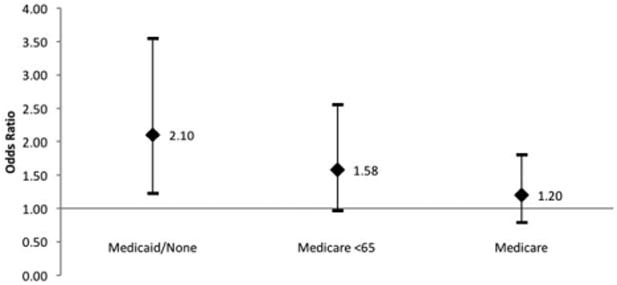
Odds ratios with 95% confidence intervals for association of insurance status groups and the outcome postoperative complications, compared to private insurance reference group.
Discussion
These data show that insurance status is associated with survival before and after controlling for other variables (P < 0.0001 and P = 0.0015, respectively). There is specifically a survival disadvantage for Medicaid or uninsured patients compared to privately insured patients (52.1% vs. 30.3% all-cause mortality, respectively; HR, 2.1; 95% CI, 1.5–3.0). After adjusting for other variables, the survival difference is decreased (HR, 1.4; 95% CI, 1.0–2.1). Interestingly, the patients in the Medicare, < 65 years old group had roughly equivalent survival to the private insurance group before controlling for other variables (HR, 1.2; 95% CI, 0.8–1.6) and slightly better survival after controlling for those variables (HR, 0.7; 95% CI, 0.5–1.1). Other factors that influenced survival in the multivariate model include age, heavy alcohol use, prior radiation, ASA 4 score, advanced tumor stage, and node-positive cancers.
Studies have shown connections between insurance status and adverse outcomes for cancer patients. Late presentation has been studied extensively in relation to socioeconomic status, race, and insurance status. Disparities in early tumor detection are especially prominent for cancers that can be identified in routine screening, including colorectal, breast, skin, and thyroid.3–5 Although no standardized screening programs exist for oral, pharyngeal, and laryngeal cancer, patients who seek regular oral healthcare benefit from early detection of some tumors. Patients without medical or dental insurance are less likely to receive oral health exams, potentially contributing to late presentation.6 Directed screening programs for oral cavity and oropharynx cancer have shown mixed results. The United States Preventive Services Task Force does not recommend screening, but the American Head and Neck Society supports targeted screening of high-risk populations and education-based campaigns.7,8 Regardless, the trend toward late presentation for patients with low socioeconomic status has been extensively demonstrated.2,9,10 Moreover, stage at presentation is a key predictor of survival for head and neck cancer patients.11,12
Other facets of treatment are less clear for head and neck cancer patients with low socioeconomic status. Evidence shows that these patients have longer delay to initiation of treatment, regardless of tumor size, negatively influencing survival.13 In addition, uninsured and Medicaid patients may have worse surgical outcomes after resection of their head and neck cancers, leading to longer length of stay in the hospital. Poor treatment compliance, cultural and social barriers, and inadequate health education may explain some of this disparity.14,15 Adverse surgical outcomes also may exist for Black or African American patients, likely due to similar socioeconomic healthcare barriers.16–18
In addition to serving as a proxy for socioeconomic status, insurance type may have a direct influence on disease course by dictating access to healthcare providers, rehabilitation services, medications, and medical equipment. Medical insurance in the United States is both complex and dynamic, and this study has used four categories for analytical convenience. No single group is homogeneous, and extent of coverage is variable in each group. Patients may change insurance during treatment. Although this study does not capture all these complexities and dynamic changes, the snapshot of insurance status at time of surgery provides information about socioeconomics and access to healthcare and correlates strongly with outcomes.2–4,9,10,14 This study was performed in North Carolina and overlapped with implementation of the Affordable Care Act, but the state elected not to expand Medicaid, simplifying the data.
Kwok et al. performed a robust analysis of survival in head and neck cancer patients by studying 1,231 patients from a single institution from 1998 to 2007, stratified by insurance status.2 They showed a survival disadvantage for patients uninsured or with Medicaid and for patients aged under 65 years with Medicare, even after adjusting for age, gender, race, socioeconomic status, alcohol and tobacco use, stage at diagnosis, and treatment strategy. They also demonstrated that Medic-aid/uninsured patients were more likely to present with advanced stage tumors and with at least one positive lymph node.2
Our data confirm the survival disadvantage for Medicaid and uninsured patient demonstrated previously by Kwok et al.2 However, in our patient population, both Medicare populations showed an improved survival trend compared to the private insurance group. This difference may be due to our analysis controlling for more variables, including comorbidity burden (estimated by ASA score),19 reconstruction type, and postoperative complications. In addition, our cohort includes surgical patients only, whereas the Kwok et al. cohort includes patients treated nonsurgically.
We further examined tumor stage, ASA score, length of stay, and complications to determine when disparities exist for the Medicaid/uninsured group. In the Medicaid/uninsured group, 60.7% of patients had a T3 or T4 tumor, whereas 35.4% of the private insurance group had such an advanced tumor. American Society of Anesthesiologists score appears to be influenced by insurance status (P = 0.005). However, in pairwise comparisons with the private insurance group, the Medicaid/uninsured group is not more likely to have an advanced ASA score (OR = 1.12, 95% CI = 0.07–1.93), whereas both Medicare groups predict an advanced ASA score. Medicaid/uninsured patients are more likely to have positive alcohol and tobacco history (Table I).
Insurance status was not an independent predictor of length of stay, despite an absolute difference between the Medicaid/uninsured and private insurance groups. This contradicted the idea that underinsured patients may spend extra days in the hospital due to difficulties arranging health services upon discharge. The observed difference in length of stay was accounted for by differences in tumor stage and reconstruction type.
Even after accounting for the effects of other variables, payer status was predictive of complications after surgery. In pairwise comparisons, the Medicaid/uninsured group stands out as having the highest odds of complication when compared to the reference group, even when controlling for potential confounders (OR, 2.10; 95% CI, 1.24–3.56). There was no significant difference in readmission rate between insurance status groups.
Several modifiable characteristics of the Medicaid/uninsured group stand out when examining these outcomes. First, this group has much higher rates of tobacco use and heavy alcohol use, and the latter was shown by the multivariate survival model to influence survival. Tumor and nodal stage were more advanced in this group and have a large influence on survival. Complications were higher in the Medicaid/uninsured group, but they did not affect survival. Given these conclusions, alcohol abuse and tumor/nodal stage at presentation are the features specific to the Medicaid/uninsured group that also contribute to poor survival. Additionally, the insurance status may directly influence the disease course by determining access to healthcare services. Intervention efforts targeted at these factors may be especially effective in these populations and close the mortality gap demonstrated by this study and Kwok et al.2 Relevant interventions may include alcohol abuse counseling and treatment prior to surgery or in the recovery period. In addition, early detection and initiation of treatment for all populations should be a major goal of head-and-neck cancer public health efforts.
Identification of high-risk populations has implications beyond intervention. Because healthcare reimbursement and institutional assessments are becoming more dependent on outcomes, characteristics that increase the probability of an adverse outcomes are also more important. “Safety-net” hospitals care for a higher proportion of uninsured and Medicaid patients, and this study suggests that those hospitals may face unique challenges to meeting outcome goals for head and neck cancer patients. Still, this single-institution data cannot be extrapolated to all populations or institutions.
This study has several limitations. As discussed above, insurance status has been simplified to four categories, including the combination of the uninsured and Medicaid groups. These groups do have distinct characteristics, and patients who enroll in Medicaid after diagnosis are different from those with Medicaid coverage prior to diagnosis.20 We still know that many uninsured patients enroll in Medicaid during treatment or after diagnosis. This study is limited by not capturing those changes, but the combined group is useful as a simple proxy for socioeconomic status and access to healthcare services. Additionally, the dramatic increase in human papillomavirus (HPV)-associated head and neck cancer resulted in a distinct subgroup that is younger, healthier, and has improved survival.21 Human papillomavirus status could not be retrospectively gathered for these patients; thus, the confounding effect of HPV on the data cannot be assessed. This study is limited by its retrospective nature and by the single institution population. Limitations also include loss to follow-up or missing mortality data not captured by our institution's cancer registry database.
Future studies should further explore modifiable predictors of survival in head and neck cancer, especially as they relate to disadvantaged populations. Specifically, future studies should elucidate if the effects of alcohol abuse are lifelong or if they specifically impact the recovery period. Evidence of efficacy of early detection programs or efficacy of alcohol treatment programs would further substantiate the findings of this study and provide practice models for healthcare providers and public health professionals.
Conclusion
Insurance status is an individual predictor of survival following head and neck cancer surgery, and patients who have Medicaid or are uninsured have worse survival when compared to patients with private insurance. The Medicaid/uninsured patients are more likely to use tobacco and abuse alcohol and are more likely to present with advanced stage tumors and lymph node involvement. Although these patients are at increased risk for postoperative complications, complications do not seem to influence survival. The Medicaid/uninsured group's modifiable characteristics that also contribute to mortality include alcohol abuse and advanced tumor/nodal stage at presentation. Based on this data, efforts to improve survival for these patients may be most helpful if directed at these factors.
Acknowledgments
This study was supported by the Wake Forest Baptist Comprehensive Cancer Center's NCI Cancer Center support grant P30CA012197.
Footnotes
The authors have no other funding, financial relationships, or conflicts of interest to disclose.
Presented as poster presentation at Triological Society Combined Sections Meeting, New Orleans, Louisiana, U.S.A., January 19–21, 2017.
Contributor Information
Matthew L. Rohlfing, Department of Otolaryngology, Boston Medical Center, Boston, Massachusetts.
Ashley C. Mays, Department of Otolaryngology, MD Anderson Cancer Center, Houston, Texas.
Scott Isom, Department of Biostatistical Sciences, Comprehensive Cancer Center Winston-Salem, North Carolina, USA.
Joshua D. Waltonen, Department of Otolaryngology, Wake Forest Baptist Health, Winston-Salem, North Carolina, USA.
Bibliography
- 1.Ward BW, Clarke TC, Nugent CN, Schiller JS. Early release of selected estimates based on data from the 2015 National Health Interview Survey. Atlanta, GA: Centers for Disease Control and Prevention, U.S. Department of Health and Human Services; 2016. [Google Scholar]
- 2.Kwok J, Langevin SM, Argiris A, Grandis JR, Gooding WE, Taioli E. The impact of health insurance status on the survival of patients with head and neck cancer. Cancer. 2010;116:476–485. doi: 10.1002/cncr.24774. [DOI] [PMC free article] [PubMed] [Google Scholar]
- 3.Halpern MT, Ward EM, Pavluck AL, Schrag NM, Bian J, Chen AY. Association of insurance status and ethnicity with cancer stage at diagnosis for 12 cancer sites: a retrospective analysis. Lancet Oncol. 2008;9:222–231. doi: 10.1016/S1470-2045(08)70032-9. [DOI] [PubMed] [Google Scholar]
- 4.Roetzheim RG, Pal N, Tennant C, et al. Effects of health insurance and race on early detection of cancer. J Natl Cancer Inst. 1999;91:1409–1415. doi: 10.1093/jnci/91.16.1409. [DOI] [PubMed] [Google Scholar]
- 5.Bradley CJ, Given CW, Roberts C. Race, socioeconomic status, and breast cancer treatment and survival. J Natl Cancer Inst. 2002;94:490–496. doi: 10.1093/jnci/94.7.490. [DOI] [PubMed] [Google Scholar]
- 6.Bloom B, Gift HC, Jack SS. Dental services and oral health. Vital Health Stat. 1992;183:1–95. [PubMed] [Google Scholar]
- 7.United States Preventive Services Task Force. Final Recommendation Statement, Oral Cancer: Screening. Rockville, MD: 2013. [Accessed March 11, 2017]. Available at: www.uspreventiveservicestaskforce.org/Page/Document/RecommendationStatementFinal/oral-cancer-screening1. [Google Scholar]
- 8.Chkheidze M. American Head and Neck Society. AHNS Response to USPSTF Oral Cancer Recommendation; Los Angeles CA: 2014. [Accessed March 11, 2017]. Available at: www.ahns.info/ahns-recommendation. [Google Scholar]
- 9.Chen AY, Schrag NM, Halpern M, Ward EM. The impact of health insurance status on stage at diagnosis of oropharyngeal cancer. Cancer. 2007;110:395–402. doi: 10.1002/cncr.22788. [DOI] [PubMed] [Google Scholar]
- 10.Chen AY, Schrag NM, Halpern M, Stewart A, Ward EM. Health insurance and stage at diagnosis of laryngeal cancer. Arch Otolaryngol Head Neck Surg. 2007;133:184–790. doi: 10.1001/archotol.133.8.784. [DOI] [PubMed] [Google Scholar]
- 11.Patel UA, Brennan TE. Disparities in head and neck cancer: assessing delay in treatment initiation. Laryngoscope. 2012;122:1756–1760. doi: 10.1002/lary.23357. [DOI] [PubMed] [Google Scholar]
- 12.Leon X, de Vega M, Orus C, Moran J, Verges J, Quer M. The effect of waiting time on local control and survival in head and neck carcinoma patients treated with radiotherapy. Radiother Oncol. 2003;66:277–281. doi: 10.1016/s0167-8140(03)00022-7. [DOI] [PubMed] [Google Scholar]
- 13.Munck K, Ali MJ, Murr AH, Goldberg AN. Impact of socioeconomic status on the diagnosis to treatment interval (DTI) in Waldeyer's ring carcinoma. Laryngoscope. 2005;115:1283–1287. doi: 10.1097/01.MLG.0000165382.83891.92. [DOI] [PubMed] [Google Scholar]
- 14.Weyh AM, Lunday L, McClure S. Insurance status, an important predictor of oral cancer surgery outcomes. J Oral Maxillofac Surg. 2015;73:2049–2056. doi: 10.1016/j.joms.2015.04.028. [DOI] [PubMed] [Google Scholar]
- 15.Locher JL, Robinson CO, Bailey FA, et al. The contribution of social factors to undereating in older adults with cancer. J Support Oncol. 2009;7:168–173. [PMC free article] [PubMed] [Google Scholar]
- 16.Jemal A, Siegel R, Ward E, et al. Cancer statistics, 2008. CA Cancer J Clin. 2008;58:71–96. doi: 10.3322/CA.2007.0010. [DOI] [PubMed] [Google Scholar]
- 17.Radowsky JS, Helou LB, Howard RS, Solomon NP, Stojadinovic A. Racial disparities in voice outcomes after thyroid and parathyroid surgery. Surgery. 2013;153:103–110. doi: 10.1016/j.surg.2012.06.001. [DOI] [PubMed] [Google Scholar]
- 18.Sukumar S, Ravi P, Gervais MK, et al. Racial disparities in operative outcomes after major cancer surgery in the United States. World J Surg. 2015;39:624–642. doi: 10.1007/s00268-014-2863-x. [DOI] [PubMed] [Google Scholar]
- 19.Sankar A, Johnson SR, Beattie WS, Tait G, Wijeysundera DN. Reliability of the American Society of Anesthesiologists physical status scale in clinical practice. Br J Anaesth. 2014;113:424–432. doi: 10.1093/bja/aeu100. [DOI] [PMC free article] [PubMed] [Google Scholar]
- 20.Bradley CJ, Given CW, Roberts C. Late stage cancers in the Medicaid-insured population. Med Care. 2003;41:722–728. doi: 10.1097/01.MLR.0000065126.73750.D1. [DOI] [PubMed] [Google Scholar]
- 21.Deschler DG, Richmon JD, Khariwala SS, Ferris RL, Wang MB. The “New” head and neck cancer patient—young, nonsmoker, nondrinker, and HPV positive. Otolaryngol Head Neck Surg. 2014;151:375–380. doi: 10.1177/0194599814538605. [DOI] [PMC free article] [PubMed] [Google Scholar]


