

Abstract
Background
The number of patients in need of second-line antiretroviral drugs is increasing in sub-Saharan Africa. We aimed to project the need of second-line antiretroviral therapy (ART) in adults in sub-Saharan Africa up to 2030.
Methods
We developed a simulation model for HIV and applied it to each sub-Saharan African country. We fitted the number of adult patients on ART to observed estimates, and predicted first-and second-line needs between 2015 and 2030. We present results for sub-Saharan Africa, and 8 selected countries. We present 18 scenarios, combining the availability of viral load monitoring (VLm), speed of ART scale-up, and rates of retention and switching to second-line. HIV transmission was not considered.
Findings
Depending on the scenario, 8·7–25·6 million people are expected to receive ART in 2020, of whom 0·5–3·0 million (2·9%–15·6%) will be receiving second-line ART. The percentage was highest (15·6%) in the scenario with perfect retention and immediate switching, no further scale-up, and universal routine VLm. In 2030, the range of patients on ART remained constant, but the number (proportion) of patients on second-line ART increased to 0·8–4·6 million (6·6%–19·6%). The need of second-line ART was 2–3 times higher if routine VLm was implemented throughout the region, compared with a scenario of no further VLm scale-up. For each monitoring strategy the future proportion of patients on second-line ART differed only minimally between countries.
Interpretation
The demand for second-line ART will increase substantially in the future as countries increase access to routine VLm.
Funding
World Health Organization
Introduction
Access to antiretroviral therapy (ART) has improved considerably over the past decade. Prior to 2003 ART was generally available only in high-income countries, but by 2014 the majority of the 15 million people receiving ART worldwide were living in sub-Saharan Africa (SSA).1 ART in resource-limited countries is provided using simplified and standardised protocols.2 In most SSA settings, only a limited number of first- and second-line drugs are available. Second-line ART, which should be provided in the case of first-line failure, is currently around 2·5 times more expensive than the World Health Organization (WHO) recommended first-line ART.3
The global cohort of people on ART is maturing, with around half of the people on ART having started treatment before 2010. As the number of people and average time on ART increase, so does the number of people failing first-line therapy. However, access to viral load monitoring (VLm) in SSA, and the ability to detect treatment failure accurately, is limited. Most SSA countries still use clinical and CD4 monitoring to determine failure and decide about switching to second-line ART.4 These indicators correlate poorly with virological failure,5 resulting in long delays between failure and switching.4
In 2013 WHO recommended VLm as the preferred way to monitor ART, and there is a concerted international effort to support VLm scale-up. As VLm becomes more widely available, demand for second-line ART increases.4 Poor preparation for this need could result in drug shortages, causing a large number of patients to remain on suboptimal therapy. To support donors and national programmes to prepare for the growing need for second-line, we developed a mathematical model to predict the need of second-line ART between 2015 and 2030 in HIV infected adult patients in SSA under various scenarios of ART and VLm access.
Methods
Data sources and definitions
We used the WHO country intelligence database to estimate the number of adult patients on ART until 2014. This database contains the numbers of adults and children receiving different ART regimens across the majority of middle- and low-income countries for 2005, 2006 and 2008–2014, as reported by national HIV programmes. Estimates of people living with HIV in SSA countries were extracted from the UNAIDS database1 (aidsinfoonline.org) and scenarios of VLm availability were informed by Médecins Sans Frontières estimates of VLm access.6
First- and second-line regimens were defined according to 2013 WHO guidelines, with first-line comprising two nucleoside (NRTI) and one non-nucleoside reverse transcriptase inhibitor (NNRTI),2 and second-line replacing the NNRTI with a protease inhibitor (PI) and at least one NRTI. Currently, the preferred first-line regimen consists of Tenofovir (TDF), lamivudine (3TC)/emtricitabine (FTC) and efavirenz (EFV), and the second-line of zidovudine (AZT), 3TC and ritonavir-boosted lopinavir (LPV/r) or ritonavir-boosted atazanavir (ATV/r).2 We did not include third-line ART explicitly: according to our database, most countries had no patients on third-line ART, and the future development and recommendations are still unclear. The estimated number of patients on second-line ART therefore also includes those that should be on subsequent regimens. Two scenarios of determining treatment failure were assessed: routine VLm (failure defined as two consecutive viral load values >1000 copies/ml within a year), and targeted VLm (failure defined by a CD4 or clinical failure confirmed by a single viral load test).
We used parameter estimates from earlier models, mainly based on routine ART programmes from South Africa, Malawi and Zambia, to estimate the progress of the HIV infection on ART.7–11
Mathematical modelling framework
We developed a mathematical modelling framework for projecting the need of first- and second-line ART in adults up to 2030. The framework consists of a simulation model written in R, and an Excel-based user interface for processing and displaying the model results. The model simulates patients independently of each other, and does not consider HIV transmission or the development of the epidemic.
Simulation model
Our stochastic individual-based model was developed using the R package ‘gems’ (https://cran.r-project.org/package=gems).12 The structure is similar to models we have developed before,10,11,13 and a detailed description is given in the Supplementary Appendix, Text S1. We simulated cohorts of 10,000 adults (>15 years) who progress from ART initiation through a sequence of health states that combine the patient’s virological, immunological, clinical and retention status and the type of treatment regimen (first- or second-line) (Supplementary Appendix, Text S1, Table S1.1). Transition times between states are sampled from time-to-event distributions. The corresponding hazard functions do not necessarily need to be constant, but the parameters cannot change over time. The parameters for disease progression have been estimated for previous studies and are mainly based on observational data from southern African routine ART programmes (Supplementary Appendix, Table S1.2). For switching treatment and retention in care, we included several alternative scenarios (Supplementary Appendix, Text S1).
The outputs of the model are stored in an Excel table (Supplementary Appendix, Excel file S11), which includes a user interface for retrieving the results of the model for a customised setting.
Projections for sub-Saharan Africa
We calculated the need for second-line ART for each country separately (Supplementary Appendix,Text S2). We included countries that belong to the UNAIDS West and Central African or East and Southern African regions. Countries without available data on ART were excluded. We estimated the number of adults starting ART each year so that the total number of patients on first- and second-line ART until 2014 would match the observed data. The current monitoring strategy was chosen based on the monitoring practices in the country, and the observed proportion of patients on second-line ART. The monitoring strategy can be changed once (in 2015). If the model substantially underestimated the need of second-line in recent years, we changed the strategy already before 2015 (by introducing routine or targeted VLm we accelerated the switching to second-line ART).
We modelled for each country 12 future scenarios, combining the scale-up of ART initiation (rapid, stable, or no scale-up), retention and switching (‘perfect’ or realistic), and the monitoring strategy (routine VLm, or CD4 monitoring with targeted VLm). In the “rapid scale-up” scenario, we defined the number of patients starting ART each year from 2015 so that the entire HIV infected population (based on the 2014 estimate) was treated by 2020. After this, we kept the number of patients on ART stable. In the “stable scale-up” scenario, we kept the number of patients starting ART each year at the same level as between 2010 and 2014. In the “no scale-up” scenario, after 2015 only as many patients started ART annually as died or stopped treatment, keeping the number of patients on ART remained stable. In the perfect retention and switching scenario, all patients received ART until death, and switched to second-line immediately after failure was confirmed. In the realistic scenario, we used the same rates of stopping ART, returning to care and switching as before the strategy change.
We present 18 scenarios for the pooled results (Table 1). These scenarios combine the retention/switching and ART initiation scenarios presented above, and three scenarios of future VLm: (i) all countries will implement routine VLm; (ii) all countries will implement routine VLm, except those that explicitly do not recommend it; and (iii) only the countries that already provide routine VLm implement it.
Table 1. Description of the modelled scenarios.
We simulated 18 scenarios, which combine the three scenarios of future scale-up of antiretroviral therapy (ART), two scenarios of retention and switching, and three scenarios of viral load monitoring.
| Strategy | Description |
|---|---|
| Future scale-up of ART | The number of patients starting ART each year is: |
| Rapid | - Increased so that the entire population (assuming perfect retention) will be treated by 2020, and after this, kept on a level that maintains the number of treated patients stable |
| Stable | - Kept on the same level as before 2014 until 2030 (unless universal coverage is reached before that) |
| No | - Kept on a level that maintains the number of patients receiving ART (assuming perfect retention) on the level of 2014 |
| Retention and switching | Treatment interruptions and delay in switching are: |
| Perfect | - Excluded (all patients are retained in care until death, and switch immediately after confirmed treatment failure) |
| Realistic | - Included (with the same rates as before 2015) |
| Viral load monitoring | Routine viral load monitoring is implemented in: |
| Routine universally | - All countries |
| Routine unless not recommended | - All countries except those that explicitly do not recommend it (in these countries, targeted viral load monitoring is applied) |
| Targeted unless routine already implemented | - Only in the countries that have already started implementing it (in other countries, targeted viral load monitoring is applied) |
We also present detailed results for eight countries (Botswana, Côte d’lvoire, Ghana, Mozambique, South Africa, Swaziland, Zambia, and Zimbabwe).
Results
Country review and selection
The UNAIDS West and Central African region consists of 25 countries, and the East and Southern African region of 21 countries. We excluded South Sudan which joined the West and Central African region only after its independence in 2011. We also excluded four countries for which no data were available: Comoros, Equatorial Guinea, São Tomé and Prìncipe, and the Seychelles. Forty-one countries were included in the analysis (Table 2).
Table 2.
List of included countries.
| Number of PLHIV (2014) | Number of people on ART (2014) | Viral load monitoring recommendation | Viral load monitoring availability | |
|---|---|---|---|---|
| Angola | 304,433 | 19,092 (2009) | Routine | Limited |
| Benin | 77,911 | 27,241 | Routine | n/a |
| Botswana | 392,427 | 205,612 | Routine | Widely |
| Burkina Faso | 107,660 | 44,410 | Routine | Limited |
| Burundi | 84,656 | 35,663 | Routine | Limited |
| Cameroon | 657,457 | 138,948 | Routine | Limited |
| Cape Verde | 3,350 | 1,178 | Targeted | Limited |
| Central African Republic | 135,381 | 15,268 | n/a | n/a |
| Chad | 214,999 | 41,658 (2013) | Targeted | Limited |
| Comoros | 7900 (2012)* | n/a | Routine | Limited |
| Congo, Democratic Republic of | 446,624 | 102,442 | Targeted | Limited |
| Congo, Republic of | 80,666 | 26,334 | n/a | n/a |
| Côte d’Ivoire | 460,074 | 133,778 | Routine | Limited |
| Equatorial Guinea | 31,639 | n/q | Routine | |
| Eritrea | 16,121 | 7,610 | Targeted | Limited |
| Ethiopia | 730,317 | 339,043 | Routine | Limited |
| Gabon | 47,522 | 20,668 | Routine | Limited |
| Gambia | 20,297 | 4,018 | Not recommended | n/a |
| Ghana | 250,232 | 79,131 | Routine | n/a |
| Guinea | 117,959 | 33,067 | Targeted | Limited |
| Guinea-Bissau | 42,175 | 4,604 (2012) | Targeted | Limited |
| Kenya | 1,366,920 | 689,155 | Routine | Limited |
| Lesotho | 314,614 | 111,325 | Routine | Limited |
| Liberia | 33,097 | 5,032 (2012) | n/a | n/a |
| Madagascar | 39,108 | 715 | Routine | n/a |
| Malawi | 1,063,910 | 509,495 | Routine | Rolled out |
| Mali | 133,356 | 29,113 | Routine | Limited |
| Mauritania | 15,893 | 2,315 | n/a | n/a |
| Mauritius | 8,251 | 1,382 (2011) | Targeted | Limited |
| Mozambique | 1,543,010 | 585,544 | Targeted | Limited |
| Namibia | 263,518 | 125,138 | Routine | Limited |
| Niger | 51,789 | 11,286 | Routine | Limited |
| Nigeria | 3,391,550 | 563,694 | Routine | Limited |
| Rwanda | 210,534 | 135,265 | Routine | Limited |
| São Tomé and Principe | 1,005 | n/a | ||
| Senegal | 43,975 | 18,286 | Routine | Limited |
| Seychelles | <1000** | n/a | ||
| Sierra Leone | 54,023 | 10,289 | Routine | Limited |
| South Africa | 6,836,480 | 2,802,016 | Routine | Widely |
| Swaziland | 214,342 | 108,785 | Routine | Limited |
| Tanzania, United Republic of | 1,499,390 | 622,127 | Targeted *** | Limited |
| Togo | 113,707 | 35,277 | n/a | n/a |
| Uganda | 1,486,640 | 694,627 | Routine | Limited |
| Zambia | 1,150,370 | 636,226 | Routine | Limited |
| Zimbabwe | 1,550,250 | 753,292 | Targeted | Limited |
PLHIV, people living with HIV; ART, antiretroviral therapy; n/a, not available
Source for number of PLHIV is the UNAIDS database (estimates for 2014) unless otherwise mentioned. The number of people on ART was extracted from the WHO data.
Source: UNICEF (http://www.unicef.org/infobycountry)
Approximation, based on rough calculation
Tanzania states that routine viral load monitoring may be considered.
Only South Africa and Botswana have provided routine VLm since the start of ART scale-up. Malawi started recently to implement routine VLm. Côte d’Ivoire, Ethiopia and Tanzania do not currently recommend VLm, and the Democratic Republic of the Congo, Guinea, Mozambique, Swaziland and Zimbabwe recommend only targeted VLm. The majority of SSA countries recommend, in line with WHO recommendations, routine VLm, but availability is currently limited or unknown. (Table 2).
The baseline values (current and future monitoring, strategy year change, assumed number of people living with HIV) for each country are shown in Supplementary Appendix, Table S2.1. We chose CD4 monitoring as the initial strategy for most countries. Although the literature suggests that many settings have relied on clinical monitoring, we could not reproduce the observed numbers of patients on second-line ART by clinical monitoring alone in most countries. In 15 countries, the year of strategy change was chosen to be before 2015 since the number of patients on second-line would have remained too low otherwise.
Future need of first- and second-line ART in sub-Saharan Africa
The projected number of people receiving ART in SSA in 2014 ranged between 8·8 and 9·5 million, depending on the scenario. This is slightly lower than the UNAIDS estimate (10·6 million). The variation between scenarios before 2015 is caused by the changes in the monitoring strategy already prior to 2015.
In 2020, the total number of adult patients on ART was between 8·7 million and 25·6 million depending on the scenario (Table 3, Figure 1). The number was above 23 million in all scenarios of rapid scale-up. About 15–16 million adults were on ART in scenarios with stable scale-up, and about 9 million in scenarios with no scale-up. The number of adults on ART remained stable between 2020 and 2030 in the scenarios with rapid scale-up or no scale-up, and grew to about 20 million by 2030 with stable scale-up.
Table 3.
Predicted number of patients receiving first- and second-line antiretroviral therapy (ART) in sub-Saharan Africa in 2020 and 2030 in various scenarios.
| Scenario | 2020 | 2030 | ||
|---|---|---|---|---|
|
| ||||
| 1st-line, n (%) | 2nd-line, n (%) | 1st-line, n (%) | 2nd-line, n (%) | |
| Rapid scale-up of ART | ||||
| Universal rVLM | ||||
| Perfect retention and switching | 22,558,528 (88·3) | 2,991,946 (11·7) | 20,960,176 (82·1) | 4,578,452 (17·9) |
| Realistic retention and switching | 21,862,684 (91·5) | 2,035,843 (8·5) | 20,440,430 (84·4) | 3,786,531 (15·6) |
| rVLM unless specifically not recommended | ||||
| Perfect retention and switching | 23,120,559 (90·5) | 2,434,591 (9·5) | 21,556,023 (84·4) | 3,981,368 (15·6) |
| Realistic retention and switching | 22,231,962 (93·0) | 1,671,308 (7·0) | 20,927,242 (86·5) | 3,269,891 (13·5) |
| tVLM unless rVLM already implemented | ||||
| Perfect retention and switching | 24,019,757 (96·0) | 1,012,747 (4·0) | 22,534,319 (91·4) | 2,113,812 (8·6) |
| Realistic retention and switching | 22,815,509 (97·1) | 686,354 (2·9) | 21,715,958 (92·9) | 1,654,408 (7·1) |
| Stable scale-up of ART | ||||
| Universal rVLM | ||||
| Perfect retention and switching | 14,129,241 (87·1) | 2,084,699 (12·9) | 17,432,594 (82·8) | 3,620,045 (17·2) |
| Realistic retention and switching | 13,760,558 (89·9) | 1,545,045 (10·1) | 17,730,190 (85·3) | 3,046,361 (14·7) |
| rVLM unless specifically not recommended | ||||
| Perfect retention and switching | 14,489,645 (89·5) | 1,704,680 (10·5) | 17,928,894 (85·2) | 3,107,799 (14·8) |
| Realistic retention and switching | 14,013,940 (91·7) | 1,273,079 (8·3) | 18,165,482 (87·5) | 2,590,229 (12·5) |
| tVLM unless rVLM already implemented | ||||
| Perfect retention and switching | 14,962,931 (94·7) | 840,352 (5·3) | 18,555,392 (91·9) | 1,646,005 (8·1) |
| Realistic retention and switching | 14,351,186 (96·0) | 592,526 (4·0) | 18,698,566 (93·4) | 1,324,575 (6·6) |
| No scale-up of ART | ||||
| Universal rVLM | ||||
| Perfect retention and switching | 8,029,892 (84·4) | 1,489,423 (15·6) | 7,656,240 (80·4) | 1,863,886 (19·6) |
| Realistic retention and switching | 7,907,337 (86·6) | 1,225,338 (13·4) | 7,527,061 (82·3) | 1,619,668 (17·7) |
| rVLM unless specifically not recommended | ||||
| Perfect retention and switching | 8,280,724 (86·9) | 1,243,110 (13·1) | 7,886,505 (82·8) | 1,637,088 (17·2) |
| Realistic retention and switching | 8,096,624 (88·7) | 1,028,121 (11·3) | 7,717,612 (84·5) | 1,417,272 (15·5) |
| tVLM unless rVLM already implemented | ||||
| Perfect retention and switching | 8,024,241 (92·6) | 644,741 (7·4) | 7,630,573 (89·1) | 930,315 (10·9) |
| Realistic retention and switching | 8,352,633 (94·3) | 508,210 (5·7) | 7,963,587 (90·7) | 819,082 (9·3) |
rVLM, routine viral load monitoring; tVLM, targeted viral load monitoring
Figure 1.
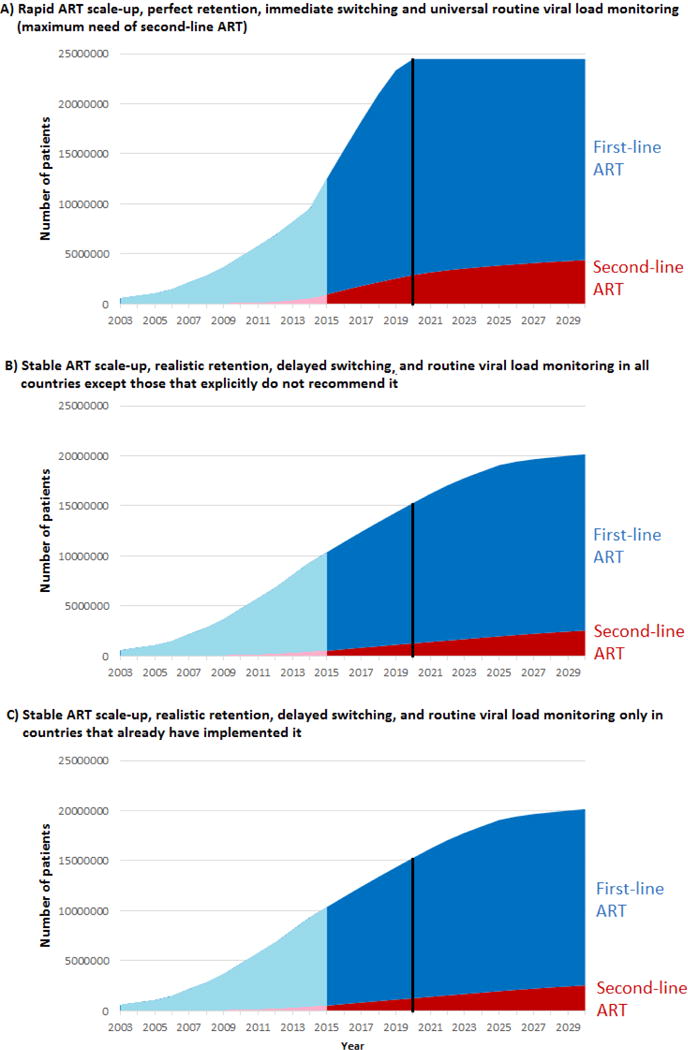
Projected number of patients on first- and second-line ART in sub-Saharan Africa 2003–2030 with perfect retention and switching, rapid ART scale-up and universal routine viral load monitoring (panel A), and with realistic retention and switching, stable ART scale-up and routine viral load monitoring in either all countries except those that do not recommend it (panel B), or only in the countries that already implement it (panel C). The blue area shows patients on first-line ART and the red area patients on second-line ART; past estimates (before 2015) are shown in light blue/pink respectively. The black vertical line shows year 2020.
The number of adults on second-line ART in 2020 ranged between 0·5 and 3·0 million (Table 3, Figure 1). If routine VLm was restricted to Botswana, Malawi and South Africa, 0·5–1·0 million patients were on second-line. The percentage of all patients who were on second-line ART was lowest (2·9%) with rapid scale-up, realistic retention and switching, and routine VLm only in Botswana, Malawi and South Africa, and highest (15·6%) with perfect retention and immediate switching, no further scale-up, and universal routine VLm.
In 2030, the number and percentage of adult patients on second-line ART had grown compared to 2020 in all scenarios (Table 3, Figure 1). The number of patients on second-line ART ranged between 0·8 and 4·6 million. The percentage was lowest (6·6%) with stable scale-up, realistic retention/switching, and routine VLm only in Botswana, Malawi and South Africa, and highest (19·6%) with no scale-up, perfect retention/switching, and universal routine VLm.
Estimates for individual countries
The supplementary appendix (Texts S3–S10) describes future second-line needs in eight countries: Botswana, Côte d’Ivoire, Ghana, Mozambique, South Africa, Swaziland, Zambia and Zimbabwe. The proportion of patients on second-line in 2014 ranged from 0·7% (Swaziland) to 13·1% (Botswana). In 2020, the proportion of patients ranged between 8.2% and 17.2% with routine VLm, and 2·5% and 7·8% with targeted VLm across all countries and scenarios. In 2030, the corresponding ranges were 13·5%–21·0% and 5·1%–12·2%. There were no clear differences between the countries: for the most optimistic scenario (routine VLm, perfect retention/switching, rapid scale-up), the proportion of patients on second-line ranged from 10·8% (South Africa) to 13·8% (Zambia) in 2020, and from 17·5% (South Africa) to 19·0% (Zambia) in 2030.
Discussion
Our results suggest that by 2020, the number of adult patients on second-line ART will at least double compared to 2014. By 2030, we expect that over 2 million people in SSA will be on second-line ART, and over 4 million will be in need. Regardless of the future scale-up of ART and the strategies of patient management, the demand of second-line ART will increase.
We included 18 scenarios of ART scale-up, retention, switching and monitoring. Second-line ART need was most sensitive to monitoring: The number of patients on second-line was over twice as high if routine VLm was implemented universally, compared to if it was not introduced in any new countries. This is in line with previous findings, suggesting that VLm substantially increases the rates of switching to second-line ART.4 It is still unclear how widely or rapidly routine VLm will be scaled up in SSA. The majority of SSA countries now recommend routine VLm in their national guidelines, but implementation is still in an early stage. However, the situation could change in the near future with falling cost14 and simplified strategies for VLm including point-of-care tests.11,15
Because VLm increases the use of second-line, the cost of second-line ART will become an increasingly important part of overall HIV programme costs. The cost-effectiveness of routine VLm depends mainly on the ratio of first- and second-line ART costs,11 and is improved if it supports less frequent clinic visits.16 Even if the costs of viral load tests are reduced to a minimum, the increased need for second-line may increase total costs substantially. Countries implementing VLm should prepare for these costs in advance. In 2020, the number of patients on second-line ART is almost one million more if routine VLm is implemented universally, than if it is not implemented in any country. This means an additional cost of about US$ 180 million. In contrast, providing a viral load test of US$ 20 to every patient on ART every second year, or US$ 10 test every year, would cost about US$ 150 million. This demonstrates how the cost of VLm may be driven more by the cost of second-line drugs rather than testing costs, and that efforts to scale up viral load monitoring need to be complemented by efforts to reduce the cost of second line drugs. The increased number of patients on second-line will also increase the need for further treatment regimens. Third-line ART currently costs over US$ 2000 per year, about 15 times more than the most common first-line regimen,3 and availability is very limited in SSA.
Strengths and limitations
Our study had several limitations. Our model was applied to each country separately, but we used the same parameters, fixed over time and based mainly on routine ART programmes from southern Africa.7–11 Baseline characteristics of these programmes are typical for SSA, but there are differences in the standard and practices of care. The standard of care has also changed over time: in the data used for parameterisation, most patients started ART at the late stage of the infection. The risk of virological failure could therefore become lower in the future, especially if new testing strategies identify people earlier in their disease progression and more tolerable and effective first-line drugs become available. The monitoring strategy and failure definition (viral load threshold) may also influence the risk of failure. Nevertheless, the risk of failure we assumed was based on South African data with frequent routine VLm, and is relatively low (5.7% after one year) compared to published estimates (0–43% with a follow-up time 3–48 months; pooled estimate 15%).17 Moreover, drug resistance levels, including transmitted resistance, can be expected to continue to increase, and further increase the need of second-line ART.18,19 Our results therefore provide a reliable estimate for the minimum need for and use of second-line ART.
Some parameters were estimated from the data indirectly to fit to the observed numbers of patients on first- and second-line ART. The number of patients starting ART each year may not reflect the reality in the earliest years on ART provision. We defined first- and second-line ART according to the treatment for HIV-1. The model may be less accurate in West Africa where HIV-2 is prevalent. Monitoring and switching scenarios were defined on country level, although they may differ substantially between health care facilities within the same country.
We restricted our study to adults. Until recently, ART coverage in children has been poor20 and most infected children died before reaching adulthood.21,22 However, effective interventions to prevent mother-to-child transmission have decreased the number of HIV-infected infants dramatically. There is a growing population of vertically infected children who survive into adolescence and transition, between the ages of 10 and 15, into adult HIV care. For this population, there are a number of important questions regarding the need for different ART regimens. A large proportion of the children who have started with a standard NNRTI-based regimen may need second-line ART in adolescence.13,23 The current recommendations suggest that children <3 years should start with a PI-based first line regimen2, making it complicated to find suitable and affordable regimens for those patients who experience treatment failure.10
Our model is not a transmission model. Future scenarios of ART scale-up were based on the rough assumption that the number of people living with HIV stays stable in the future. This assumption is probably realistic: incidence is decreasing, but life expectancy of HIV-positive individuals on ART is increasing. Within the last 15 years, the estimated number of HIV infected patients has grown by less than 2% annually. However, ART itself also influences HIV incidence, since virally suppressed patients are substantially less infectious than unsuppressed patients. The provision of second-line ART also plays a role, with early switching to second-line preventing some new infections.7
Conclusion
The number of people on ART has increased rapidly in recent years, the cohort of people who have been receiving ART for several years is increasing, and with this comes an increasing need for second-line therapy. The need for second-line will be largely determined by countries’ ability to scale up VLm to accurately diagnose treatment failure. Under ideal conditions, with most of the HIV infected population treated by 2020, perfect retention and universally implemented routine VLm, the need of second-line ART would grow to over 4 million by 2030. In reality, the number of patients on second-line therapy will however probably not be as high. Nevertheless, even the conservative estimates provided by this model indicate that governments and other health care providers should prepare for a substantial increase in the need of second-line therapy as access to VLm increases. To meet the need, it is essential to assure access to affordable second-line ART drugs for all patients who need it.
Supplementary Material
Text S1. Description of the mathematical model. Includes two tables.
Text S2. Adapting the model for each country. Includes one table.
Text S3. Botswana. Includes one table and two figures.
Text S4. Côte d’Ivoire. Includes one table and two figures.
Text S5. Ghana. Includes one table and two figures.
Text S6. Mozambique. Includes one table and two figures.
Text S7. South Africa. Includes one table and two figures.
Text S8. Swaziland. Includes one table and two figures.
Text S9. Zambia. Includes one table and two figures.
Text S10. Zimbabwe. Includes one table and two figures.
Excel file S11. User interface for model’s results.
Research in context.
Evidence before this study: Systematic reviews and literature searches (Madec Y et al 2013, PLoS One 9:e95820; Haas AD et al 2015, Lancet HIV 2:e271-8, Research in context) have concluded that there is a concern of low switching rates to second-line ART, in particular in settings where viral load monitoring is not available. We searched PubMed with the following search strategy: (HIV AND second-line[tiab] AND (review OR model)) without language restriction, and screened titles for studies assessing the future long-term need of second-line ART. No such studies were identified.
Added value of this study: We provided a 15-year projection for the need and use of second-line ART in sub-Saharan Africa. Our findings show that the number of patients on second-line ART in sub-Saharan Africa will likely grow from the current <1 million to around 2–3 million by 2030. The actual future use of second-line ART will depend on a number of factors, of which the implementation of routine viral load monitoring has the greatest impact. Universal implementation of routine viral load monitoring across the continent will likely at least double the need of second-line ART, compared with the current availability of routine viral load monitoring.
Implications of all the available evidence: Donors and countries in sub-Saharan Africa should prepare for a substantial increase in the need of second-line drugs during the next few years. Previous research has shown that routine viral load monitoring is a cost-effective strategy to monitor patients on ART, and it is recommended by the WHO and the majority of African countries. Its cost-effectiveness and affordability however depend crucially on the costs of second-line drugs. Therefore, there is an urgent need to further decrease the costs of second-line drugs as routine viral load monitoring is implemented widely.
Acknowledgments
The study was funded by the World Health Organization. The funder had no role in the study design, data collection or analysis, interpretation of the data, writing the report, or decision to publish. The corresponding author had access to all data, and had final responsibility for the decision to submit for publication.
Footnotes
Publisher's Disclaimer: This is a PDF file of an unedited manuscript that has been accepted for publication. As a service to our customers we are providing this early version of the manuscript. The manuscript will undergo copyediting, typesetting, and review of the resulting proof before it is published in its final citable form. Please note that during the production process errors may be discovered which could affect the content, and all legal disclaimers that apply to the journal pertain.
Authors’ contributions
JE, NF and OK designed the study. JE, LS, NB and AH developed and parameterised the model, and VH collected the data. JE performed the modelling and developed the Excel tool. JE wrote the first version of the manuscript, which was revised by NF and OK. All authors contributed to the interpretation of the findings and final version of the manuscript.
Conflicts of interest
All authors declare no conflicts of interest.
References
- 1.Joint United Nations Programme on HIV/AIDS (UNAIDS) AIDSInfo Online Database. Geneva, Switzerland: UNAIDS; p. 2015. Available from: www.aidsinfoonline.org. Accessed 27 December 2015. [Google Scholar]
- 2.World Health Organization. Recommendations for a public health approach. Geneva, Switzerland: World Health Organization; Consolidated Guidelines on the Use of Antiretroviral Drugs for Treating and Preventing HIV Infection; p. 2013. Available from: http://www.who.int/hiv/pub/guidelines/arv2013/en/. Accessed 6 November 2015. [PubMed] [Google Scholar]
- 3.Médecins Sans Frontières. Untangling the Web of Antiretroviral Price Reductions. 17th. Geneva, Switzerland: Médecins Sans Frontières; 2014. Available from: http://www.msfaccess.org/content/untangling-web-antiretroviral-price-reductions. Accessed 6 November 2015. [Google Scholar]
- 4.Haas AD, Keiser O, Balestre E, et al. Monitoring and switching of first-line antiretroviral therapy in adult treatment cohorts in sub-Saharan Africa: collaborative analysis. Lancet HIV. 2015;2:e271–8. doi: 10.1016/S2352-3018(15)00087-9. [DOI] [PMC free article] [PubMed] [Google Scholar]
- 5.Rutherford GW, Anglemyer A, Easterbrook PJ, et al. Predicting treatment failure in adults and children on antiretroviral therapy: a systematic review of the performance characteristics of the 2010 WHO immunologic and clinical criteria for virologic failure. AIDS. 2014;28(Suppl 2):S161–9. doi: 10.1097/QAD.0000000000000236. [DOI] [PubMed] [Google Scholar]
- 6.MSF Access Campaign. Issue Brief: Achieving undetectable: What questions remain in scaling-up HIV virologic treatment monitoring? Geneva, Switzerland: Médecins Sans Frontières; 2014. Available from: http://www.msfaccess.org/content/issue-brief-achieving-undetectable-what-questions-remain-scaling-hiv-virologic-treatment. Accessed 6 November 2015. [Google Scholar]
- 7.Estill J, Aubrière C, Egger M, et al. Viral load monitoring of antiretroviral therapy, cohort viral load and HIV transmission in Southern Africa: a mathematical modelling analysis. AIDS. 2012;26:1403–13. doi: 10.1097/QAD.0b013e3283536988. [DOI] [PMC free article] [PubMed] [Google Scholar]
- 8.Estill J, Egger M, Blaser N, et al. Cost-effectiveness of point-of-care viral load monitoring of antiretroviral therapy in resource-limited settings: mathematical modelling study. AIDS. 2013;27:1483–92. doi: 10.1097/QAD.0b013e328360a4e5. [DOI] [PMC free article] [PubMed] [Google Scholar]
- 9.Estill J, Egger M, Johnson LF, et al. Monitoring of antiretroviral therapy and mortality in HIV programmes in Malawi, South Africa and Zambia: mathematical modelling study. PLoS One. 2013;8:e57611. doi: 10.1371/journal.pone.0057611. [DOI] [PMC free article] [PubMed] [Google Scholar]
- 10.Estill J, Tweya H, Egger M, et al. Tracing of patients lost to follow-up and HIV transmission: mathematical modeling study based on 2 large ART programs in Malawi. J Acquir Immune Defic Syndr. 2014;65:e179–86. doi: 10.1097/QAI.0000000000000075. [DOI] [PMC free article] [PubMed] [Google Scholar]
- 11.Estill J, Salazar-Vizcaya L, Blaser N, Egger M, Keiser O. The cost-effectiveness of monitoring strategies for antiretroviral therapy of HIV infected patients in resource-limited settings: software tool. PLoS One. 2015;10:e0119299. doi: 10.1371/journal.pone.0119299. [DOI] [PMC free article] [PubMed] [Google Scholar]
- 12.Blaser N, Salazar-Vizcaya L, Estill J, et al. gems: An R Package for Simulating from Disease Progression Models. J Stat Softw. 2015;64:10. [PMC free article] [PubMed] [Google Scholar]
- 13.Salazar-Vizcaya L, Keiser O, Technau K, et al. Viral load versus CD4+ monitoring and 5-year outcomes of antiretroviral therapy in HIV-positive children in Southern Africa: a cohort-based modelling study. AIDS. 2014;28:2451–60. doi: 10.1097/qad.0000000000000446. [DOI] [PMC free article] [PubMed] [Google Scholar]
- 14.Clinton Health Access Initiative. Improving Access to Viral Load Testing for HIV Patients in Developing Countries. Boston, MA, United States: Clinton Health Access Initiative; 2014. Available from: https://www.clintonfoundation.org/blog/2014/12/01/improving-access-viral-load-testing-hiv-patients-developing-countries. Accessed 6 November 2015. [Google Scholar]
- 15.UNITAID. HIV&AIDS Diagnostics Landscape Technology. Semi-annual update. Geneva, Switzerland: World Health Organization; 2015. Available from: http://www.unitaid.eu/en/resources/publications/technical-reports. Accessed 6 November 2015. [Google Scholar]
- 16.Working Group on Modelling of Antiretroviral Therapy Monitoring Strategies in sub-Saharan Africa. Sustainable HIV treatment in Africa through viral load-informed differentiated care. Nature. 2015;528:S68–76. doi: 10.1038/nature16046. [DOI] [PMC free article] [PubMed] [Google Scholar]
- 17.Barth RE, van der Loeff MF, Schuurman R, Hoepelman AI, Wensing AM. Virological follow-up of adult patients in antiretroviral treatment programmes in sub-Saharan Africa: a systematic review. Lancet Infect Dis. 2010;10:155–66. doi: 10.1016/S1473-3099(09)70328-7. [DOI] [PubMed] [Google Scholar]
- 18.Gupta RK, Jordan MR, Sultan BJ, et al. Global trends in antiretroviral resistance in treatment-naïve individuals with HIV after rollout of antiretroviral treatment in resource-limited settings: a global collaborative study and meta-regression analysis. Lancet. 2012;380:1250–8. doi: 10.1016/S0140-6736(12)61038-1. [DOI] [PMC free article] [PubMed] [Google Scholar]
- 19.Rhee SY, Blanco JL, Jordan MR, et al. Geographic and temporal trends in the molecular epidemiology and genetic mechanisms of transmitted HIV-1 drug resistance: an individual-patient- and sequence-level meta-analysis. PLoS Med. 2015;12:e1001810. doi: 10.1371/journal.pmed.1001810. [DOI] [PMC free article] [PubMed] [Google Scholar]
- 20.UNAIDS report on the global AIDS epidemic. Geneva, Switzerland: Joint United Nations Programme on HIV/AIDS (UNAIDS); 2013. Available from: http://www.unaids.org/sites/default/files/media_asset/UNAIDS_Global_Report_2013_en_1.pdf. Accessed 6 November 2015. [Google Scholar]
- 21.Ferrand RA, Corbett EL, Wood R, et al. AIDS among older children and adolescents in Southern Africa: projecting the time course and magnitude of the epidemic. AIDS. 2009;23:2039–46. doi: 10.1097/QAD.0b013e32833016ce. [DOI] [PMC free article] [PubMed] [Google Scholar]
- 22.Obimbo EM, Mbori-Ngacha DA, Ochieng JO, et al. Predictors of early mortality in a cohort of human immunodeficiency virus type 1-infected African children. Pediatr Infect Dis J. 2004;23:536–43. doi: 10.1097/01.inf.0000129692.42964.30. [DOI] [PMC free article] [PubMed] [Google Scholar]
- 23.Musiime V, Kaudha E, Kayiwa J, et al. Antiretroviral drug resistance profiles and response to second-line therapy among HIV type 1-infected Ugandan children. AIDS Res Hum Retroviruses. 2013;29:449–55. doi: 10.1089/aid.2012.0283. [DOI] [PubMed] [Google Scholar]
Associated Data
This section collects any data citations, data availability statements, or supplementary materials included in this article.
Supplementary Materials
Text S1. Description of the mathematical model. Includes two tables.
Text S2. Adapting the model for each country. Includes one table.
Text S3. Botswana. Includes one table and two figures.
Text S4. Côte d’Ivoire. Includes one table and two figures.
Text S5. Ghana. Includes one table and two figures.
Text S6. Mozambique. Includes one table and two figures.
Text S7. South Africa. Includes one table and two figures.
Text S8. Swaziland. Includes one table and two figures.
Text S9. Zambia. Includes one table and two figures.
Text S10. Zimbabwe. Includes one table and two figures.
Excel file S11. User interface for model’s results.