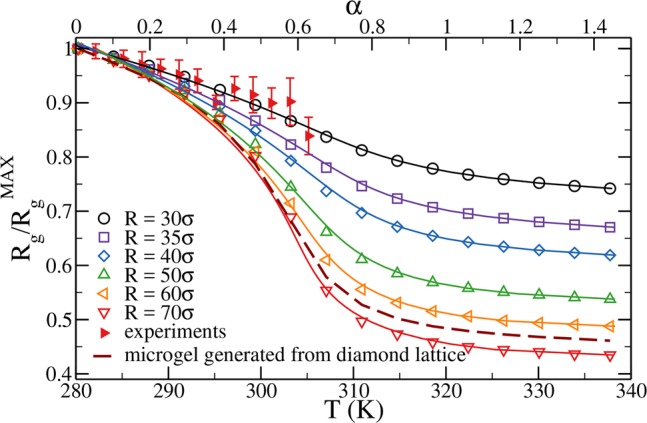
Figure 6.

Normalized radius of gyration Rg/RgMAX as a function of α (top axis) and temperature (bottom axis). Open symbols are numerical results obtained for microgels with N ∼ 41 000 monomer beads and a concentration of cross-linkers = 3.2% for different values of the confining radius Z. Filled symbols are results from multiangle DLS experiments; here the radius of gyration is normalized by its value at the lowest measured temperature, T = 282 K. Solid lines are fits of the numerical data using the Flory–Rehner theory. The dashed line refers to the case of a microgel generated by a diamond-lattice configuration.
