

Abstract
Due to environmental insult or innate genetic deficiency, protein folding environments of the mitochondrial matrix are prone to dysregulation, prompting the activation of a specific organellar stress-response mechanism, the mitochondrial unfolded protein response (UPRMT). In Caenorhabditis elegans, mitochondrial damage leads to nuclear translocation of the ATFS-1 transcription factor to activate the UPRMT. After short-term acute stress has been mitigated, the UPRMT is eventually suppressed to restore homeostasis to C. elegans hermaphrodites. In contrast, and reflective of the more chronic nature of progressive neurodegenerative disorders such as Parkinson's disease (PD), here, we report the consequences of prolonged, cell-autonomous activation of the UPRMT in C. elegans dopaminergic neurons. We reveal that neuronal function and integrity decline rapidly with age, culminating in activity-dependent, non-apoptotic cell death. In a PD-like context wherein transgenic nematodes express the Lewy body constituent protein α-synuclein (αS), we not only find that this protein and its PD-associated disease variants have the capacity to induce the UPRMT, but also that coexpression of αS and ATFS-1-associated dysregulation of the UPRMT synergistically potentiate dopaminergic neurotoxicity. This genetic interaction is in parallel to mitophagic pathways dependent on the C. elegans PINK1 homolog, which is necessary for cellular resistance to chronic malfunction of the UPRMT. Given the increasingly recognized role of mitochondrial quality control in neurodegenerative diseases, these studies illustrate, for the first time, an insidious aspect of mitochondrial signaling in which the UPRMT pathway, under disease-associated, context-specific dysregulation, exacerbates disruption of dopaminergic neurons in vivo, resulting in the neurodegeneration characteristic of PD.
SIGNIFICANCE STATEMENT Disruptions or alterations in the activation of pathways that regulate mitochondrial quality control have been linked to neurodegenerative diseases due in part to the central role of mitochondria in metabolism, ROS regulation, and proteostasis. The extent to which these pathways, including the mitochondrial unfolded protein response (UPRMT) and mitophagy, are active may predict severity and progression of these disorders, as well as sensitivity to compounding stressors. Furthermore, therapeutic strategies that aim to induce these pathways may benefit from increased study into cellular responses that arise from long-term or ectopic stimulation, especially in neuronal compartments. By demonstrating the detrimental consequences of prolonged cellular activation of the UPRMT, we provide evidence that this pathway is not a universally beneficial mechanism because dysregulation has neurotoxic consequences.
Keywords: alpha-synuclein, C. elegans, dopaminergic, mitochondria, neurodegeneration, stress
Introduction
Parkinson's disease (PD) is an age-associated neurodegenerative movement disorder that affects millions of people worldwide, with newer cases predicted to outpace current healthcare infrastructure due to an accelerated increase in the worldwide elderly population (Findley, 2007; Kowal et al., 2013). Despite deficiencies in the understanding of the molecular determinants of PD, advancements have been made toward discerning the risk for developing PD. For instance, several familial forms of PD have been linked to mutations in genes such as PINK1, Parkin, and DJ-1, which collectively surveil and protect mitochondria through selective organellar autophagy (mitophagy) (Chu, 2010). This pathway links PD-associated molecular phenotypes such as ROS generation, accumulation of misfolded proteins due to oxidative stress, ATP decline, intracellular calcium disequilibrium, and cell death due to mitochondrial dysfunction (Baker et al., 2011; Morimoto and Cuervo, 2014). Therefore, mitophagy and other mitochondrial quality control (MQC) mechanisms have emerged as prime candidates for the understanding and possible treatment of PD and PD-like pathologies. Broadly, MQC responds to damaged mitochondria by various mechanisms, from alterations in protein expression to destruction of the entire organelle, to promote cellular and metabolic homeostasis (Tatsuta and Langer, 2008; Green and Van Houten, 2011). One pathway of MQC in Caenorhabditis elegans termed the mitochondrial unfolded protein response (UPRMT) is activated after a reduction in mitochondrial import efficiency, increased peptide efflux from the mitochondria, or damage to the electron transport chain (ETC) to stabilize the ATF5-like, bZIP transcription factor ATFS-1. This pathway is analogous to the mammalian UPRMT, which uses ATF5 as a mediator for this response (Haynes et al., 2010; Fiorese et al., 2016). Once stabilized, the transcription factor accumulates in the nucleus and alters global transcription to promote oxidative phosphorylation recovery (Nargund et al., 2012; Nargund et al., 2015).
Like the better understood unfolded protein response systems in the cytoplasm or ER, the UPRMT is typically reported as being cytoprotective and promotes cell survival and organelle recovery when activated (Papa and Germain, 2011; Lamech and Haynes, 2015). This is especially true when transient mitochondrial stressors such as paraquat, rotenone, or antimycin are presented to animals (Yoneda et al., 2004; Runkel et al., 2013; Ray et al., 2014). Furthermore, activation of the UPRMT promotes pathogen resistance, metabolic stability, and associates with lifespan extension (Durieux et al., 2011; Rauthan et al., 2013; Pellegrino et al., 2014). Therefore, there is an unequivocal potential of this pathway for promotion of beneficial cellular homeostasis, especially in response to genetic or environmental challenges. Notably, although there is an extensive body of literature on the cytoprotective response of the UPRMT, some lines of evidence indicate a toxic potential of the UPRMT pathway that shortens lifespan and promotes accumulation of defective mitochondria (Bennett et al., 2014; Lin et al., 2016). It is this duality that necessitates investigation of the UPRMT on cellular health, especially within the dopaminergic neuronal compartment, to link this pathway with PD pathogenesis.
Previously, we established C. elegans as a genetic animal model with which to investigate functionally conserved determinants of PD pathology through expression of the inherently disordered protein α-synuclein (αS) by examination of dopaminergic cell death as well as by direct observation of αS misfolding (Cao et al., 2005; Hamamichi et al., 2008). We advance the understanding of the UPRMT as a toxic pathway when dysregulated by demonstrating severe age-dependent neurodegenerative phenotypes in nematode dopaminergic neurons. Specifically, in the absence of αS, we find that overactivation of the ATFS-1-mediated UPRMT signal induces a non-apoptotic cell death phenotype in dopaminergic neurons that is independent of mitophagy downregulation, but is mitigated by the induction of PINK-1 activity. Second, in the presence of αS, overactivity of the UPRMT pathway potentiates αS-induced dopaminergic neurotoxicity, whereas a loss-of-function atfs-1 mutation attenuates αS proteotoxicity in dopaminergic neurons and animal muscles. We therefore conclude that UPRMT overactivation has the capability of damaging dopaminergic neurons and exacerbating αS pathogenesis in aged animals, which, to our knowledge, has never been reported.
Materials and Methods
C. elegans strains.
Nematodes were grown and maintained on OP50 E. coli bacteria at 20°C under standard laboratory conditions (Brenner, 1974). We obtained the following strains from the Caenorhabditis Genetics Center: N2, SJ4100 (zcIs13 [Phsp-6::GFP]), SJ4143(zcIs17 [Pges-1::GFPMTS]), VC3201 (atfs-1(gk3094)), QC115 (atfs-1(et15)), KJ216 (crt-1(jh101)), MT2551 (ced-4(n1162); dpy-17(e164)), and CB1112 (cat-2(e1112)). The following were obtained from the Mitani Laboratory through the National Bio-Resource Project, Japan: lrk-1(tm1898), pink-1(tm1779). Strain BY250 [vtIs7 (Pdat-1::GFP)] was a generous gift from Randy Blakely (Florida Atlantic University). The isogenic strain UA44 [baIn11 (Pdat-1::α-syn, Pdat-1::GFP)] expresses α-syn and GFP in the DA neurons. UA196 [sid-1(pk3321); baIn33 (Pdat-1::sid-1, Pmyo-2::mCherry); baIn11] was generated as described previously (Harrington et al., 2012) and expresses α-syn, GFP, and SID-1 in the DA neurons. Strain UA49 is also isogenic [baIn2 (Punc-54::α-syn::GFP)] and expresses an αS::GFP fusion in body wall muscle cells. The following strains were generated by injecting GATEWAY (Invitrogen) ATFS-1 constructs under a Pdat-1 DEST vector into N2 animals: UA298 (baEx177 [P dat-1::ATFS-FL, Pmyo-2::mCherry]), UA299 (baEx178 [P dat-1::ATFS-ΔNIS, Pmyo-2::mCherry]), UA300 (baEx179 [Pdat-1::ATFS-ΔZIP, Pmyo-2::mCherry]), UA301 (baEx180 [Pdat-1::ATFS-ΔMTS, Pmyo-2::mCherry]), UA302 (baEx181 [Pdat-1::ATFS-ΔMTSΔNIS, Pmyo-2::mCherry]) and UA303 (baEx182 [Pdat-1::ATFS-ΔMTSΔZIP, Pmyo-2::mCherry]). The following strain was generated by injecting the GATEWAY ATFS-1-FL construct under a Pdat-1 DEST vector into a UA196 animal: UA309 (baEx188 [Pdat-1::ATFS-FL,rol-6]; sid-1(pk3321); baIn33[Pdat-1::sid-1, Pmyo-2::mCherry]; baIn11[Pdat-1::α-syn,Pdat-1::GFP]). The following strains were generated by injecting GATEWAY αS constructs under a Pges-1 DEST vector into N2 animals: UA304 (baEx183 [Pges-1::α-synuclein-WT, Pmyo-2::mCherry], UA305 (baEx184 [Pges-1::α-synuclein-A53T, Pmyo-2::mCherry]), UA306 (baEx185 [Pges-1::α-synuclein-A30P, Pmyo-2::mCherry]), UA307 (baEx186[Pges-1::α-synuclein-Δ1–32, Pmyo-2::mCherry]).
Molecular cloning and mutagenesis.
cDNA from Bristol N2 whole animal lysate was generated from mRNA using a Promega M-MLV RT kit after MRC RNAzol RNA extraction. From cDNA, atfs-1 was amplified with the following GATEWAY cloning primers using the New England Biolabs High-Fidelity Phusion DNA polymerase PCR kit: ATTB1 ATFS-1: GGGGACAAGTTTGTACAAAAAAGCAGGCTCCATGTTTTCCCGTGTGGGACG; ATTB2 ATFS1: GGGGACCACTTTGTACAAGAAAGCTGGGTCTTATTGAATAATGGCGCCCATTTTACG.
Following 1% agarose gel electrophoresis, a single band was identified, excised, and cloned into a GATEWAY DONR221 vector backbone using the manufacturer's guidelines (Invitrogen). After sequencing, we determined that the cloned product was a 1419 bp fragment corresponding to isoform-B of ATFS-1. Intriguingly, after checking the fidelity of the sequence compared with WormBase, we identified an undocumented N2 SNP (G1216A) which was corrected (CR) by sequential PCR fusion with the following primers: ATFS-1 CR forward: CCTTCAGTCGACGAGGAAACCGATCG; ATFS-1 CR reverse: CTCGTCGACTGAAGGCTTCAGAACAACTCCACG.
After recloning, the sequence was again checked for fidelity compared with Wormbase and was confirmed to be correct. This vector (ATFS-1FL) served as the template for all mutagenic reactions in ATFS-1. These mutagenic reactions generally followed the same formula: ATTB1 forward primers are paired with a mutagenic reverse primer and vice versa to generate two PCR products that overhang significantly. To fuse the products together, a PCR was performed with only the two PCR products (no ATTB primers) for five cycles, followed by addition of the ATTB primers to complete the reaction followed by GATEWAY cloning. In this manner, the following primers were used to remove a lysine rich NLS-like motif KFKKR [ATFS-1ΔNIS (Δ391–395)], or to alter two conserved leucine residues in the bZIP domain [ATFS-1ΔZIP (L446, 453A)], by sequential PCR fusion: ATFS-1ΔNIS (Δ391–395) forward: CCGATGACTATTTTCCAGAAGAACATCAGGGAGTTGTTCTGAAGCCTTCAGTCG; ATFS-1ΔNIS (Δ391–395) reverse: CGACTGAAGGCTTCAGAACAACTCCCTGATGTTCTTCTGGAAAATAGTCATCGG; ATFS-1ΔZIP (L446, 453A) forward: GCTGATCGTAATCGAATTGCTCTTCAAAAAGAACGTCAAGCAAAGCGTGAGATCAACTCG; ATFS-1ΔZIP (L446, 453A) reverse: CGAGTTGATCTCACGCTTTGCTTGACGTTCTTTTTGAAGAGCAATTCGATTACGATCAGC.
Last, to remove the first 32 residues after the start codon [ATFS-1ΔMTS (Δ1–32)], a single ATTB1 mutagenic primer was used: ATTB1 ATFS-1ΔMTS (Δ1–32) forward: GGGGACAAGTTTGTACAAAAAAGCAGGCTCCATGACCGCACCGATCAATGACCAGCTGACCAGTTTTGCG.
All DONR vectors were sequenced and compared with a predicted sequence before GATEWAY insertion into a DEST vector containing an ∼3000 bp promoter region (Pdat-1) to drive expression of proteins to the dopaminergic compartment as described previously (Cao et al., 2005). Injection into N2 animals was performed using a microinjection needle and 50 ng/μl ATFS-1 construct with a marker transgene (Pmyo-2:mCherry) at no more than 5 ng/μl. At least three stable lines were generated for each C. elegans transgenic construct.
In a similar fashion, αS constructs were generated by sequential PCR fusion followed by sequence comparison with the National Center for Biotechnology Information National Institutes of Health database. A human wild-type (αSWT) construct in a DONR221 vector was used as a template for mutagenic reactions (Cao et al., 2005). The primers for these reactions are as follows: A53T forward: GGTGCATGGTGTGACAACAGTGGCTGAGAAGACCAAAGAGC; A53T reverse: GCTCTTTGGTCTTCTCAGCCACTGTTGTCACACCATGCACC; A30P forward GCAGAAGCACCAGGAAAGACAAAAG; A30P reverse CTTTTGTCTTTCCTGGTGCTTCTGC.
A single ATTB1 forward primer was used to generate an αS (Δ1–32) deletion: ATTB1 (Δ1–32): GGGGACAAGTTTGTACAAAAAAGCAGGCTCCATGACAAAAGAGGGTGTTCTCTATGTAGGC.
All DONR vectors were sequenced and compared with a predicted sequence before GATEWAY insertion into a DEST vector containing a promoter region (Pges-1) to drive expression of proteins to the C. elegans intestinal compartment.
Genetic crosses.
Using the transgenic lines generated as described above, several crosses were performed to introduce them into the appropriate reporter strain and/or the right mutant background. To begin, N2 males were first generated by heat shocking and propagation. Four to six transgenic hermaphrodites (Pmyo-2::mCherry) were placed on a small 35 mm NGM plate with 10–15 N2 males and allowed to mate. After 24 h, hermaphrodites were isolated onto individual plates and screened for male generation. In this fashion, transgenic lines are both outcrossed to N2 and males are generated for mating (transgenic males). To cross ATFS-1 constructs (UA298-303) into BY250 [vtIs7 (Pdat-1::GFP)], SJ4100 (zcIs13 [Phsp-6::GFP]), or UA44 [baIn11 (Pdat-1::α-syn, Pdat-1::GFP)], 10–15 transgenic males were placed on a small plate with six hermaphrodites of the corresponding reporter strain. After 24 h, hermaphrodites were isolated and screened for the presence of progeny generation with the (Pmyo-2::mCherry) marker transgene. These were termed F1 progeny and are heterozygous for GFP, which in all cases is a dominant phenotype. Twelve F1 hermaphrodite animals with both the red marker pharynx and the green reporter were isolated in triplicate on a 60 mm NGM plate and allowed to self-cross. Thirty to 50 F1 male animals with both the red marker pharynx and the green reporter were isolated and used within 24 h for further genetic crosses. F2 animals were isolated from the pooled hermaphrodite plates and their F3 progeny were screened for complete penetrance of the integrated GFP reporter. These were considered the successfully crossed lines. In a similar fashion, αS expression lines (UA304-307) were crossed into SJ4100 and SJ4143 (zcIs17 [Pges-1::GFPΔMTS]).
To cross ATFS-1 constructs (UA298–303) in BY250 [vtIs7 (Pdat-1::GFP)] or UA44 [baIn11 (Pdat-1::α -syn, Pdat-1::GFP)] into mutations of KJ216 (crt-1(jh101)), MT2551 (ced-4(n1162); dpy-17(e164)), lrk-1(tm1898), or pink-1(tm1779), the F1 male progeny as described above were used by introducing 10–15 males onto a 35 mm NGM plate with six young adult mutant hermaphrodites. After 24 h, mutant hermaphrodites were isolated and screened for the F2 generation progeny with the red marker pharynx and screened carefully for the presence of GFP accumulation in dopaminergic neurons (only 50% of RFP+ animals will possess GFP). All F2 animals are theoretically heterozygous for the mutations of interest. Therefore, 10–12 F2 GFP+, RFP+ heterozygote hermaphrodites were pooled and allowed to self-cross. The resulting F3 animals that were RFP and GFP positive were isolated and their F4 progeny were screened by several methods to ensure homozygosity of the mutation of interest. For KJ216 (crt-1(jh101)), lrk-1(tm1898), or pink-1(tm1779) the following primers were used to visualize the molecular lesion by PCR followed by agarose gel separation: pink-1(tm1779) forward: GTTACAAGGCGAGCCTGAAAG; pink-1(tm1779) reverse: GAAGCCTCGGGCTTATTAAGG; crt-1(jh101) forward: CTGTCCTCATCGATGAGCATC; crt-1(jh101) reverse: GACCAGCCAAGATGCCAAG; lrk-1(tm1898) forward: CAGCGTAGAAGAAGGTCGATG; lrk-1(tm1898) reverse: CCATCGGAAGTGTGCTCAGTC.
Homozygous mutant animal broods will show a truncated PCR product, whereas N2 animals will show a full-length PCR product; heterozygotes will display a mixture of full-length and truncated products. At least two candidate lines were isolated and GFP+ homozygous mutant animals were isolated. The F5 progeny lines that show 100% GFP penetrance are homozygous for both GFP and the mutant. Mutations were confirmed once more by PCR to ensure fidelity. MT2551 (ced-4(n1162); dpy-17(e164)) mutations are confirmed by the presence of the linked dpy-17 mutation and propagated as such phenotypically. The mutant ced-4 phenotype is identifiable due to the presence of ectopic and faintly visible extra dopaminergic neurons.
To cross BY250 [vtIs7 (Pdat-1::GFP)], UA44 [baIn11 (Pdat-1::α-syn, Pdat-1::GFP)], or UA49 (Punc-54::α-syn::GFP) into VC3201 (atfs-1(gk3094)) or QC115 (atfs-1(et15)), N2 males were generated as described previously and introduced into GFP marker lines to generate a heterozygous out-crossed male population. These F1 males were then introduced to atfs-1 mutations as described above and screened with the following primers: atfs-1(gk3094) forward: ATAGAAACCGCCTCCTTTCG; atfs-1(gk3094) reverse: TTCTCGGCTCGTTTCTTCTC; atfs-1(et15) forward GCCAAACTCTTCATTCCATCTG; atfs-1(et15) reverse CTGCTGATAGATGTTATCTCTG.
The atfs-1(gk3094) mutation is a deletion that is observable by 1% agarose gel separation. However, to visualize the point mutation in atfs-1(et15), we incubated PCR product overnight at room temperature with the AatII restriction enzyme followed by agarose gel separation on a 2% agarose gel (mutant animal product will not generate restriction fragments).
C. elegans neuron and protein aggregation assays.
The six anterior dopaminergic neurons were assessed by fluorescence microscopy for neuronal abnormalities and neurodegeneration as described previously (Cao et al., 2005; Ray et al., 2014; Martinez et al., 2015). Briefly, because C. elegans possesses an invariant lineage, alterations to dopaminergic neuron count or neuronal morphology are easily observed and scored. The soma swelling assay consisted of examining the four sensory cephalic (CEP) soma and the two anterior deirid (ADE) neurons. If at least one of these six dopaminergic neurons exceeded two to three times their normal diameter, the entire animal was categorized as possessing a swollen soma phenotype. This was an “either/or” assay. To assay dopaminergic dendritic blebbings, the four CEP processes were observed for inconsistent enlargements, often described as “pearling.” To assay dopaminergic cell death, each of two ADE neurons and four CEPs were located and counted. Soma swelling, cell death, and dendritic blebbing values were generated from a population of 30–40 animals per construct. This was repeated two to three times per construct, with three transgenic lines being used. Qualitative scoring of protein aggregation within body wall muscle cells for αS::GFP misfolding was performed as described previously (Hamamichi et al., 2008; Martinez et al., 2015).
Measurement of fluorescence intensity.
Fluorescence intensity was performed as described previously (Ray et al., 2014). Briefly, 20–30 animals were imaged per replicate, maintaining either constant exposure values or using background subtraction, depending on the type of experiment. For dopaminergic neuron GFP accumulation, background subtraction was used due to variation in background fluorescence compared with neuronal GFP accumulation. Intestinal GFP expression used constant exposure values. Once imaged, animals were analyzed using a standardized pixel defined region that was either a 60-pixel-diameter circle for neurons or an 80 × 80 pixel box that encompassed the first two intestinal cells (MetaMorph Software). At least three replicates were analyzed per transgenic line (where applicable) and at least two transgenic lines were used per construct.
Mitochondrial morphology.
SJ4143(zcIs17 [Pges-1::GFPMTS]) and αS variant lines (UA304–308) were assayed for mitochondrial morphology phenotypes in intestinal cells as described previously (Martinez et al., 2015). Scored animals were cross-referenced to an RFP filter to ensure that observed structures were bona fide mitochondria and not autofluorescent gut granules. To assess mitochondrial morphology of the intestine, 30 animals were grown to day 7 posthatching and scored for a mitochondrial morphology profile. If mitochondria were short, tubular, and disconnected, they were considered wild-type. If mitochondria were highly interconnected, they were scored as possessing a fused profile. If mitochondria adopted a largely circular and enlarged profile, this was considered fragmentation. The posterior region of the animal was consistently scored because it provided the least amount of depth distortion. These assays were performed at least in duplicate per transgenic line and three transgenic lines were scored in total.
Basal slowing response (BSR) assay.
All BSR assays were performed using day 7 worms obtained via 2–3-h egg lays and subsequent culture on NGM plates seeded with HB101 E. coli (OD600 of 0.6–0.7A) using previously described methods (Sawin et al., 2000). C. elegans locomotion was recorded using an automated video tracking system (MBF Bioscience). All videos were analyzed using WormLab Software (Version 4.0.5; MBF Bioscience). The average peristaltic speed was recorded for the 100 frames immediately before a worm's head touched the HB101 bacterial boundary on a Petri dish and the 100 frames immediately after the worm's head touched the bacterial boundary. Ten animals were analyzed per construct in four separate replicates. The peristaltic speed on food was compared with peristaltic speed off food and converted to a ratio (on/off) that was inverted and normalized to the N2 value to represent BSR as a percentage response compared with N2 (defined as 100%). Two representative transgenic lines were used per construct.
C. elegans chemical exposure regimen.
Consistent drug concentrations were achieved by mixing drugs with solvent (EtOH or water) into semimolten agar at a measured volume of 4 ml and kept cold until analysis. Because drug delivery to worms may be mitigated by the thickness of the OP50 bacterial lawn, we consistently used 100 μl of a 5× concentrated OP50 bacterial solution from a freshly grown culture with OD600 = 0.6 such that the thickness of the bacterial lawn did not vary in our experiments. These drugs were as follows: rotenone (Sigma-Aldrich; Lot:078K1514), antimycin A (Sigma-Aldrich, Lot #063M4075V), sodium azide (Acros Organics, Geel, Belgium; Lot #A0340608), and oligomycin A (Millipore Sigma). Rotenone, antimycin A, and oligomycin A were dissolved in EtOH such that the final plate volume of EtOH was 2% (2% EtOH was used as a vehicle control). Sodium azide was dissolved in water. Final concentrations of these drugs were as follows: 1 μm rotenone, 1 μm antimycin, 2 μm oligomycin, and 100 μm sodium azide. To determine the concentration for each drug in cell death experiments, we determined the intersection of two behaviors elicited by these drugs. First, we determined the sublethal dosages at which animals did not appreciably die over a 48 h period while being exposed to the drug. This formed the first axis. Second, we determined to what extent the UPRMT reporter strain SJ4100 (Phsp-6::GFP) was activated as measured by GFP intensity. We used, as an upper threshold, a concentration value that produced a minimal amount of death over a 24–48-h period and, as a lower threshold, a value approximately two orders of magnitude below that concentration value. Consistent dosage intervals were used across this range and, after 24 h of drug exposure, GFP pixel intensity was measured for Phsp-6::GFP activation. Upper ranges tended to induce abnormal GFP intensities and sickness, likely due to pleiotropic effects of these drugs. However, a range that was too low did not produce a strong UPRMT response. Therefore, the final concentrations of drugs used were those that produced a moderate UPRMT response but did not induce animal death.
RNAi bacteria growth conditions.
RNAi bacteria (HT115) containing the L4440 feeding vector were initially grown on LB plates containing 12.5 μg/ml tetracycline and 100 μg/ml ampicillin for 16 h at 37°C. Single colonies were then transferred to LB broth containing 100 μg/ml ampicillin for 16 h at 37°C. RNAi bacteria in liquid culture NGM were then placed onto NGM analysis plates at a concentration of 250 μl/4 ml NGM medium, which also contained 1 mm IPTG and 100 μg/ml ampicillin. Growth proceeded for 24 h at ambient temperature.
Fluorescence microscopy.
Worms were immobilized with 3 mm levamisole and mounted on 2% agarose pads on a microscope slide. Fluorescent microscopy was performed using a Nikon Eclipse E800 epifluorescence microscope equipped with an Endow GFP HYQ filter cube or a Texas Red filter cube (Chroma Technology). A Cool Snap CCD camera (Photometrics) driven by MetaMorph software (Molecular Devices) was used to acquire images.
Quantitative RT-PCR.
Sixteen strains were analyzed in total: three negative controls, N2, SJ4100, and SJ4143; one positive control, UA44, which was used for interrun corrections; and transgenic lines 1 through 3 for each of four αS intestinal constructs. Animals were amplified to confluence and hypochlorite treated to isolate embryos. Embryos were washed and allowed to recover on NGM plates seeded with OP50 bacteria. At the L4 stage, 300 animals of each construct were handpicked and transferred to a new NGM plate. Twenty-four hours later, plates were washed using S-basal medium. Worm populations were washed at least four times to remove bacterial carryover. Finally, worms were placed in a solution of 200 μl of S-basal medium and sonicated to release nucleic acids. Immediately, worms were frozen in liquid nitrogen. To extract RNA from samples, we used RNAzol reagent (Millipore Sigma) following the manufacturer's protocol, which largely removes both DNA and protein from samples. To doubly ensure that genomic DNA carryover was completely removed from samples, we vigorously treated samples 1:10 with RQ1 DNase (Promega) for 2–3 h at 37°C. In general, solutions were 30 μl (24 μl water, 3 μl DNase, 3 μl buffer). Approximately 100 ng of RNA sample was used in an RT-PCR before reverse transcriptase treatment to confirm the absence of genomic DNA. Once each sample was purged of genomic DNA, we generated cDNA libraries of 1 μg of total RNA for each sample using Iscript (Bio-Rad) following the manufacturer's protocol. After the generation of cDNA, samples were diluted in ultrapure water to a final concentration of 20 ng/μl and stored at −80°C until analysis. In total, two biological sets were generated for each sample (except UA44, which was used to control for interrun variation).
qRT-PCR was performed using SYBR green (Bio-Rad) at a final volume of 15 μl per sample, with two technical replicates per sample and three reference genes. Primers used were tested against a broad range of standard concentrations to test efficiency and all were within tolerance (95–105%) with an acceptable R2 regression (≥0.985). Primers and final concentrations were as follows: α-Synuclein forward (100 nm): GTGGCTGAGAAGACCAAAG; α-Synuclein reverse (100 nm): CTACTGCTGTCACACCCGTCACC; snb-1 forward (400 nm): CCGGATAAGACCATCTTGACG; snb-1 reverse (400 nm): GACGACTTCATCAACCTGAGC; cdc-42 forward (400 nm): CTGCTGGACAGGAAGATTACG; cdc-42 reverse (400 nm): CTCGGACATTCTCGAATGAAG; pmp-3 forward (400 nm): GTTCCCGTGTTCATCACTCAT; pmp-3 reverse (400 nm): ACACCGTCGAGAAGCTGTAGA.
Relative expression values were calculated using Biogazelle qBase+ software. Biological replicates were corrected for interrun variation and graphed using GraphPad Prism software.
Experimental design and statistical analysis.
As is standard in the C. elegans field, hermaphrodites were analyzed. We used three independently generated extrachromosomal transgenic lines per construct to control for gene copy number. In all cases, sample sizes (typically 30 animals per transgenic line) were standardized within each experiment and sampled in a uniform fashion. All experiments use three independent values (e.g., replicates or replicate averages) generated per experiment per variable, which were averaged together to generate a mean experimental value. Specifically, for the dopaminergic fluorescent accumulation experiment (see Fig. 1), the BSR experiment, the GFP accumulation in mitochondria experiment, and the Phsp-6::GFP expression experiment, in which animals were scored individually (or multiple populations were assayed/replicate), these data used SEM. In contrast, for neuronal assays and mitochondrial morphology experiments, replicate animal populations were collectively given a score and the assay was performed at least three times. The statistics here used SD. The null hypothesis assumes that tested conditions do not significantly alter measured values observed in negative controls, which generally consist of GFP-only controls in an N2 background when comparing animals or solvent-only controls when analyzing drug effects. In experiments using one independent variable across multiple tested effects (e.g., neuron cell death as a function of construct type), a one-way ANOVA series was used with a multiple-comparisons post hoc test (generally Tukey's). However, if values were being compared only with the control variable, a Dunnett's post hoc test was used instead. In cases in which there were two independent variables (e.g., neuron cell death as a function of construct type and drug exposure), a two-way ANOVA series was used with a multiple-comparisons post hoc test (generally Tukey's). p < 0.05 was the absolute minimum threshold for statistical significance. Statistics were performed using GraphPad Prism software.
Figure 1.

ATFS-1 and constructs expressing modified ATFS-1 structural variants are stable and exhibit variable activities in C. elegans dopaminergic neurons. A, The ATFS-1 domain structure possesses a MTS, NIS, nuclear export signal, and a conserved bZIP domain (ZIP). Into this cDNA backbone, we introduced three mutations: ΔMTS (Δ1–32), ΔNIS (Δ391–395), and ΔZIP (L446, 453A). Furthermore, ΔMTS and either ΔNIS or ΔZIP were paired together to engineer two mutations in the same backbone. B, Animals bearing the cDNA constructs under control of a dopaminergic promoter (Pdat-1) were crossed to worm strain SJ4100 (Phsp-6:: GFP) to determine whether the varied ATFS-1 constructs are stable and to what degree they confer transcriptional activity to the neuronal compartment. Whole animal images show five representative juxtaposed animals per transgenic construct. Arrowheads indicate the absence of dopaminergic GFP accumulation. Asterisks indicate background pharyngeal GFP expression that was not scored in these assays. Arrows indicate the presence of GFP accumulation in anterior DA neurons. Scale bar, 100 μm. Neuron images provide higher-magnification views of individual images from each strain used in the quantitation of fluorescent accumulation. The dashed circle indicates the fluorescent scoring region. Scale bar, 5 μm. C, Fluorescent intensity of GFP accumulation was measured in an anatomically consistent region comprising only the anterior dopaminergic compartments at days 4 and 10 posthatching. Data are shown as the average of 20 animals, inclusive of background fluorescence subtraction of one representative stable transgenic line, with error bars indicating SD. Statistics were performed using a one-way ANOVA with a Tukey's post hoc test. NS p > 0.05, ***p < 0.001.
Results
Overexpression of active ATFS-1 cDNA constructs lead to age-dependent accumulation of abnormalities and cell death in C. elegans dopaminergic neurons
The ATFS-1 domain structure, which includes a mitochondrial import signal (MTS), a nuclear export signal, a nuclear import signal (NIS), and a bZIP transcription factor domain (ZIP) (Fig. 1A), allows for context-dependent activation of the UPRMT in C. elegans during mitochondrial stress conditions. Constitutively degraded through import into mitochondria, cytosolic levels of ATFS-1 remain very low under normal conditions. However, if mitochondrial import is disturbed and ATFS-1 is prevented from entering mitochondria, then the nuclear import signal allows for nuclear translocation to activate differential transcription and induce the UPRMT pathway (Haynes et al., 2010; Nargund et al., 2012). These changes to global transcription radically alter cellular metabolism and homeostasis to combat damage to mitochondria (Nargund et al., 2015). To understand how the function of these domains contributes to phenotypic output in C. elegans dopaminergic neurons, we first cloned the atfs-1 cDNA from N2 wild-type animals. This backbone was termed full-length ATFS-1 (ATFS-1FL). Three mutations were generated on this backbone (Fig. 1A). The first mutates the nuclear import signal (ATFS-1ΔNIS). The second mutates the conserved leucine residues in the bZIP domain (ATFS-1ΔZIP). Last, we removed the first 32 aa predicted to encode part of the mitochondrial import signal (ATFS-1ΔMTS). Two other variants were generated by combining mutations (ATFS-1ΔMTS; ΔNIS and ATFS-1ΔMTS; ΔZIP). All variants were then expressed under a dopaminergic-neuron specific promoter (Pdat-1) for use in analyzing dopaminergic neuron health in C. elegans.
To confirm that the expressed constructs were stable, functional, and had transcriptional activity, we crossed our generated lines into a transcriptional reporter for ATFS-1-dependent transcriptional activity, Phsp-6::GFP (SJ4100) (Yoneda et al., 2004; Benedetti et al., 2006; Haynes et al., 2010). If ATFS-1 were active in the dopaminergic compartment due to our expressed transgenes, then we should notice GFP accumulation in these neurons. Furthermore, we predicted that ATFS-1FL and ATFS-1ΔMTS would have high transcriptional activity, whereas other variants would have impaired transcriptional activity (20 animals were analyzed per time point using a standard measurement of one ADE soma per animal per line; data are represented as mean ± SD using a one-way ANOVA followed by Tukey's post hoc test). Under these conditions, all variants expressed a nonzero level of dopaminergic GFP accumulation at both day 4 (F(6,133) = 126.2, p ≤ 0.0001) and day 10 (F(6,133) = 126.2, p ≤ 0.0001). However, ATFS-1FL and ATFS-1ΔMTS lines generated the strongest GFP signals in dopaminergic neurons (Fig. 1B,C). Between these two constructs, ATFS-1FL and ATFS-1ΔMTS were not significantly different at day 4 (p = 0.469), but were highly different (p ≤ 0.0001) at day 10, signifying that the level of activity of ATFS-1FL likely declines over time. These data indicate that the ATFS-1ΔMTS variant possesses the highest and most consistently active transcription factor activity, whereas the ATFS-1FL variant possesses a modest and age-dependent activity. The difference in the activity of these two variants is likely due to an age-dependent increase in the negative regulation of the ATFS-1FL signal.
After confirming that the afts-1 variants were functional to the degree predicted by current understanding of ATFS-1 cellular processes, we wished to determine whether these cDNA lines alter cellular health and morphology by crossing variant lines into a transgenic C. elegans line that expresses constitutive GFP in dopaminergic neurons (Pdat-1::GFP). We monitored animals at two time points, day 7 and day 10 posthatching (data were analyzed as mean ± SEM of a population of 30 animals replicated three times per each of three transgenic lines, n = 3; in all cases, a one-way ANOVA with Tukey's post hoc test was used). Because ATFS-1 is a stress response activator that induces genes to facilitate mitochondrial function during periods of cellular insult, we originally hypothesized that ATFS-1-expressing dopaminergic neurons would not show obvious cellular changes or that these neurons would exhibit signs of cellular resilience in older aged animals. However, we discovered that animals expressing ATFS-1FL and ATFS-1ΔMTS cDNA constructs instead displayed three major dopaminergic neurodegenerative phenotypes: soma swelling, process swelling, and neuron cell death, which have been observed in other neurotoxic models such as 6-OHDA or MPTP treatment (Nass et al., 2002; Cao et al., 2005; Pu and Le, 2008). Dopaminergic soma swelling (Fig. 2A–C) was characterized by an enlarged cytosolic GFP area. At day 7, we found that both ATFS-1FL and ATFS-1ΔMTS had significantly increased presence of this phenotype over controls (F(16,14) = 109.1, p ≤ 0.0001), with the ATFS-1ΔMTS variant having significantly more soma swelling than the ATFS-1FL variant (p = 0.012). At day 10, both of these active variants retained a significant increase in soma swelling over controls (F(16,14) = 280.6, p ≤ 0.0001), but not when compared with each other (p = 0.734) due to maximal soma swelling within the animal populations. Process swelling (dendritic pearling) was observed in dopaminergic neurons expressing the ATFS-1ΔMTS mutation construct (Fig. 2D–F) on day 7 (F(6,14) = 13.12, p ≤ 0.0001) and day 10 (F(6,14) = 18.96, p ≤ 0.0001). Notably, the ATFS-1FL did not show significant process swelling at either time point (day 7, p = 0.997; day 10, p = 0.171), suggesting that the ATFS-1ΔMTS construct is more highly toxic due to lack of negative regulation. Consistent with this, ATFS-1ΔMTS variant animals displayed significant dopaminergic neuron death (Fig. 2G,H), which was assayed by counting the number of CED sensillary processes (n = 4) and ADE processes (n = 2) at both day 7 (F(6,14) = 3.685, p = 0.013) and day 10 (F(6,14) = 20.25, p ≤ 0.0001) compared with the GFP only control, whereas full-length ATFSFL variant animals did not display cell death (Fig. 2G,H) at these time points (day 7, p = 0.718; day 10, p = 0.911). In addition, the very weak, basal level of ATFS-1 activity observed in control variant mutant strains (Fig. 1C) is likely not enough to induce neurodegeneration or significant neuron abnormalities compared with GFP-only animals (in all cases, p ≥ 0.18). These data indicate that accumulation of ATFS-1 proteins in the nucleus or cytosol is not likely to be the major determinant of cellular toxicity, but rather that the high transcriptional activity of ATFS-1 is responsible for toxicity.
Figure 2.

ATFS-1 overexpression induces dopaminergic neurodegenerative phenotypes and cell death in an age-dependent manner. Animals expressing ATFS-1 variant constructs under the Pdat-1 promoter were crossed into animals that express GFP in their dopaminergic neurons (strain BY250; Pdat-1::GFP) as a means to monitor cellular health when ATFS-1 variants are overexpressed. Four neurodegenerative phenotypes were observed: Soma swelling (A–C), dendritic pearling (D–F), neuron cell death (G,H), and dopaminergic signaling reduction (I). A, B, Animals were assayed at days 7 and 10 posthatching for dopaminergic soma swelling phenotypes characterized by enlargement of the cytosolic space surrounding the nucleus of the dopaminergic neuron. Data are shown as the average of three separate transgenic lines with three replicates scored per line per construct. Error bars indicate the SEM of the average of each transgenic line. Statistics were performed using a one-way ANOVA with a Tukey's post hoc test. NS p > 0.05, *p < 0.05. C, Representative images of swollen dopaminergic neuron soma. GFP refers to BY250 (Pdat-1::GFP). Scale bar, 5 μm. D, E, Animals were assayed at days 7 and 10 posthatching for irregular dendritic swelling phenotypes (pearling) characterized by enlargement of the cytosolic space of the dendritic sensillary processes of the CEP dopaminergic neurons. Data are shown as the average of three separate transgenic lines with three replicates per line per construct. Error bars indicate the SEM of the average of each transgenic line. Statistics were performed using a one-way ANOVA with a Tukey's post hoc test. ***p < 0.001. F, Representative images of dendritic pearling in the anterior dopaminergic CEP neurons. GFP-only refers to BY250 (Pdat-1::GFP). Arrows represent irregular GFP puncta. Scale bar, 10 μm. G, H, Animals were assayed at days 7 and 10 posthatching for dopaminergic cell death, characterized by the absence of any of six anterior dopaminergic neurons in part or in whole. Data are shown as the average of three separate transgenic lines with three replicates per line per construct. Error bars indicate the SEM of the average of each transgenic line. Statistics were performed using a one-way ANOVA with a Tukey's post hoc test. *p < 0.05, ***p < 0.001. I, Animals were assayed at day 7 posthatching for basal slowing response activity by measurement of the peristaltic speed on food and off food, expressed as a ratio, and normalized to the ratio quantified for N2 control worms. Data are shown as the average of two transgenic lines using n = 10 animals per each of four replicates per construct. Error bars indicate the SEM of the average. Statistics were performed using a one-way ANOVA with a Tukey's post hoc test. NS, p > 0.05, ***p < 0.001.
Finally, we investigated whether the cell-death-inducing ATFS-1ΔMTS variant affected dopaminergic neurotransmission because of accumulated toxicity by examining a subtle behavioral phenotype associated with dopamine neuron dysfunction in C. elegans termed the BSR (Sawin et al., 2000). The BSR is a quantitative measure of mechanosensory detection of bacterial food on an agar dish, whereby normal dopaminergic response is reflected by a slowing of locomotion upon entry into food; lack of such slowing behavior is indicative of a dopaminergic deficit. Animals were analyzed at day 7 before severe neurodegenerative phenotypes were apparent (data analyzed as mean ± SEM of a population of 10 animals replicated four times per transgenic construct followed by a one-way ANOVA with a Tukey's post hoc test). We used an automated WormTracker system, which uses a motorized camera to automatically track and record the peristaltic speed of nematodes. The speed of experimental animals on and off food was measured and was then expressed as a ratio and normalized to the same ratio as wild-type (strain N2) animals. As expected, cat-2 mutant animals (positive control), which are defective for dopamine synthesis (Sulston et al., 1975), have a significantly reduced BSR compared with N2 (F(4,195) = 40.89, p ≤ 0.0001). Within this context, the ATFS-1FL and the ATFS-1ΔMTS variants (Fig. 2I) also possess defective BSR (p ≤ 0.0001), whereas worms expressing a control variant ATFS-1ΔNIS do not exhibit a significantly altered BSR (p = 0.99). This suggests that neurotoxic defects elicited by both active ATFS-1 variants are preceded by defects of dopaminergic neurotransmission. In summary, we have examined dopaminergic neuron function, morphology, and health and have discerned that ATFS-1, especially the toxic, overactive ATFS-1ΔMTS variant, induces cellular toxicity and cell death as an outcome of an overactivated UPRMT response.
ATFS-1-induced dopaminergic neuron cell death is a non-caspase-mediated necrotic event
Because aberrant ATFS-1 activity results in dopaminergic neuron cell death, we wished to determine a plausible activation mechanism. To do this, we crossed ATFS-1FL and gain-of-function ATFS-1ΔMTS into a mutation of the central caspase activation protein, CED-4 (apoptosis protease activating factor-1, Apaf-1, homolog), ced-4 (n1162), which cannot initiate apoptosis (Yuan and Horvitz, 1992; Chinnaiyan et al., 1997) to determine whether cell death proceeds in a classically apoptotic fashion (Fig. 3A,D; data were analyzed as mean ± SD of populations of 30 animals replicated 3–5 times per condition, using each transgenic line; two-way ANOVA was used to compare the interaction of the mutation with the presence of each of the ATFS-1 constructs used). We found a significant difference in the dataset when comparing transgenic overexpressed constructs with each other (GFP only vs with ATFS-1 variants; F(2,17) = 48.24, p ≤ 0.0001), but there was no significant contribution of the ced-4 mutation (F(1,17) = 0.062, p = 0.81) nor an interaction between the two factors (F(2,17) = 0.654, p = 0.53) on cell death. Furthermore, when we compared animals with ATFS-1ΔMTS and the ced-4(n1162) mutation with animals without the mutation, there was no significant difference (p = 0.81), signifying the dispensability of the central caspase pathway toward cell death initiation by the ATFS-1ΔMTS construct (Fig. 3A,D).
Figure 3.

ATFS-1-induced dopaminergic cell death is necrotic and is attenuated by rotenone though pink-1. A–C, C. elegans dopaminergic neurons expressing functional ATFS-1 structural variant constructs were crossed independently to three mutations that may affect cell death and analyzed at 10 d posthatching. Data are shown as the average of three separate transgenic lines with one to two replicates per line per construct analyzed. Error bars indicate the SD of the average of all replicates. Statistics were performed using a two-way ANOVA with a Tukey's post hoc test. NS p > 0.05, *p < 0.05, ***p < 0.001. A, ATFS-1ΔMTS and ATFS-1FL variants were crossed to a mutation of ced-4(n1162). B, ATFS-1ΔMTS and ATFS-1FL variants were crossed to a mutation of crt-1(jh101). C, ATFS-1ΔMTS and ATFS-1FL variants were crossed to a mutation of pink-1(tm1779). D, Representative images of the six anterior dopaminergic neurons scored in the analyses displayed in 3A-C. Arrows represent intact sensillary dopaminergic process of four CEP neurons and the other pair of two ADE neurons. Alterations in this count are considered positive for cell death phenotypes (as depicted with arrowheads). Asterisks in some of these images represent the ventral deirid commissure (VC); this is not scored in our assays. Scale bar, 30 μm. The selected images depicted are slightly overexposed to facilitate visualization of neuronal processes. E, Analysis of dopaminergic neurons from transgenic C. elegans expressing either Pdat-1::GFP alone or with the gain-of-function ATFS-1ΔMTS exposed to drugs that modulate mitochondrial electron transport chain function. Concentrations used were as follows: 1 μm rotenone, 1 μm antimycin, 100 μm sodium azide, 2 μm oligomycin. Sodium azide was dissolved in water; all remaining chemicals were dissolved in ethanol (final concentration 2%). Data are shown as the average of 30 worms per replicate per construct using three separate transgenic lines with one to two replicates per line per construct. Error bars indicate the SD of the average of all replicates. Statistics were performed using a two-way ANOVA with a Tukey's post hoc test. NS p > 0.05, **p < 0.01. F, ATFS-1ΔMTS variants were crossed to a mutation of pink-1(tm1779) and exposed to 1 μm rotenone then assayed for dopaminergic cell death phenotypes as in D and E. Error bars indicate the SD of the average of all replicates. Statistics were performed using a two-way ANOVA with a Tukey's post hoc test. NS p > 0.05, ***p < 0.001.
Next, we investigated whether cell death was a product of necrosis by crossing ATFS-1 variant lines into a mutant of the ER resident protein calreticulin, crt-1(ju101), (Fig. 3B,D; data analyzed as mean ± SD of populations of 30 animals replicated 3–5 times, n = 3–5, per condition using each transgenic line; two-way ANOVA was used to compare the interaction of the mutation with the presence of each of the ATFS-1 constructs used). Variants of crt-1 have been shown to lack initiation of necrosis in other models of neuronal injury in C. elegans due to impaired calcium signaling (Xu et al., 2001). Unlike with the ced-4 mutation, in a crt-1 mutant background, there was a high degree of interaction (F(2,31) = 38.16, p ≤ 0.0001) between the mutation (F(1,31) = 51.73, p ≤ 0.0001) and ATFS-1 construct (F(2,31) = 80.46, p ≤ 0.0001). This was demonstrated by a significant attenuation of dopaminergic neuron cell death in animals bearing both the crt-1 mutation and the ATFS-1ΔMTS construct compared with animals with the ATFS-1ΔMTS construct alone (p ≤ 0.0001; Fig. 3B). Notably, there was not full rescue of cell death because mutant crt-1 animals with a GFP-only background had significantly higher populations of animals without a cell death phenotype than animals with both the crt-1 mutation and the ATFS-1ΔMTS construct (p = 0.035), suggesting that other mechanisms of cell death may still be activated by ATFS-1ΔMTS. Furthermore, it should be noted that dopaminergic cell death is not observed or altered in either GFP only backgrounds or ATFS-1FL background in conjunction with a crt-1 mutant background. These results (Fig. 3A,B) suggest that the mechanism of cell death elicited by the ATFS-1 construct is non-caspase mediated and is facilitated by the action of the necrosis-associated protein calreticulin (CRT-1).
ATFS-1-induced dopaminergic neuron cell death is attenuated by rotenone through C. elegans pink-1
We next investigated whether mitophagy, as controlled by pink-1, the genetic homolog to PARK6 (Sämann et al., 2009; Palikaras et al., 2015), modulates neurodegenerative phenotypes in the presence of overactive ATFS-1 signaling. Given that the UPRMT alters mitochondrial homeostasis, it may be the case that mitophagy is detrimentally altered after UPRMT overactivation. To explore the contribution of this pathway, we first crossed active ATFS-1 variants into a mutation of pink-1(tm1779) (Fig. 3C,D), which we have shown previously to enhance neurodegeneration in αS-expressing dopaminergic neurons (Ray et al., 2014; Martinez et al., 2015; data analyzed as mean ± SD of populations of 30 animals replicated 3–5 times, n = 3–5, per condition using each transgenic line at least once; two-way ANOVA was used to compare the interaction of the mutation with the presence of each of the ATFS-1 constructs used). We found a significant difference in the dataset when comparing transgenic overexpressed constructs with each other (GFP vs ATFS-1; F(2,17) = 86.32, p ≤ 0.0001), but there was no significant contribution of the pink-1 mutation (F(1,17) = 0.51, p = 0.48) nor an interaction between the two factors (F(2,17) = 2.517, p = 0.11) on cell death. Furthermore, we did not observe alterations in dopaminergic neuron cell death in animals bearing the ATFS-1ΔMTS construct with or without the loss-of-function pink-1 background (p = 0.20; Fig. 3C). Because pink-1 loss-of-function neither attenuates nor exacerbates ATFS-1ΔMTS-induced cell death, we conclude that PINK-1-induced mitophagy acts in parallel to ATFS-1-induced neurotoxicity.
Because ATFS-1 effects a mitochondrial stress-response pathway, we wished to determine whether mitochondrial toxins can alter the rate of cell death in ATFS-1ΔMTS animal neurons. To test this, we exposed ATFS-1ΔMTS animals to sublethal dosages of four drugs that damage the ETC: rotenone (I), antimycin A (III), sodium azide (IV), and oligomycin A (V) (Shore et al., 2012) over a 10 d period after which animal neurons were analyzed for amount of cell death present within the population (sublethal chemical concentrations were determined using assays described in the Materials and Methods; data were analyzed as mean ± SD of populations of 30 animals replicated 4 times, n = 4, per condition using each transgenic line at least once; two-way ANOVA was used to compare the interaction of the drug with the presence of the dopaminergic ATFS-1ΔMTS construct on cell death). Intriguingly, not all of these drugs alter ATFS-1ΔMTS associated cell death in similar ways (Fig. 3E). For example, there is a significant interactive effect (F(1,12) = 8.74, p = 0.012) between rotenone treatment (F(1,12) = 15.38, p = 0.002) and ATFS-1ΔMTS expression (F(1,12) = 86.32, p ≤ 0.0001) on dopaminergic cell death, which results in a significant attenuation of cell death between ATFS-1ΔMTS-expressing animals in the presence or absence of rotenone (p = 0.0019). A significant interactive effect (F(1,12) = 21.40, p = 0.0006) also occurs between antimycin A presentation (F(1,12) = 15.38, p = 0.01) and ATFS-1ΔMTS expression (F(1,12) = 237.5, p ≤ 0.0001), resulting in a significant difference between the amount of dopaminergic cell death in ATFS-1ΔMTS-expressing animals in the presence or absence of antimycin (p = 0.0007). However, neither sodium azide (F(1,12) = 0.07, p = 0.79) nor oligomycin A (F(1,12) = 1.427, p = 0.30) had an interactive effect, indicating that these drugs had no impact on cell death phenotypes elicited by the dopaminergic ATFS-1ΔMTS construct.
The result that rotenone exposure could act in this context as a cellular protectant was surprising given that this drug is a common pharmacological model of dopaminergic neurodegeneration (Li et al., 2003; Coulom and Birman, 2004; Ved et al., 2005). However, a recent study found that rotenone, at low dosages, can induce an innate immune pathway that is dependent on PINK-1 activity (Chikka et al., 2016), raising the possibility that protection due to rotenone exposure may be through activation of PINK-1 or other pathways that protect and surveil mitochondria in response to stress (Liu et al., 2014). To test specifically whether PINK-1 has a significant effect on the attenuation of cell death in dopaminergic neurons expressing ATFS-1ΔMTS in the context of rotenone drug exposure, we used ATFS-1ΔMTS animals in the presence or absence of the pink-1-null mutant background and compared these with animals with or without rotenone exposure (F(3,24) = 11.4, p ≤ 0.0001, two-way ANOVA). Chiefly, we found that, whereas rotenone attenuates ATFS-1ΔMTS-induced neurodegeneration (Fig. 3F as in Figure 3E; p ≤ 0.0001), there is no attenuation in the absence of pink-1 (p = 0.98). Therefore, we conclude that rotenone treatment likely leads to the stabilization of PINK-1 to the outer mitochondrial membrane, presumably to induce mitophagy, which attenuates ATFS-1ΔMTS-induced dopaminergic cell death (Fig. 3F).
αS disease variants induce mitochondrial biogenesis, alter mitochondrial morphology, and elicit a UPRMT response
αS is a small protein and major component of neuronal inclusions termed Lewy bodies in PD pathology (Spillantini et al., 1997; Baba et al., 1998). In addition, αS mutations are associated with early-onset familial forms of PD (Li et al., 2001; Greenbaum et al., 2005). Although the precise functions of αS are still largely unknown, evidence suggests that it is likely involved in normal synaptic function of the vertebrate nervous system (Cabin et al., 2002; Burré et al., 2010). In addition, proteotoxic stress caused by αS is associated with consequences of mitochondrial dysfunction such as decreased complex I activity, increased ROS, and increased mitophagy (Hsu et al., 2000; Martin et al., 2006; Chinta et al., 2010). Given this, we investigated whether αS expression affects MQC and the UPRMT to understand how ATFS-1-induced neurotoxicity may intersect with αS.
We generated four αS variants: human wild-type (αSWT), two disease variants (αSA53T and αSA30P), and one with a deletion that disrupts the N-terminal amphipathic motif (αSΔ1–32) to determine whether any effects may be due to widespread disruption of this domain. We expressed these variants in the C. elegans intestine under the intestinal promoter Pges-1 and confirmed that all variants are expressed in C. elegans by Western blotting (data not shown). We also performed qRT-PCR on transgenic animals at day 3 posthatching. We confirmed expression of human αS in all transgenic animals, which contrasted with N2 animals, in which there is no endogenous αS (Fig. 4G). Two GFP-only reporter strains were probed for αS expression in this set of experiments (Phsp-6::GFP and Pges-1::mtGFP) and none could be detected (data not shown). The αS-expressing strains all demonstrated significant expression of the αS transcript over N2. When compared with each other, we found that construct average was not statistically different (F(3,12) = 8.243; one-way ANOVA and Dunnet's post hoc test), with the exception of αSA30P constructs, which had higher expression when compared with the human αSWT variant (p = 0.003). Whether this represents greater stability of the mRNA construct or if it is simply due to the stochastic nature of the generation of the extrachromosomal transgenic array is unknown. Therefore, we need to consider any observations of toxicity with αSA30P because of its greater average expression as a caveat to our studies.
Figure 4.
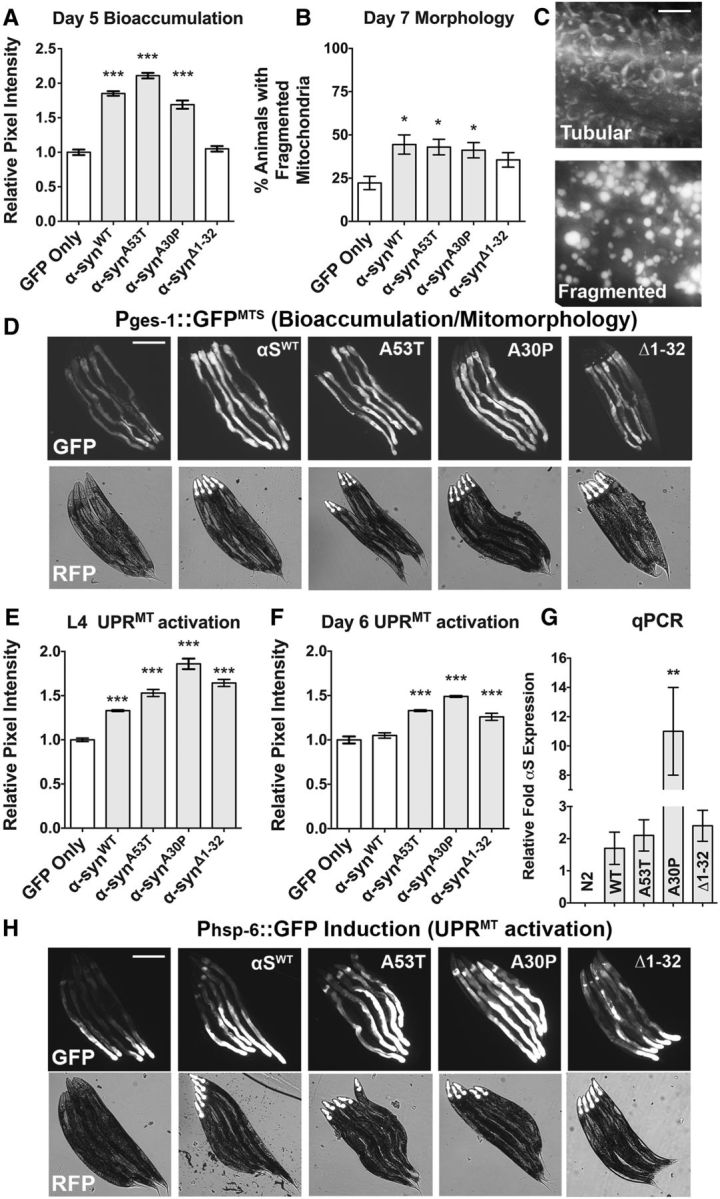
αS variants induce bioaccumulation of mitochondria, mitochondrial fragmentation, and mitochondrial stress. A, D, Bioaccumulation of mitochondria was assayed using the SJ4143 (Pges-1::GFP) animals crossed to intestinally expressing αS variants and assayed at day 5 posthatching for GFP intensity differences by imaging animals at a consistent exposure time and measuring with a standardized 80 × 80 pixel region box (∼30 × 30 μm) at the anterior-most region of the intestine. Data are shown as the average of 90 animals per line with two to three transgenic lines per construct analyzed. Values were standardized relative to the GFP-only control. Error bars indicate SEM and statistics were performed using a one-way ANOVA with a Dunnett's post hoc analysis. ***p < 0.001. B, Strains from A were also analyzed at day 7 posthatching for mitochondrial fragmentation, characterized by circularization of the mitochondrial tubular networks that exemplify normal mitochondrial morphology. Data are represented as an average of three sets of 30 animals per line and two to three transgenic lines were analyzed per construct. Error bars indicate SEM and statistical analysis was performed using a one-way ANOVA with a Dunnett's post hoc test. *p < 0.05. C, Representative images of mitochondrial morphology that can be either tubular or fragmented, as visualized using SJ4143 (Pges-1::GFPMTS) transgenic integrated line. Scale bar, 20 μm. D, Bioaccumulation of mitochondria is displayed with images of five representative, juxtaposed Pges-1::GFPMTS animals per transgenic construct. Two filters were used: GFP indicates accumulation of mitochondrial-associated GFP and RFP shows light-field worm images with a red fluorescent marker in the pharynx that indicates the animals carry a transgenic αS transgenic array (Pmyo-2::mCherry). Scale bar, 300 μm. E, F, SJ4100 (Phsp-6::GFP) animals were crossed to intestinally expressing αS variants and assayed at larval stage 4 (L4) or 6 d posthatching adults to examine UPRMT mitostress by via GFP intensity differences. Animals were imaged at consistent exposure levels and anatomical location at the anterior region of the intestine using an 80 × 80 pixel region box (∼30 × 30 μm). Data are shown as the average of 90 animals per line and two to three transgenic lines were examined per construct. Values were standardized relative to the GFP-only control. Error bars indicate SEM and statistics were performed using a one-way ANOVA with a Dunnett's post hoc. ***p < 0.001. G, Each of three transgenic lines was probed by standard qRT-PCR methods in duplicate biological samples per line. Relative fold expression of Pges-1::αSWT (as well as the other αS variants shown in the graph) was estimated using three reference genes. Data are shown as the average relative expression values of all transgenic lines in arbitrary units. N2 had no αS expression. Not shown, Phsp-6::GFP and Pges-1::GFPMTS show similar results to N2. Average expression was measured statistically using a one-way ANOVA with a Dunnett's post hoc test among transgenic lines compared with αSWT. Data are shown as average ± SEM. **p < 0.01; NS p > 0.05. H, Representative images of the data graphed in F. UPRMT mitostress is displayed as images of five representative juxtaposed animals per transgenic construct. Animals were imaged at consistent anatomical location at the anterior region of the intestine. Two filters are shown: GFP indicates mitostress (Phsp-6::GFP) and RFP shows light-field worm images with a red fluorescent marker in the pharynx indicating that the animals carry a transgenic αS transgenic array (Pmyo-2::mCherry). Scale bar, 300 μm.
We then proceeded to assess whether αS or its established disease variants have the capability to induce mitochondrial biogenesis, one aspect of mitochondrial quality control. We crossed the newly established αS strains into a mitochondrial GFP marker strain, SJ4143 (Pges-1::mtGFP), to measure GFP intensity as a product of mitochondrial accumulation (Palikaras et al., 2015). We chose the intestine of C. elegans because this is the largest organ and most obvious site of GFP induction for many reporter strains (Shore et al., 2012). We measured GFP intensity using a mitochondrial localized GFP reporter, which is a surrogate for mitochondrial bioaccumulation in αS animals (30 individual animals were analyzed for fluorescent pixel intensity in triplicate (n = 90) for each of three transgenic lines, the average of which is expressed as mean ± SEM. Each value was compared with the GFP-only control in a one-way ANOVA series with a Dunnett's post hoc test. We found that αS and its variants, with the notable exception of the αSΔ1–32 mutant, produced greater amounts of the mitochondria-localized GFP reporter in day 5 animals (Fig. 4A; F(4,445) = 128.5; αSWT, αSA53T, αSA30P, p ≤ 0.0001, and αSΔ1–32, p = 0.833). Images of these nematodes are represented as five aligned animals per panel under two filters, one to demonstrate the GFP differences and the other as a combined light-field/RFP filter to demonstrate the marker transgene (Fig. 4D).
We next translated these observations to an examination of mitochondrial morphology. Mitochondria are normally tubular, with minimal network formation and fragmentation (Fig. 4C). Therefore, alterations in this morphology are often signifiers of mitochondrial dysfunction, turnover, and stress (Youle and van der Bliek, 2012). Compared with the control (30 animals were analyzed per population in triplicate, n = 3, per each of three transgenic lines, the average of which is expressed as mean ± SEM; each value was compared with only the GFP-only control in a one-way ANOVA series with a Dunnett's post hoc test), we found a significant increase in the extent of mitochondrial fragmentation in αS variant lines, with the exception of αSΔ1–32, which was largely normal (Fig. 4B; F(4,10) = 4.0; αSWT, p = 0.02; αSA53T, p = 0.030; αSA30P, p = 0.046; yet αSΔ1–32, p = 0.184). αSWT and two PD-associated αS variants signal for an increase in mitochondrial biogenesis and signal for the alteration of mitochondrial morphology through fragmentation. One variant, the N-terminal deletion variant (αSΔ1–32), did not display a change in mitochondrial morphology nor alter mitochondrial biogenesis; therefore, the N-terminal region is likely important for signaling changes in both processes.
Given that observed increases in mitochondrial biogenesis and fragmentation may also affect mitochondrial stress, we crossed our transgenic αS variant lines to a reporter for the UPRMT, SJ4100 (Phsp-6::GFP), to extend our observations toward discerning any effects on ATFS-1-dependent transcriptional upregulation. We scored animals at two time points (L4 and day 6) and identified correlations with the UPRMT pathway (Fig. 4E,F,H; 30 individual animals were analyzed for fluorescent pixel intensity in triplicate, n = 90, per each of three transgenic lines, the average of which is expressed as mean ± SEM; each value was compared with the GFP-only control in a one-way ANOVA with a Dunnett's post hoc test). First, at the young L4 stage, αSWT, the disease associated variants (αSA53T and αSA30P) and αSΔ1–32 displayed significant increases in UPRMT activity in L4 animals, as measured by GFP pixel intensity (Fig. 4E) compared with the GFP-only control (F(4,445) = 73.02; αSWT, αSA53T, αSA30P, and αSΔ1–32, p ≤ 0.0001). Because αS is susceptible to misfolding and aggregation, especially during the aging process, we wanted to determine whether age altered the amount of UPRMT activation in response to αS expression. To test this, we examined animals at day 6 (Fig. 4F,H; using similar statistical methods as for L4) and found that the αS disease variants (αSA53T and αSA30P) and the amphipathic domain mutant αSΔ1–32induced significantly higher UPRMT activity, whereas αSWT did not significantly induce UPRMT over controls at this later time point (F(4,445) = 47.59; αSA53T, αSA30P, and αSΔ1–32, p ≤ 0.0001; yet αSWT, p = 0.5640). These observations indicate that αS is able to induce the UPRMT machinery. Furthermore, mutations in αS that alter the amphipathic domain (including the disease variants examined) appear to affect the UPRMT more strongly than the human αSWT variant, especially over the course of aging.
ATFS-1 gain-of-function conditions synergistically potentiate αS neurotoxicity independently of mitophagy disruption
Given that αSWT affects mitochondrial bioaccumulation and morphology without inducing the UPRMT pathway in older aged animals, we investigated whether overexpression of this αS variant in dopaminergic neurons would affect the dopaminergic neuronal cell death elicited by overactivation of the UPRMT pathway. Several studies have demonstrated that αS expression in C. elegans dopaminergic neurons induces age-dependent neurodegeneration that is modulated by factors that affect PD pathology. Some of these factors include vesicular trafficking, rab homeostasis, proteostasis, and MQC gene products (Cooper et al., 2006; Hamamichi et al., 2008; Kuwahara et al., 2008), as well as small molecules for which the results from our C. elegans models have translated successfully to human iPSCs (Tardiff et al., 2013). Although active ATFS-1 variants have a negative influence on neuronal health in the absence of stress, we reasoned that it was possible that active UPRMT may exert a protective effect against αSWT expression in neurons.
We first determined whether mutations in ATFS-1 modulated the amount of neurodegeneration associated with αSWT. We crossed the dopaminergic αSWT-expressing animals (Pdat-1::GFP, αSWT) into strains with mutations in ATFS-1. Specifically, these crosses were into either a loss-of-function mutant allele that has a large deletion in atfs-1(gk3094) or a gain-of-function allele that has a point mutation in the mitochondrial import signal in atfs-1(et15; Rauthan et al., 2013). Control crosses using the atfs-1 mutants (hereafter referred to as ΔGoF and ΔLoF) were also performed with a GFP-only background (30 animals were analyzed per population at least in triplicate, n = 3–4, the average of which is expressed as mean ± SD followed by a one-way ANOVA with a Tukey's post hoc test). In the GFP-only background (Fig. 5A), there were no significant differences between GFP-only animals or animals bearing either mutation of atfs-1 at either day 7 (F(2,6) = 4.00, p = 0.078) or day 10 (F(2,6) = 1.81, p = 0.243); however, in animals crossed to dopaminergic αSWT-expressing animals (Fig. 5B,C), there were significant differences in the amount of neuron cell death at both day 7 (F(2,6) = 53.41, p ≤ 0.0001) and day 10 (F(2,7) = 59.48, p ≤ 0.0001). Specifically, ΔGoF animals exacerbated dopaminergic cell death in the presence of αSWT at both day 7 (p = 0.002) and day 10 (p = 0.011), whereas ΔLoF animals significantly attenuated cell death at both day 7 (p = 0.0008) and day 10 (p = 0.0004).
Figure 5.

ATFS-1 overactivity potentiates αS toxicity synergistically and independently of mitophagic downregulation. A, Loss-of-function (LoF: gk3094) and gain-of-function (GoF: et15) atfs-1 mutants were crossed into BY250 (Pdat-1::GFP) to monitor cell death phenotypes at two age points. Data are shown as the average ± SD of three to four replicates with 30 animals per replicate. Statistics were performed using a one-way ANOVA with a Tukey's post hoc test. NS p > 0.05. B, LoF and GoF atfs-1 mutants were crossed into UA44 (Pdat-1::GFP; αSWT) to monitor cell death phenotypes at two points of aging. Data are shown as the average ± SD of 3–4 replicates, with 30 animals/replicate. Statistics were performed using a one-way ANOVA with a Tukey's post hoc test. *p < 0.05, **p < 0.01, ***p < 0.001. C, Representative anterior images of worm dopaminergic neurons. αSWT-expressing animals generally exhibit cell death (arrowheads), but the full anterior dopaminergic neuron count (6 neurons; visualized with arrows) is retained in this representative image of an αSWT; atfs-1 ΔLoF animal. Scale bar, 30 μm. D, LoF and GoF atfs-1 mutants were crossed into UA49 (Punc-54::GFP:αSWT) to monitor αS aggregation, which was assessed by aggregate size and number using an arbitrary value scale. Data are shown as the average ± SD of three to four replicates of 30 animals. Statistics were performed using a one-way ANOVA with a Tukey's post hoc test. ***p < 0.001. E, Representative Punc-54::GFP::αSWT muscle cells used in the analysis described in D. Arrows indicate GFP:: αSWT puncta. F, G, Dopaminergic cell death analysis in animals expressing Pdat-1:: αSWT and Pdat-1::GFP. The assay was performed at days 7 and 10 posthatching. Data are shown as the average of three separate transgenic lines with three to four replicates per line per construct. Error bars indicate the SEM of the average of each transgenic line. Statistics were performed using a one-way ANOVA with a Tukey's post hoc test. **p < 0.01, ***p < 0.001. H, Animals were assayed at day 5 for cell death in the presence of αSWT in the dopaminergic neurons in two strains competent for neuronal RNAi (UA196 and UA309) targeting the listed gene products. Data are shown as the average of 30 worms per replicate comprising three separate transgenic lines with two replicates per line per construct. Error bars indicate the SD of the average of each transgenic line. Statistics were performed using a two-way ANOVA series with a Tukey's post hoc test. NS p > 0.05 *p < 0.01 **p < 0.01, ***p < 0.001. I, J, ATFS-1FL and ATFS-1ΔNIS variants were crossed to a mutation of either pink-1(tm1779) or lrk-1(tm1898). Data are shown as the average of 30 worms per replicate comprising three separate transgenic lines with two replicates per line per construct. Error bars indicate the SD of the average of each transgenic line. Statistics were performed using a two-way ANOVA with a Tukey's post hoc test. **p < 0.01, ***p < 0.001.
To determine whether the protective nature against αS of loss-of-function ATFS-1 is translatable to proteostasis alterations, we next crossed ΔGoF and ΔLoF mutations into a strain expressing a translational fusion of the aggregation-prone αS to GFP in C. elegans body wall muscle cells to monitor the formation of misfolded proteins (Hamamichi et al., 2008; Fig. 5D,E); 30 individual animals were scored at least in triplicate (n = 30) per genetic condition, the average of which is expressed as mean ± SEM followed by a one-way ANOVA with a Tukey's post hoc test. Consistent with a method of proteostatic rescue, ΔLoF strongly suppressed both the size (F(2,87) = 82.33, p ≤ 0.0001) and number (F(2,87) = 83.03, p ≤ 0.0001) of observable misfolded proteins (Fig. 5D,E). Intriguingly, atfs-1(ΔGoF) did not correspondingly increase over controls either size (p = 0.960) or number (p = 0.123) of apparent misfolded proteins, either because proteostasis alteration is not a mechanism of toxicity associated with this strain or because the aggregation level is already maximally potentiated.
Given that we have shown that atfs-1 cDNA overexpression constructs are toxic to worm dopaminergic neurons (Fig. 2), the finding that atfs-1(ΔLoF) mutation could attenuate neurodegeneration caused by αS and bolster proteostasis against αS::GFP misfolded proteins was not surprising. However, not observing cell death as characteristic of the atfs-1(ΔGoF) allele in the absence of αS, but correspondingly finding that the atfs-1(ΔGoF) allele can potentiate αS neurotoxicity may imply that the genomic gain-of-function atfs-1 gene dosage is not high enough to elicit neuron cell death per se, but that it can potentiate threshold or metastable toxicity states, such as those associated with αS expression. To further test this idea, we wished to determine whether our observations with these ATFS-1 genetic mutants in αSWT dopaminergic neurons functionally correlates to cDNA expression of low dosage ATFS-1FL variants that we generated previously by crossing ATFS-1 cDNA overexpression lines into the αSWT background (Fig. 5F,G; data analyzed as mean ± SEM of a population of 30 animals replicated three times per each of three transgenic lines, n = 3, followed by a one-way ANOVA series with Tukey's post hoc test at day 7 and day 10). Consistent with our observations of ATFS-1 genetic mutants, ATFS-1FL and ATFS-1ΔMTS enhanced dopaminergic neurodegeneration compared with αSWT controls at days 7 (F(6,14) = 21.14; ATFS-1FL, p ≤ 0.0001, and ATFS-1ΔMTS, p ≤ 0.0001) and day 10 posthatching (F(6,14) = 26.59; ATFS-1FL, p = 0.0003, and ATFS-1ΔMTS, p ≤ 0.0001,; Fig. 5F,G). These data indicate that both high-toxicity ATFS-1ΔMTS and moderate toxicity ATFS-1FL constructs can potentiate αS neurotoxicity. Furthermore, because ATFS-1FL does not induce cell death in GFP-only animals (Fig. 2), this suggests that αS is highly susceptible to even moderate changes in ATFS-1 activity states with respect to induction of neurodegeneration.
Last, we investigated the relative contribution of PD genetics toward the enhanced dopaminergic neurodegenerative phenotype observed with ATFS-1 overexpression in the context of αSWT. In addition to the aforementioned PARK6 homolog, pink-1, the E3 ubiquitin ligase, Parkin (pdr-1 in C. elegans) also initiates mitophagy through serial ubiquitination of critical mitochondrial outer membrane proteins. In C. elegans, loss-of-function defects associated with reduced pink-1 activity can be compensated for with loss of lrk-1 function (Sämann et al., 2009). LRK-1 is the C. elegans homolog of the multifactorial LRRK2 protein that controls rab homeostasis and MAPK signaling (Sakaguchi-Nakashima et al., 2007). Considering the known functionality of these PD gene products, we first introduced the full-length ATFS-1FL variant into a strain that allows for neuronal-specific RNAi selectively in dopaminergic neurons (Harrington et al., 2012) to knock down pink-1, pdr-1, and lrk-1. Knock-down of a control gene, vps-41, encoding a lysosomal trafficking protein that is not predicted to act in the UPRMT, but, when knocked down, enhances dopaminergic neurodegeneration, was also performed (Harrington et al., 2012, Martinez et al., 2015; 30 animals were analyzed per population at least in triplicate, n = 3–4, the average of which is expressed as mean ± SD followed by a one-way ANOVA with a Dunnett's post hoc test). We found that knock-down of pink-1, pdr-1, and vps-41 induced significantly more neurodegeneration than control empty vector alone (Fig. 5H; F(4,15) = 20.33; pink-1, p = 0.0004; pdr-1, p = 0.0004; and vps41, p = 0.0002), whereas knock-down of lrk-1 did not alter αS-induced neurotoxicity significantly (p = 0.881). When we added to this background the ATFS-1FL dopaminergic expression construct (30 animals were analyzed per population in triplicate, n = 3, the average of which is expressed as mean ± SD followed by a one-way ANOVA with a Dunnett's post hoc test), we still observed significant degeneration over controls when knocking down pink-1, pdr-1, and vps-41 (F(4,10) = 20.62; pink-1, p = 0.005; pdr-1, p = 0.031; and vps41, p = 0.008). This suggests that mitophagic knock-down acts in parallel to ATFS-1FL neurotoxicity in the presence of αS. In addition, knocking down lrk-1 attenuated the enhanced αS toxicity observed (p = 0.031), opening up the possibility that lrk-1 knock-down may act antagonistically to ATFS-1FL toxicity.
To explore these observations further, we used two loss-of-function mutants, pink-1(tm1779) and lrk-1(tm1898), and tested for an interactive effect on the rate of cell death between the ATFS-1FL construct and either mutation (data analyzed as mean ± SD of populations of 30 animals replicated 6 times, n = 6, per condition using each transgenic line twice using a two-way ANOVA with a Tukey's post hoc test). In a pink-1 mutant background, we did not find a significant interaction on cell death between ATFS-1FL expression and loss of pink-1 (F(2,30) = 0.9331; p = 0.401; Fig. 5I). Furthermore, we found that ATFS-1FL induces greater neurodegeneration over αS only controls in either control or mutant background (in both cases, p ≤ 0.0001). These observations suggest that enhanced αSWT toxicity due to ATFS-1FL expression is not due to downregulation of mitophagy. Next, when we tested these ATFS-1 constructs in a lrk-1 background, we noticed a significant interaction (F(2,30) = 9.266; p = 0.0007) indicative of an attenuation of ATFS-1FL induced αS neurotoxicity by a lrk-1 mutant. There was no significant difference in neurodegeneration between αS-only controls and animals that expressed ATFS-1FL in the lrk-1 background (p = 0.99), whereas animals without a lrk-1 mutation still exhibited a significant difference (p ≤ 0.0001; Fig. 5J). A previous report showed that C. elegans lrk-1 loss-of-function compensates for pink-1 loss-of-function (Sämann et al., 2009). Given this and our findings that link PINK-1 activity with attenuation of ATFS-1 toxicity, it is possible that lrk-1 loss-of-function may promote PINK-1-dependent processes, even in the absence of pink-1, and mitigate ATFS-1-induced neurotoxicity. Overall, we found that ATFS-1 overexpression can enhance αSWT dopaminergic toxicity synergistically and independent of mitophagy downregulation.
Discussion
MQC mechanisms respond to cellular stressors to ameliorate mounting toxicity that threatens mitochondrial homeostasis. Failure of MQC mechanisms have been linked to neurodegenerative diseases such as PD (Sherer et al., 2002; Ved et al., 2005; Tatsuta and Langer, 2008; Green and Van Houten, 2011). One MQC mechanism, the UPRMT, protects cells from acute mitochondrial insult that otherwise lead to cellular or organismal death. Given this critical role, it was originally surprising to find that chronic induction of dopaminergic UPRMT leads to age-dependent neuronal toxicity and cell death. These two facets of the same pathway indicate that UPRMT induction is potentially a hormetic process: beneficial during context-specific, transient activation but detrimental during chronic activation. Prior studies have suggested that overactivation of the UPRMT has broader organismal effects that include shortened lifespan and accumulation of defective mitochondria (Bennett et al., 2014; Lin et al., 2016). However, the consequences of a dysregulated UPRMT on neuronal survival, especially within the context of a dopaminergic disease model, have not been reported previously. These observations are important because not they not only provide insight into the cryptic nature of the degenerative process of neurons, but they also caution against wielding the UPRMT as an ad hoc therapeutic strategy without more investigation into how UPRMT activation may affect already compromised neurons.
In this study, we focused on three central questions: if the UPRMT promotes cellular health and longevity of C. elegans dopaminergic neurons, if the UPRMT attenuates αS-induced neurotoxicity observed in dopaminergic neurons, and if these effects interact genetically with mitophagy disruption and PINK-1-dependent processes. As mentioned previously, contrary to our original hypothesis, we found a largely detrimental effect of constitutive UPRMT signaling in C. elegans dopaminergic neurons after overexpression and overactivation of ATFS-1 (Fig. 1). Through structural variant analysis of ATFS-1, we discovered that two active ATFS-1 variants induced selectively multiple phenotypic hallmarks of the neurodegeneration in C. elegans dopaminergic neurons (Fig. 2). By further investigating the molecular underpinnings for the degeneration, we found that cell death elicited by the ATFS-1ΔMTS was not attenuated by a ced-4 mutation in the apoptotic machinery, but rather by a necrosis regulator, crt-1 (Fig. 3A,B).
We also investigated the potential link between cell death phenotypes observed in dopaminergic neurons expressing active ATFS-1 variants and mitophagy. In C. elegans, mitophagy is primarily regulated by pink-1 (Palikaras et al., 2015). We did not find evidence that pink-1 knock-out appreciably influenced neuron cell death (Fig. 3C). Furthermore, in the absence of αS, a pink-1 mutation does not elicit cell death or neurodegenerative phenotypes, consistent with our previous findings (Ray et al., 2014). These observations suggest that mitophagy downregulation is not likely the primary method of dopaminergic cell death elicited by overactivation of ATFS-1. However, by exposing animals to rotenone, which has been shown recently to elicit a neuroprotective program (Chikka et al., 2016), we revealed an attenuation effect that was dependent on pink-1 (Fig. 3E). These observations suggest that ATFS-1ΔMTS might promote the accumulation of defective mitochondria in dopaminergic neurons (Lin et al., 2016), which in turn can induce abnormal cellular homeostasis and eventually cell death that can be counteracted by increased mitochondrial clearance via mitophagy induction. Nevertheless, the exact mechanism that relates ATFS-1 activity to cell death remains to be fully discerned. Because ATFS-1 is a transcription factor responsible for transcribing several hundred genes, including metabolic factors, RNA processing, and proteostatic regulatory genes (Nargund et al., 2012; Nargund et al., 2015), future studies will include functionally parsing the relative contribution of ATFS-1-mediated UPRMT activation targets within the context of dopaminergic neurodegeneration.
An overactive ATFS-1 dopaminergic transcriptional profile may influence the toxicity of the inherently disordered PD-linked protein αS. We found that αSWT and PD-linked disease variants induced bioaccumulation of mitochondria (Fig. 4A,D) and induced greater mitochondrial fragmentation. Although we did not examine mitophagy flux directly, there is a known relationship between this pathway and mitochondrial biogenesis in C. elegans (Palikaras et al., 2015), which raises the possibility that mitophagy might be altered in our studies in response to αS expression. It is intriguing that removal of the αS N terminus (αSΔ1–32) results in the loss of induction of mitochondrial biogenesis and mitochondrial fragmentation, yet UPRMT activation remains intact (Fig. 4). Although arguably an artificial scenario, this might represent either a temporal or physical distinction in the underlying mechanics of the mitochondrial-αS dynamic.
It was reported recently that αS interacts with TOM20, an outer mitochondrial membrane protein (Di Maio et al., 2016). However, the αS–TOM20 interactions reported were limited to specific forms of αS, including phosphorylated and oligomeric forms. The cellular consequences of this interaction included impaired protein import into the mitochondrial matrix, reduced respiration, and enhanced ROS. Normally, ∼1000 nuclear-encoded proteins are recognized by the translocase of the outer membrane receptors and are then passed through the inner membrane to the mitochondrial matrix for regulation of essential bioenergic processes (Lionaki and Tavernarakis, 2013). If these proteins are inhibited from entering the mitochondrial matrix, then mitochondrial stress can occur (Baker and Haynes, 2011). Considering that the C. elegans ATFS-1 protein is regulated differentially as a function of mitochondrial import efficiency (Nargund et al., 2012) and that TOM20 participates in regulation of mitochondrial import, it is intriguing to consider whether the αS disease variants (αSA53T and αSA30P) and αSΔ1–32 bind to TOM20 and alter import of proteins into mitochondria because these variants increased signaling for the UPRMT at both time points examined (Fig. 4E,F). In contrast, the human αSWT construct only enhanced the UPRMT at the early time point, suggesting a different mechanism of action involved in activating the UPRMT with this variant. For example, previous research has found that the αSWT construct bears an N-terminal mitochondrial targeting sequence (Devi et al., 2008) that has been found within the mitochondrial matrix (Chinta et al., 2010). Therefore, it is plausible that αSWT is imported into C. elegans mitochondria, affecting the signal for the UPRMT due to the matrix protein folding environment (Baker and Haynes, 2011; Nargund et al., 2012). Although outside the scope of this work, the relationship among αS, the mitochondrial matrix, and/or TOM20 requires further investigation.
We also investigated the influence of dopaminergic UPRMT activation on established αSWT lines for toxicity. Even though the gain-of-function ATFS-1ΔMTS variant induces neurodegenerative phenotypes in dopaminergic neurons in the absence of stress (Fig. 2), we hypothesized that it may be possible that this or the less toxic ATFS-1FL variant may interact in a protective manner against αSWT expression through indirect induction of mitochondrial homeostatic pathways such as mitophagy. Contrary to this expectation, we found that overactivation of the UPRMT largely potentiates αSWT toxicity. This was demonstrated to be synergistic in two ways. First, a gain-of-function ATFS-1 mutation that does not induce cell-death in the absence of αSWT (Fig. 5A) enhances cell death associated with expression of αSWT (Fig. 5B). This was also true of the moderate toxicity ATFS-1FL variant, which did not induce cell death independently (Fig. 2G,H), but enhanced cell death in the presence of αSWT expression (Fig. 5F). In contrast, a loss-of-function mutation in atfs-1 rescued cell death and suppressed misfolded αS protein formation significantly in C. elegans body wall muscle cells (Fig. 5D). We also found that alterations in mitophagy were not linked to the enhanced synergistic toxicity associated with ATFS-1FL + αSWT expression, thereby indicating a parallel mechanism of toxicity (Fig. 5I). Interestingly, lrk-1 loss-of-function significantly attenuates this toxic interaction (Fig. 5J). Given that lrk-1 loss-of-function has been shown previously to protect animals against mitochondrial stress in the absence of pink-1 (Sämann et al., 2009), it is possible that lrk-1 deficiency bolsters the cellular environment against ATFS-1FL expression by promoting pink-1-like signaling mechanisms. These may cause innate immune pathway alterations. For instance, lrk-1 has been shown to have a critical role in modulating ER homeostasis through stress-induced p38MAPK induction in pmk-1, a downstream target of the CaMKII gene unc-43 responsible for mediating the Nrf2-like, SKN-1 oxidative stress, and the detoxification pathway (Yuan et al., 2011; Chaudhuri et al., 2016). Furthermore, atfs-1 and pmk-1 have been shown to interact genetically during rotenone toxicity (Chikka et al., 2016). Therefore, it is possible that lrk-1 loss-of-function may alter neurodegeneration elicited by αS and ATFS-1 dopaminergic neuron expression through largely uncharacterized modulation of p38MAPK signaling and ER stress response. Therefore, the full elucidation of this pathway requires more investigation.
Together, these observations imply that a delicate balance exists to maintain proper neuronal function and viability whereby neuronal toxicity associated with αS exposes a cellular vulnerability when challenged by the dysregulation of proteostasis resulting from UPRMT overactivation. Notably, the capacity of αSWT to induce the UPRMT pathway also diminishes over time (Fig. 4E,F) compared with the PD variants, which maintain strong induction of the UPRMT pathway through the aging process in C. elegans. Exploration of the intracellular dynamics modulating the interplay among αS, the UPRMT pathway, and dopaminergic neurodegeneration is warranted with respect to disease etiology.
Footnotes
This work was funded by the National Institutes of Health to KAC (Grant NS078728) and by a Parkinson's Disease Foundation–American Parkinson Disease Association Summer Student Fellowship (Grant PDF-APDA-SFW-1666 to S.P.S.). S.P.S. was also supported by the University of Alabama College of Arts and Sciences Undergraduate Creative Activity and Research Academy. Some strains were provided by the CGC, which is funded by National Institutes of Health Office Research Infrastructure Programs (Grant P40 OD010440). We thank Laura Berkowitz, Ed Griffin, and Logan Norris for assistance and/or expert advice in the progress of this project.
The authors declare no competing financial interests.
References
- Baba M, Nakajo S, Tu PH, Tomita T, Nakaya K, Lee V, Trojanowski JQ, Iwatsubo T (1998) Aggregation of a-synuclein in Lewy bodies of sporadic Parkinson's disease and dementia with Lewy bodies. Am J Pathol 152:879–884. [PMC free article] [PubMed] [Google Scholar]
- Baker BM, Haynes CM (2011) Mitochondrial protein quality control during biogenesis and aging. Trends Biochem Sci 36:254–261. 10.1016/j.tibs.2011.01.004 [DOI] [PubMed] [Google Scholar]
- Baker MJ, Tatsuta T, Langer T (2011) Quality control of mitochondrial proteostasis. Cold Spring Harb Perspect Biol 3: pii: a007559. 10.1101/cshperspect.a007559 [DOI] [PMC free article] [PubMed] [Google Scholar]
- Benedetti C, Haynes CM, Yang Y, Harding HP, Ron D (2006) Ubiquitin-like protein 5 positively regulates chaperone gene expression in the mitochondrial unfolded protein response. Genetics 174:229–239. 10.1534/genetics.106.061580 [DOI] [PMC free article] [PubMed] [Google Scholar]
- Bennett CF, Vander Wende H, Simko M, Klum S, Barfield S, Choi H, Pineda VV, Kaeberlein M (2014) Activation of the mitochondrial unfolded protein response does not predict longevity in Caenorhabditis elegans. Nat Commun 5:3483. 10.1038/ncomms4483 [DOI] [PMC free article] [PubMed] [Google Scholar]
- Brenner S. (1974) The genetics of Caenorhabditis elegans. Genetics 77:71–94. [DOI] [PMC free article] [PubMed] [Google Scholar]
- Burré J, Sharma M, Tsetsenis T, Buchman V, Etherton MR, Südhof TC (2010) α-Synuclein promotes SNARE-complex assembly in vivo and in vitro. Science 329:1663–1667. 10.1126/science.1195227 [DOI] [PMC free article] [PubMed] [Google Scholar]
- Cabin DE, Shimazu K, Murphy D, Cole NB, Gottschalk W, McIlwain KL, Orrison B, Chen A, Ellis CE, Paylor R, Lu B, Nussbaum RL (2002) Synaptic vesicle depletion correlates with attenuated synaptic responses to prolonged repetitive stimulation in mice lacking α-synuclein. J Neurosci 22:8797–8807. [DOI] [PMC free article] [PubMed] [Google Scholar]
- Cao S, Gelwix CC, Caldwell KA, Caldwell GA (2005) Torsin-mediated protection from cellular stress in the dopaminergic neurons of Caenorhabditis elegans. J Neurosci 25:3801–3812. 10.1523/JNEUROSCI.5157-04.2005 [DOI] [PMC free article] [PubMed] [Google Scholar]
- Chaudhuri J, Bose N, Gong J, Hall D, Rifkind A, Bhaumik D, Peiris TH, Chamoli M, Le CH, Liu J, Lithgow GJ, Ramanathan A, Xu XZ, Kapahi P (2016) A Caenorhabditis elegans model elucidates a conserved role for TRPA1-Nrf signaling in reactive α-dicarbonyl detoxification. Curr Biol 26:3014–3025. 10.1016/j.cub.2016.09.024 [DOI] [PMC free article] [PubMed] [Google Scholar]
- Chikka MR, Anbalagan C, Dvorak K, Dombeck K, Prahlad V (2016) The mitochondria-regulated immune pathway activated in the C. elegans intestine is neuroprotective. Cell Rep 16:2399–2414. 10.1016/j.celrep.2016.07.077 [DOI] [PMC free article] [PubMed] [Google Scholar]
- Chinnaiyan AM, O'Rourke K, Lane BR, Dixit VM (1997) Interaction of CED-4 with CED-3 and CED-9: a molecular framework for cell death. Science 275:1122–1126. 10.1126/science.275.5303.1122 [DOI] [PubMed] [Google Scholar]
- Chinta SJ, Mallajosyula JK, Rane A, Andersen JK (2010) Mitochondrial alpha-synuclein accumulation impairs complex I function in dopaminergic neurons and results in increased mitophagy in vivo. Neurosci Lett 486:235–239. 10.1016/j.neulet.2010.09.061 [DOI] [PMC free article] [PubMed] [Google Scholar]
- Chu CT. (2010) A pivotal role for PINK1 and autophagy in mitochondrial quality control: implications for Parkinson disease. Hum Mol Genet 19:R28–R37. 10.1093/hmg/ddq143 [DOI] [PMC free article] [PubMed] [Google Scholar]
- Cooper AA, Gitler AD, Cashikar A, Haynes CM, Hill KJ, Bhullar B, Liu K, Xu K, Strathearn KE, Liu F, Cao S, Caldwell KA, Caldwell GA, Marsischky G, Kolodner RD, Labaer J, Rochet JC, Bonini NM, Lindquist S (2006) α-Synuclein blocks ER-Golgi traffic and Rab1 rescues neuron loss in Parkinson's models. Science 313:324–328. 10.1126/science.1129462 [DOI] [PMC free article] [PubMed] [Google Scholar]
- Coulom H, Birman S (2004) Chronic exposure to rotenone models sporadic Parkinson's disease in Drosophila melanogaster. J Neurosci 24:10993–10998. 10.1523/JNEUROSCI.2993-04.2004 [DOI] [PMC free article] [PubMed] [Google Scholar]
- Devi L, Raghavendran V, Prabhu BM, Avadhani NG, Anandatheerthavarada HK (2008) Mitochondrial import and accumulation of α-synuclein impair complex I in human dopaminergic neuronal cultures and Parkinson disease brain. J Biol Chem 283:9089–9100. 10.1074/jbc.M710012200 [DOI] [PMC free article] [PubMed] [Google Scholar]
- Di Maio R, Barrett PJ, Hoffman EK, Barrett CW, Zharikov A, Borah A, Hu X, McCoy J, Chu CT, Burton EA, Hastings TG, Greenamyre JT (2016) α-Synuclein binds to TOM20 and inhibits mitochondrial protein import in Parkinson's disease. Sci Transl Med 8:342ra78. 10.1126/scitranslmed.aaf3634 [DOI] [PMC free article] [PubMed] [Google Scholar]
- Durieux J, Wolff S, Dillin A (2011) The cell-non-autonomous nature of electron transport chain-mediated longevity. Cell 144:79–91. 10.1016/j.cell.2010.12.016 [DOI] [PMC free article] [PubMed] [Google Scholar]
- Findley LJ. (2007) The economic impact of Parkinson's disease. Parkinsonism Relat Disord 13:S8–S12. 10.1016/j.parkreldis.2007.06.003 [DOI] [PubMed] [Google Scholar]
- Fiorese CJ, Schulz AM, Lin YF, Rosin N, Pellegrino MW, Haynes CM (2016) The transcription factor ATF5 mediates a mammalian mitochondrial UPR. Curr Biol 26:2037–2043. 10.1016/j.cub.2016.06.002 [DOI] [PMC free article] [PubMed] [Google Scholar]
- Green DR, Van Houten B (2011) Mitochondrial quality control. Cell 147:950. 10.1016/j.cell.2011.10.036 [DOI] [PMC free article] [PubMed] [Google Scholar]
- Greenbaum EA, Graves CL, Mishizen-Eberz AJ, Lupoli MA, Lynch DR, Englander SW, Axelsen PH, Giasson BI (2005) The E46K mutation in α-synuclein increases amyloid fibril formation. J Biol Chem 280:7800–7807. 10.1074/jbc.M411638200 [DOI] [PubMed] [Google Scholar]
- Hamamichi S, Rivas RN, Knight AL, Cao S, Caldwell KA, Caldwell GA (2008) Hypothesis-based RNAi screening identifies neuroprotective genes in a Parkinson's disease model. Proc Natl Acad Sci U S A 105:728–733. 10.1073/pnas.0711018105 [DOI] [PMC free article] [PubMed] [Google Scholar]
- Harrington AJ, Yacoubian TA, Slone SR, Caldwell KA, Caldwell GA (2012) Functional analysis of VPS41-mediated neuroprotection in Caenorhabditis elegans and mammalian models of Parkinson's disease. J Neurosci 32:2142–2153. 10.1523/JNEUROSCI.2606-11.2012 [DOI] [PMC free article] [PubMed] [Google Scholar]
- Haynes CM, Yang Y, Blais SP, Neubert TA, Ron D (2010) The matrix peptide exporter HAF-1 signals a mitochondrial UPR by activating the transcription factor ZC376. 7 in C. elegans. Mol Cell 37:529–540. 10.1016/j.molcel.2010.01.015 [DOI] [PMC free article] [PubMed] [Google Scholar]
- Hsu LJ, Sagara Y, Arroyo A, Rockenstein E, Sisk A, Mallory M, Wong J, Takenouchi T, Hashimoto M, Masliah E (2000) α-Synuclein promotes mitochondrial deficit and oxidative stress. Am J Pathol 157(2) 401–410. [DOI] [PMC free article] [PubMed] [Google Scholar]
- Kowal SL, Dall TM, Chakrabarti R, Storm MV, Jain A (2013) The current and projected economic burden of Parkinson's disease in the United States. Movement Disord 28:311–318. 10.1002/mds.25292 [DOI] [PubMed] [Google Scholar]
- Kuwahara T, Koyama A, Koyama S, Yoshina S, Ren CH, Kato T, Mitani S, Iwatsubo T (2008) A systematic RNAi screen reveals involvement of endocytic pathway in neuronal dysfunction in α-synuclein transgenic C. elegans. Hum Mol Genet 17:2997–3009. 10.1093/hmg/ddn198 [DOI] [PubMed] [Google Scholar]
- Lamech LT, Haynes CM (2015) The unpredictability of prolonged activation of stress response pathways. J Cell Biol 209:781–787. 10.1083/jcb.201503107 [DOI] [PMC free article] [PubMed] [Google Scholar]
- Li J, Uversky VN, Fink AL (2001) Effect of familial Parkinson's disease point mutations A30P and A53T on the structural properties, aggregation, and fibrillation of human α-synuclein. Biochemistry 40:11604–11613. 10.1021/bi010616g [DOI] [PubMed] [Google Scholar]
- Li N, Ragheb K, Lawler G, Sturgis J, Rajwa B, Melendez JA, Robinson JP (2003) Mitochondrial complex I inhibitor rotenone induces apoptosis through enhancing mitochondrial reactive oxygen species production. J Biol Chem 278:8516–8525. 10.1074/jbc.M210432200 [DOI] [PubMed] [Google Scholar]
- Lin YF, Schulz AM, Pellegrino MW, Lu Y, Shaham S, Haynes CM (2016) Maintenance and propagation of a deleterious mitochondrial genome by the mitochondrial unfolded protein response. Nature 533:416–419. 10.1038/nature17989 [DOI] [PMC free article] [PubMed] [Google Scholar]
- Lionaki E, Tavernarakis N (2013) Oxidative stress and mitochondrial protein quality control in aging. J Proteomics 92:181–194. 10.1016/j.jprot.2013.03.022 [DOI] [PubMed] [Google Scholar]
- Liu Y, Samuel BS, Breen PC, Ruvkun G (2014) Caenorhabditis elegans pathways that surveil and defend mitochondria. Nature 508:406–410. 10.1038/nature13204 [DOI] [PMC free article] [PubMed] [Google Scholar]
- Martin LJ, Pan Y, Price AC, Sterling W, Copeland NG, Jenkins NA, Price DL, Lee MK (2006) Parkinson's disease α-synuclein transgenic mice develop neuronal mitochondrial degeneration and cell death. J Neurosci 26:41–50. 10.1523/JNEUROSCI.4308-05.2006 [DOI] [PMC free article] [PubMed] [Google Scholar]
- Martinez BA, Kim H, Ray A, Caldwell GA, Caldwell KA (2015) A bacterial metabolite induces glutathione-tractable proteostatic damage, proteasomal disturbances, and PINK1-dependent autophagy in C. elegans. Cell Death Dis 6:e1908. 10.1038/cddis.2015.270 [DOI] [PMC free article] [PubMed] [Google Scholar]
- Morimoto RI, Cuervo AM (2014) Proteostasis and the aging proteome in health and disease. J Gerontol A Biol Sci Med Sci 69:S33–S38. 10.1093/gerona/glu049 [DOI] [PMC free article] [PubMed] [Google Scholar]
- Nargund AM, Pellegrino MW, Fiorese CJ, Baker BM, Haynes CM (2012) Mitochondrial import efficiency of ATFS-1 regulates mitochondrial UPR activation. Science 337:587–590. 10.1126/science.1223560 [DOI] [PMC free article] [PubMed] [Google Scholar]
- Nargund AM, Fiorese CJ, Pellegrino MW, Deng P, Haynes CM (2015) Mitochondrial and nuclear accumulation of the transcription factor ATFS-1 promotes OXPHOS recovery during the UPRmt. Mol Cell 58:123–133. 10.1016/j.molcel.2015.02.008 [DOI] [PMC free article] [PubMed] [Google Scholar]
- Nass R, Hall DH, Miller DM 3rd, Blakely RD (2002) Neurotoxin-induced degeneration of dopamine neurons in Caenorhabditis elegans. Proc Natl Acad Sci U S A 99:3264–3269. 10.1073/pnas.042497999 [DOI] [PMC free article] [PubMed] [Google Scholar]
- Palikaras K, Lionaki E, Tavernarakis N (2015) Coordination of mitophagy and mitochondrial biogenesis during ageing in C. elegans. Nature 521:525–528. 10.1038/nature14300 [DOI] [PubMed] [Google Scholar]
- Papa L, Germain D (2011) Estrogen receptor mediates a distinct mitochondrial unfolded protein response. J Cell Sci 124:1396–1402. 10.1242/jcs.078220 [DOI] [PMC free article] [PubMed] [Google Scholar]
- Pellegrino MW, Nargund AM, Kirienko NV, Gillis R, Fiorese CJ, Haynes CM (2014) Mitochondrial UPR-regulated innate immunity provides resistance to pathogen infection. Nature 516:414–417. 10.1038/nature13818 [DOI] [PMC free article] [PubMed] [Google Scholar]
- Pu P, Le W (2008) Dopamine neuron degeneration induced by MPP+ is independent of CED-4 pathway in Caenorhabditis elegans. Cell Res 18:978–981. 10.1038/cr.2008.279 [DOI] [PubMed] [Google Scholar]
- Rauthan M, Ranji P, Aguilera Pradenas N, Pitot C, Pilon M (2013) The mitochondrial unfolded protein response activator ATFS-1 protects cells from inhibition of the mevalonate pathway. Proc Natl Acad Sci U S A 110:5981–5986. 10.1073/pnas.1218778110 [DOI] [PMC free article] [PubMed] [Google Scholar]
- Ray A, Martinez BA, Berkowitz LA, Caldwell GA, Caldwell KA (2014) Mitochondrial dysfunction, oxidative stress, and neurodegeneration elicited by a bacterial metabolite in a C. elegans Parkinson's model. Cell Death Dis 5:e984. 10.1038/cddis.2013.513 [DOI] [PMC free article] [PubMed] [Google Scholar]
- Runkel ED, Liu S, Baumeister R, Schulze E (2013) Surveillance-activated defenses block the ROS-induced mitochondrial unfolded protein response. PLoS Genet 9:e1003346. 10.1371/journal.pgen.1003346 [DOI] [PMC free article] [PubMed] [Google Scholar]
- Sakaguchi-Nakashima A, Meir JY, Jin Y, Matsumoto K, Hisamoto N (2007) LRK-1, a C. elegans PARK8-related kinase, regulates axonal-dendritic polarity of SV proteins. Curr Biol 17:592–598. 10.1016/j.cub.2007.01.074 [DOI] [PubMed] [Google Scholar]
- Sämann J, Hegermann J, von Gromoff E, Eimer S, Baumeister R, Schmidt E (2009) Caenorhabditits elegans LRK-1 and PINK-1 act antagonistically in stress response and neurite outgrowth. J Biol Chem 284:16482–16491. 10.1074/jbc.M808255200 [DOI] [PMC free article] [PubMed] [Google Scholar]
- Sawin ER, Ranganathan R, Horvitz HR (2000) C. elegans locomotory rate is modulated by the environment through a dopaminergic pathway and by experience through a serotonergic pathway. Neuron 26:619–631. 10.1016/S0896-6273(00)81199-X [DOI] [PubMed] [Google Scholar]
- Sherer TB, Betarbet R, Greenamyre JT (2002) Environment, mitochondria, and Parkinson's disease. Neuroscientist 8:192–197. 10.1177/1073858402008003004 [DOI] [PubMed] [Google Scholar]
- Shore DE, Carr CE, Ruvkun G (2012) Induction of cytoprotective pathways is central to the extension of lifespan conferred by multiple longevity pathways. PLoS Genet 8:e1002792. 10.1371/journal.pgen.1002792 [DOI] [PMC free article] [PubMed] [Google Scholar]
- Spillantini MG, Schmidt ML, Lee VM, Trojanowski JQ, Jakes R, Goedert M (1997) α-Synuclein in Lewy bodies. Nature 388:839–840. 10.1038/42166 [DOI] [PubMed] [Google Scholar]
- Sulston J, Dew M, Brenner S (1975) Dopaminergic neurons in the nematode Caenorhabditis elegans. J Comp Neurol 163:215–226. 10.1002/cne.901630207 [DOI] [PubMed] [Google Scholar]
- Tardiff DF, Jui NT, Khurana V, Tambe MA, Thompson ML, Chung CY, Kamadurai HB, Kim HT, Lancaster AK, Caldwell KA, Caldwell GA, Rochet JC, Buchwald SL, Lindquist S (2013) Yeast reveal a “druggable” Rsp5/Nedd4 network that ameliorates α-synuclein toxicity in neurons. Science 342:979–983. 10.1126/science.1245321 [DOI] [PMC free article] [PubMed] [Google Scholar]
- Tatsuta T, Langer T (2008) Quality control of mitochondria: protection against neurodegeneration and ageing. EMBO J 27:306–314. 10.1038/sj.emboj.7601972 [DOI] [PMC free article] [PubMed] [Google Scholar]
- Ved R, Saha S, Westlund B, Perier C, Burnam L, Sluder A, Hoener M, Rodrigues CM, Alfonso A, Steer C, Liu L, Przedborski S, Wolozin B (2005) Similar patterns of mitochondrial vulnerability and rescue induced by genetic modification of alpha-synuclein, parkin, and DJ-1 in Caenorhabditis elegans. J Biol Chem 280:42655–42668. 10.1074/jbc.M505910200 [DOI] [PMC free article] [PubMed] [Google Scholar]
- Xu K, Tavernarakis N, Driscoll M (2001) Necrotic cell death in C. elegans requires the function of calreticulin and regulators of Ca2+ release from the endoplasmic reticulum. Neuron 31:957–971. 10.1016/S0896-6273(01)00432-9 [DOI] [PubMed] [Google Scholar]
- Yoneda T, Benedetti C, Urano F, Clark SG, Harding HP, Ron D (2004) Compartment-specific perturbation of protein handling activates genes encoding mitochondrial chaperones. J Cell Sci 117:4055–4066. 10.1242/jcs.01275 [DOI] [PubMed] [Google Scholar]
- Youle RJ, van der Bliek AM (2012) Mitochondrial fission, fusion, and stress. Science 337:1062–1065. 10.1126/science.1219855 [DOI] [PMC free article] [PubMed] [Google Scholar]
- Yuan J, Horvitz HR (1992) The Caenorhabditis elegans cell death gene ced-4 encodes a novel protein and is expressed during the period of extensive programmed cell death. Development 116:309–320. [DOI] [PubMed] [Google Scholar]
- Yuan Y, Cao P, Smith MA, Kramp K, Huang Y, Hisamoto N, Matsumoto K, Hatzoglou M, Jin H, Feng Z (2011) Dysregulated LRRK2 signaling in response to endoplasmic reticulum stress leads to dopaminergic neuron degeneration in C. elegans. PLoS One 6:e22354. 10.1371/journal.pone.0022354 [DOI] [PMC free article] [PubMed] [Google Scholar]