

Abstract
The serine protease inhibitor neuroserpin regulates the activity of tissue-type plasminogen activator (tPA) in the nervous system. Neuroserpin expression is particularly prominent at late stages of neuronal development in most regions of the central nervous system (CNS), whereas it is restricted to regions related to learning and memory in the adult brain. The physiological expression pattern of neuroserpin, its high degree of colocalization with tPA within the CNS, together with its dysregulation in neuropsychiatric disorders, suggest a role in formation and refinement of synapses. In fact, studies in cell culture and mice point to a role for neuroserpin in dendritic branching, spine morphology, and modulation of behavior. In this study, we investigated the physiological role of neuroserpin in the regulation of synaptic density, synaptic plasticity, and behavior in neuroserpin-deficient mice. In the absence of neuroserpin, mice show a significant decrease in spine-synapse density in the CA1 region of the hippocampus, while expression of the key postsynaptic scaffold protein PSD-95 is increased in this region. Neuroserpin-deficient mice show decreased synaptic potentiation, as indicated by reduced long-term potentiation (LTP), whereas presynaptic paired-pulse facilitation (PPF) is unaffected. Consistent with altered synaptic plasticity, neuroserpin-deficient mice exhibit cognitive and sociability deficits in behavioral assays. However, although synaptic dysfunction is implicated in neuropsychiatric disorders, we do not detect alterations in expression of neuroserpin in fusiform gyrus of autism patients or in dorsolateral prefrontal cortex of schizophrenia patients. Our results identify neuroserpin as a modulator of synaptic plasticity, and point to a role for neuroserpin in learning and memory.
Neuroserpin is a member of the serpin family of serine protease inhibitors predominantly expressed in the nervous system (Galliciotti and Sonderegger 2006). Expression is particularly high throughout the CNS at late stages of neuronal development, during neuronal migration, axogenesis, synaptogenesis, and refinement of synaptic connections (Krueger et al. 1997). In contrast, in adults, neuroserpin expression is restricted to regions of high plasticity, where synaptic changes are associated with learning and memory (neocortex, hippocampus, amygdala, and olfactory bulb). Recently, the hypothetical role of neuroserpin in synaptic formation and plasticity has been experimentally substantiated. Overexpression of neuroserpin in primary neurons leads to increased dendritic arborization and altered dendritic spine shape (Borges et al. 2010), whereas in rat hippocampus neuroserpin overexpression results in reduced expression of postsynaptic density protein 95 (PSD-95) without impairment in hippocampal-dependent learning and memory (Tsang et al. 2014). Moreover, expression levels of N-cadherin, an adhesion protein implicated in synapse formation, are modulated by neuroserpin (Lee et al. 2008). In the visual cortex, neuroserpin expression is increased during the critical period and decreased following monocular deprivation (Wannier-Morino et al. 2003). Removal of Lynx1, a negative regulator of adult plasticity, leads to experience-dependent elevation of tPA and increased plasticity, a process blocked by administration of neuroserpin (Bukhari et al. 2015). In addition to this direct evidence linking neuroserpin to synaptic function, translational data from schizophrenic patients, a disorder characterized by improper synaptic function, showed dysregulation of neuroserpin (Hakak et al. 2001; Vawter et al. 2004; Brennand et al. 2011; Wen et al. 2014), and mice with dysregulated expression of neuroserpin show selective reduction of locomotor activity in novel environments, anxiety-like response on the O-maze, and neophobic response to novel objects (Madani et al. 2003). In this study, we demonstrate the essential role of neuroserpin in maintaining functional synapses in vivo. In the absence of neuroserpin, synaptic density, synaptic potentiation, cognitive and social functions are severely altered.
Results
Reduced spine-synapse density and elevated levels of the postsynaptic scaffold protein PSD-95 in neuroserpin-deficient mice
Overexpression of neuroserpin in cultured hippocampal neurons has previously been shown to regulate density and shape of dendritic spines (Borges et al. 2010). To evaluate neuroserpin's role in synaptic connectivity in vivo, ultrastructural analysis was performed. Only adult male mice were included in this study in order to reduce variability due to aging and gender. Using thin-sectioning electron microscopy with unbiased stereological evaluation, the number of spine-synapses was measured in the stratum radiatum of the CA1 region of Ns−/− and control littermates at 18 wk of age. Spine-synapses were distinguished from shaft-synapses and a synapse was defined by the presence of a synaptic bouton containing neurotransmitter vesicles and a postsynaptic spine with postsynaptic density, separated by a synaptic cleft (Fig. 1A). We found a significant decrease in spine-synapses in neuroserpin-deficient mice compared with wild-type (wt) littermates (total number of synapses counted: wt = 562; Ns−/− = 341; spine-synapse density: wt = 1.46/µm³ ± 0.08; Ns−/− = 0.89/µm³ ± 0.05; n = 3; P = 0.016; Fig. 1B), thereby confirming neuroserpin's role in regulating synaptic density in vivo.
Figure 1.

Reduction of spine-synapses in neuroserpin-deficient mice. (A) Electron micrographs of stratum radiatum in the CA1 region of hippocampus of neuroserpin-deficient mice and wild-type littermates at 18 wk of age. Intact spine-synapses (indicated by arrows) are characterized by postsynaptic specializations opposed to presynaptic terminals containing synaptic vesicles. Scale bars: 500 nm. (B) Stereological evaluation of spine-synapse density. Neuroserpin deficiency results in a significant decrease in spine-synapse density in the hippocampus of adult mice (mean ± SEM; n = 3; P = 0.016).
Because of the essential role of the scaffolding postsynaptic protein PSD-95 in spine stability, and since decreased expression of PSD-95, with unaltered levels of the presynaptic protein synapsin-I, have been reported in rat hippocampus following AAV-mediated neuroserpin overexpression (Tsang et al. 2014), we assessed levels of PSD-95 and of three different presynaptic marker proteins in hippocampi of adult Ns−/− mice and control littermates by Western blot analysis. Whereas PSD-95 levels were significantly increased in Ns−/− mice (wt = 1.0 ± 0.22; Ns−/− = 1.68 ± 0.37; P = 0.027) expression of synaptophysin, SNAP25 (synaptosomal-associated protein 25), and synapsin-I were not altered (synaptophysin: wt = 1.0 ± 0.13; Ns−/− = 1.18 ± 0.08; P = 0.100; SNAP25: wt = 1.0 ± 0.22; Ns−/− = 1.02 ± 0.40; P = 0.881; synapsin-I: wt = 1.0 ± 0.17; Ns−/− = 0.96 ± 0.13; P = 0.494) (Fig. 2).
Figure 2.
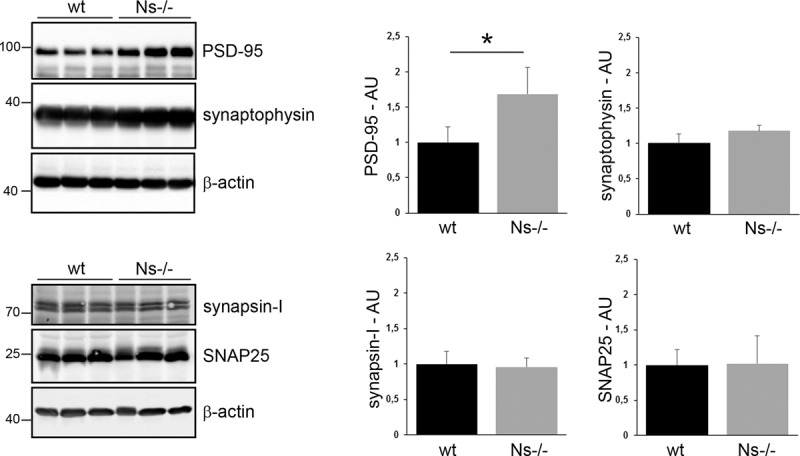
Increased expression of the synaptic protein PSD-95 in neuroserpin-deficient mice. Representative Western blots of hippocampal extracts from three different animals separated by SDS-PAGE and analyzed with antibodies against PSD-95 (postsynapse) and synaptophysin, SNAP25, and synapsin-I (presynapse). Band intensity was normalized to β-actin expression. Relative expression is presented (AU, arbitrary units), wild-type was set to 1 (mean ± SD; n = 3–4; P = 0.027 for PSD-95; P = 0.100 for synaptophysin; P = 0.881 for SNAP25; P = 0.494 for synapsin-I).
Synaptic potentiation is impaired in neuroserpin-deficient mice
The structure of dendritic spines and spine-synapses correlates with synaptic function, measurable as long-term potentiation, a cellular parameter of learning and memory (Holtmaat and Svoboda 2009). Differences in density of dendritic spines and composition of postsynaptic scaffold proteins observed in Ns−/− mice prompted us to measure LTP in Ns−/− mice and control littermates. Since high-frequency stimulation induces three phases of potentiation at CA3–CA1 synapses (for review, see Volianskis et al. 2013), we examined whether LTP induction or maintenance is affected in the absence of neuroserpin. Therefore, we analyzed three discrete phases after theta-burst stimulation (TBS): post-tetanic potentiation (0–1 min), which is N-methyl d-aspartate (NMDA) receptor-independent; LTP induction (10–20 min), corresponding to short-term potentiation, and LTP-maintenance (60–70 min), corresponding to transient LTP, both NMDA receptor-dependent (Fig. 3A). Mixed-factor ANOVA demonstrated no significant difference between all three LTP phases in wild-type or Ns−/− animals (F(1.10,11.03) = 1.6, P > 0.05). In order to compare synaptic potentiation between groups during the induction and maintenance phase of LTP, we performed one-way ANOVA analysis. We found that LTP differed significantly between neuroserpin-deficient mice and control littermates (F(3,20) = 3.4, P < 0.05). Tukey post hoc analysis revealed that the observed fEPSP slopes during LTP-maintenance phase (60 min after TBS) were reduced in Ns−/− mice compared with wild-type animals (Fig. 3B, 192.2% ± 13.4% potentiation in controls, 144.1% ± 7.6% in Ns−/− mice, P = 0.035), whereas no differences were detected in the induction phase. This points to deficits in maintenance rather than in induction of LTP in the absence of neuroserpin.
Figure 3.

Long-term potentiation at hippocampal Schaffer collaterals is reduced in neuroserpin-deficient mice. (A) Time course of TBS-induced changes in fEPSP slopes recorded from Ns−/− (gray squares) and wild-type (white squares) slices show differences in LTP between groups. (Inset) Representative traces of fEPSPs recorded before (gray) and 60 min after (red) TBS in wild-type and Ns−/− slices. (B) Mean values (n = 6 slices from three mice for wild-type and n = 7 slices from three animals for Ns−/− littermates) of the synaptic potentiation of averaged fEPSP slopes during different phases after TBS (indicated in A in red) show significant reduction in neuroserpin-deficient mice during maintenance phase only (mean ± SEM; (*) P = 0.035).
Next, since neuroserpin is transported along axons and dendrites and accumulates at presynaptic terminals (Ishigami et al. 2007; Borges et al. 2010), we focused on presynaptic mechanisms contributing to synaptic potentiation. To evaluate whether presynaptic function is changed in neuroserpin knockout mice, we examined paired-pulse facilitation by measuring fEPSP slopes in response to two stimuli delivered at various interstimulus intervals (Fig. 4A). PPF is a transient form of presynaptic plasticity in which the response to the second stimulus is increased based on residual Ca2+ in the presynaptic terminal due to the first stimulus (Katz and Miledi 1968; Manabe et al. 1993). Both wild-type and Ns−/− animals showed similar paired-pulse facilitation between 320 and 20 msec, with a clear peak in facilitation at 80-msec interstimulus interval (Fig. 4B, top). We also examined whether the deficits in LTP could be related to changes in presynaptic function by testing for PPF after LTP-inducing theta-burst stimulation, but PPF of fEPSPs was similar in both groups (Fig. 4B, bottom). These results indicate that neuroserpin is involved in postsynaptic potentiation, however, a role in presynaptic neural facilitation could not be demonstrated.
Figure 4.
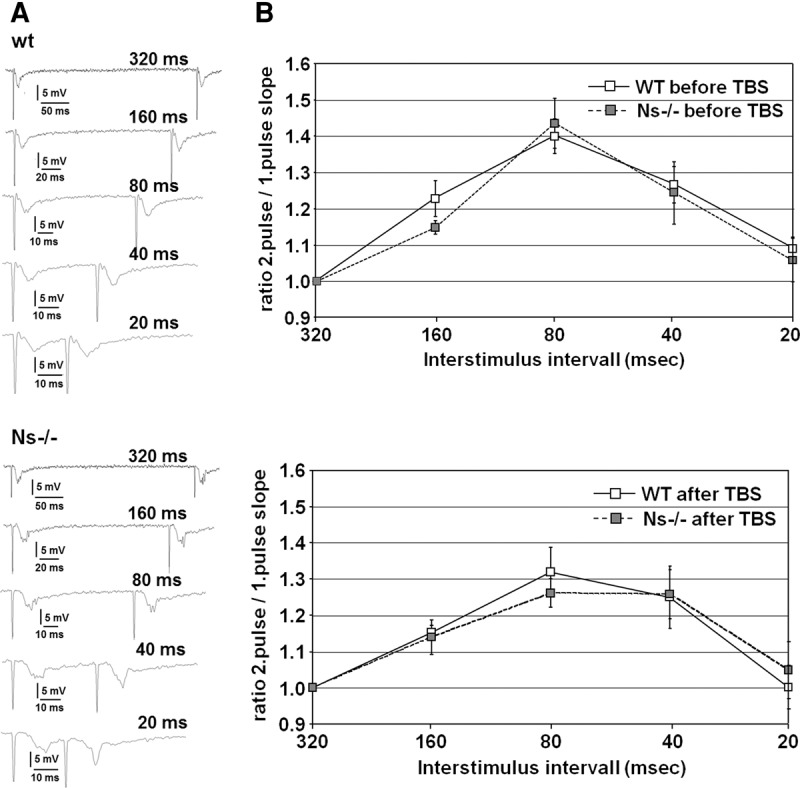
Paired-pulse facilitation is unaffected in neuroserpin-deficient mice. (A) Representative traces of wt (top) and Ns−/− (bottom) slices at different interstimulus intervals. (B) PPF was unaltered in Ns−/− mice before (top) and after (bottom) application of high frequency stimulation by theta-burst (TBS). The degree of facilitation, calculated as ratio of 2. pulse fEPSP slope to 1. pulse fEPSP slope, is shown for interstimulus intervals 320, 160, 80, 40, 20 msec (n = 6 slices from three mice for wild-type and n = 7 slices from three animals for Ns−/− littermates) (mean ± SEM).
Alterations in hippocampal-dependent behavioral tasks in the absence of neuroserpin
Given the high expression of neuroserpin in brain regions involved in cognition (e.g., hippocampus), and the morphological and functional alterations at the postsynaptic level observed in the hippocampus of Ns−/− animals, we questioned if this phenotype translates to behavioral deficits. General motor activity, novelty-induced exploration, and anxiety did not differ between Ns−/− and control mice; mice of both genotypes covered the same distances, displayed the same thigmotactic behavior in the open-field test, and performed equally in the elevated plus maze test (total number of transitions and percentage of open arms entries) (Fig. 5A–D). We then investigated whether cognitive functions were affected in Ns−/− mice. Whereas no differences were detected between genotypes in working memory (spontaneous alternation test, Fig. 5E), Ns−/− mice showed significant deficits in hippocampus-dependent cognitive function. In the water maze test for spatial learning and memory, both genotypes improved their performance throughout the learning sessions, but Ns−/− mice were not as efficient in finding the platform as control littermates as measured by distance swum to reach the platform (Fig. 5F). When long-term memory was assessed 24 h after the last learning trial, Ns−/− mice showed an enhanced mean minimal distance to platform (Fig. 5G), decreased time at the platform position (Fig. 5H) and decreased number of platform crossings compared with wild-type mice (wt = 4.5 ± 0.5; Ns−/− = 2.2 ± 0.5; P = 0.006), indicating that they were not as precise as wild-type mice in searching at the correct platform position (Fig. 5I,J). Moreover, Ns−/− mice exhibited impaired memory consolidation and/or retrieval in the contextual fear conditioning test, as indicated by the decreased time spent freezing in the conditioning context compared with control mice when tested about 1 wk after conditioning. Of note, no differences were detected between genotypes in time spent freezing during the conditioning protocol (wt = 15.3 ± 0.9; Ns−/− = 10.6 ± 1.7; t18 = 1.59; P = 0.130) or during the memory retrieval performed in the new cage, indicating that the expression of the unconditioned response and fear generalization were unaffected in Ns−/− mice (Fig. 5K). Furthermore, Ns−/− mice showed deficits in social behavior, specifically in social investigation, when given the choice between two unfamiliar stimuli presented in a familiar open field: an empty beaker (new object) and a beaker containing an unfamiliar age-matched male mouse. In contrast to wild-type mice, which spent more time investigating the unfamiliar mouse than the new object, Ns−/− mice spent equal amounts of time at both stimuli and less time investigating the unfamiliar mouse compared with wild-type littermates (Fig. 5L). Altogether, these data suggest that the absence of neuroserpin leads to memory and social impairments.
Figure 5.
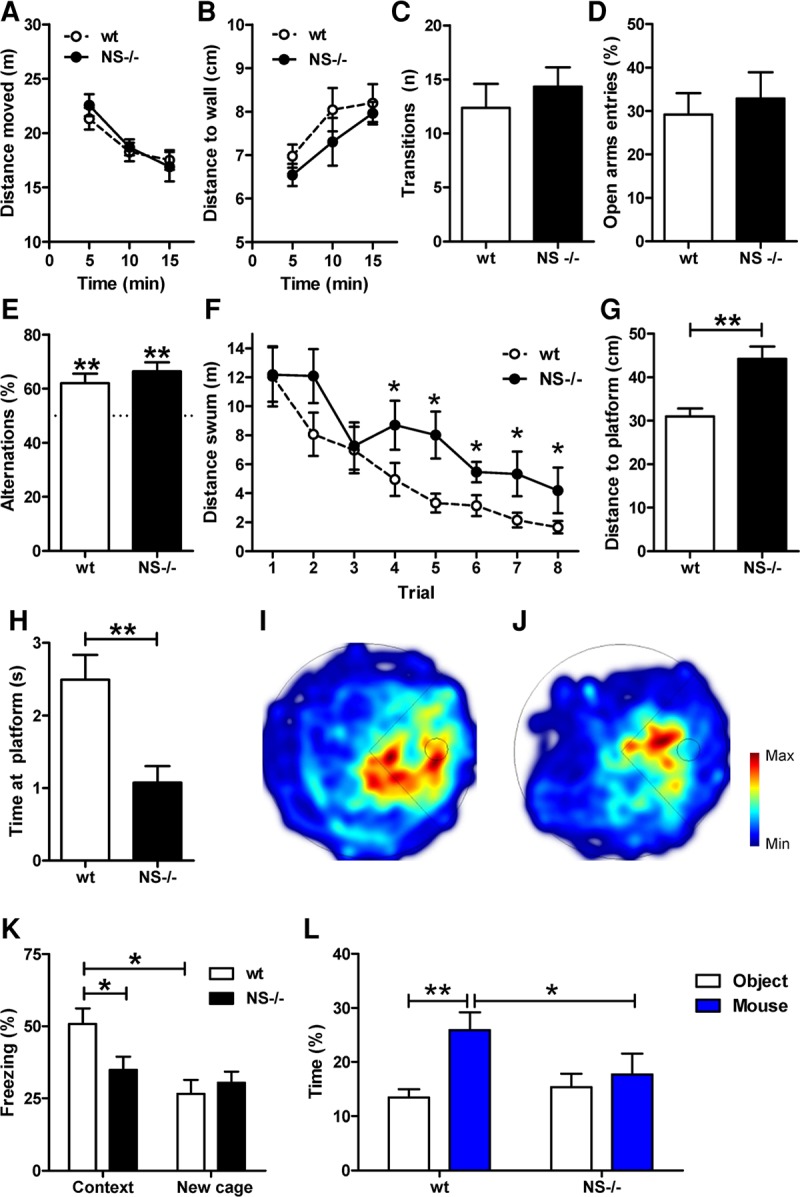
Behavioral deficits in hippocampal-dependent tasks in the absence of neuroserpin. (A–D) Novelty-induced behavior and anxiety were unaffected in Ns−/− mice as shown for distance moved (A) and distance to wall (B) in the open-field test, and for total transitions (C) and time spent on the open arms (D) in the elevated plus maze test. Open-field data are shown for time bins of 5 min. (E) In the Y-maze test, both genotypes alternated more frequently than expected by chance (50%, dotted line), indicating that working memory is preserved in Ns−/− mice. (**) P < 0.01 when compared with chance. (F–J) Impaired spatial learning and memory in Ns−/− mice in the water maze test. (F) During the learning trials Ns−/− mice swam longer distances to find the hidden platform compared with wt mice. (G) During the transfer trial Ns−/− searched further away from the platform and (H) spent less time at the platform position compared with wt littermates. (I,J) Cumulative heat maps of all tracks from wt (I) and Ns−/− mice (J) during the transfer trial. The platform position is indicated with a dotted circle in the right quadrant of the maze. (K) Ns−/− mice showed impairment in the contextual fear conditioning test. Compared with control littermates, Ns−/− mice spent less time freezing during the recall trial performed in the conditioned chamber (Context). (L) Impaired social behavior in Ns−/− mice. Ns−/− mice spent less time than wt littermates with the unfamiliar mouse (mouse, blue bars), whereas wt mice, but not Ns−/− littermates, spent more time with the unfamiliar mouse than with the unfamiliar object (object, white bars). For all panels: (*) P < 0.05, (**) P < 0.01.
Unaltered levels of neuroserpin in brains from autism and schizophrenia patients
Our analysis of neuroserpin-deficient mice, together with findings previously obtained with primary neurons overexpressing neuroserpin (Borges et al. 2010), argue for a role of neuroserpin in regulating synaptic density and plasticity. Since synaptic perturbations may represent structural correlates of neuropsychiatric disorders (Penzes et al. 2011) and dysregulated expression of neuroserpin has been found in schizophrenia (Hakak et al. 2001; Vawter et al. 2004; Brennand et al. 2011; Wen et al. 2014) we investigated neuroserpin levels in patients suffering from neuropsychiatric disorders. Neuroserpin protein levels were analyzed by quantitative Western blotting in post-mortem fusiform gyrus from subjects with idiopathic autism and controls as well as in post-mortem dorsolateral prefrontal cortex from subjects with chronic schizophrenia and control subjects with no history of psychiatric episodes. Seven anti-neuroserpin antibodies were screened on human and mouse brain extracts by Western blot. The goat polyclonal anti-neuroserpin G64A was chosen because of high specificity and low background (Supplemental Fig. S1). We did not detect significant alterations in neuroserpin expression between the groups for either condition (autism: control = 1.0 ± 0.32; patients = 0.98 ± 0.45; n = 9 for control, n = 10 for patients; P = 0.931; Fig. 6A. Schizophrenia: control = 1.0 ± 0.66; patients = 1.18 ± 0.75; n = 9 for control, n = 13 for patients; P = 0.561; Fig. 6B. Full Western blots are available as Supplemental Fig. S2).
Figure 6.
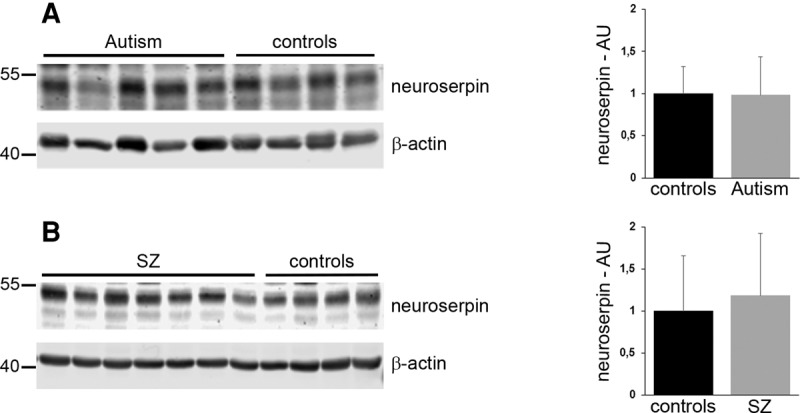
Neuroserpin expression levels are unaltered in brains of patients affected by autism and schizophrenia. Representative Western blots of extracts from (A) fusiform gyrus from five subjects with idiopathic autism and four controls and (B) dorsolateral prefrontal cortex from seven subjects with schizophrenia (SZ) and four controls. A total of 10 patients and 9 controls were tested for autism, 13 patients and 9 controls for schizophrenia. Neuroserpin band intensity was normalized to β-actin expression, and expression in control patients was set to 1 (AU, arbitrary units; mean ± SD; P = 0.931 for autism; P = 0.561 for schizophrenia).
Discussion
Although the contribution of the hippocampus to memory and cognition is well documented, the underlying mechanisms regulating these processes remain enigmatic. In this study, we provide a direct demonstration that neuroserpin plays an important role in synaptic plasticity and memory formation in the hippocampus. Morphological and biochemical analysis of brains from neuroserpin-deficient mice show decreased spine-synapse density and increased PSD-95 protein levels. These alterations are reflected by impairments of synaptic potentiation and by cognitive and social deficits. Our data support the hypothesis that in the hippocampus, neuroserpin mediates changes in synaptic signaling that may be important for appropriate social and cognitive behavioral responses. To our knowledge, this is the first report correlating neuroserpin deficiency with synaptic impairment in vivo.
Decreased spine density has been associated with altered hippocampal-dependent learning and memory in aged rats and mice as well as in Alzheimer's disease (deToledo-Morrell et al. 1988; von Bohlen und Halbach et al. 2006; Perez-Cruz et al. 2011), whereas strategies that promote spine formation correlate with memory improvement (Snigdha et al. 2016). Therefore, our results relating a decrease in spine-synapses to deficiency in synaptic potentiation and cognitive and social dysfunction in hippocampal-dependent tasks are in line with previous findings. An influence of neuroserpin on spine morphology has already been described in primary neurons, where overexpression of neuroserpin led to a shift from mushroom-type to thin spines (Borges et al. 2010). Similarly, in rat hippocampus, AAV-mediated overexpression of neuroserpin led to decreased PSD-95 expression (Tsang et al. 2014), a postsynaptic scaffold protein required for synapse stabilization and modulation of synaptic plasticity (Ehrlich et al. 2007; Cane et al. 2014). Interestingly, we found increased levels of PSD-95 protein in hippocampi from neuroserpin-deficient mice, indicating an inverse correlation between neuroserpin and PSD-95 levels. Still, it is not clear whether neuroserpin directly influences PSD-95 expression, and as a consequence stability of dendritic spines, or if it rather regulates spine morphology and consequently PSD-95 levels. In contrast to postsynaptic markers, expression of presynaptic marker proteins does not seem to depend on neuroserpin levels, as we did not observe changes in expression of the presynaptic marker proteins synaptophysin, SNAP25, or synapsin-I in hippocampi from neuroserpin-deficient mice. Similarly, Tsang et al. (2014) did not detect changes in expression of synapsin-I upon neuroserpin overexpression in adult rat hippocampi.
We analyzed hippocampal synaptic transmission in neuroserpin-deficient mice and wild-type littermates at Schaffer collateral synapses in acute hippocampal slices. Our electrophysiological data showing a clear reduction in excitatory postsynaptic potential (a form of long-term plasticity and a candidate mechanism for memory formation), provide further evidence for a synaptic function of neuroserpin (Borges et al. 2010; Tsang et al. 2014). Whether the alteration in LTP is cause or consequence of the reduced spine-synaptic density observed in neuroserpin-deficient mice needs to be further investigated. An association between spine and spine-synapse density, hippocampal LTP and memory impairments has been observed in other animal models. For instance, a single intraventricular injection of Reelin, a modulator of synaptic function implicated in several cognitive disorders including autism and schizophrenia, leads to an increase in dendritic spine density, enhanced hippocampal CA1 LTP and improved associative and spatial learning and memory, whereas lack of its receptors VLDLR and apoER2 is responsible for deficits in LTP and contextual fear conditioning (Weeber et al. 2002; Rogers et al. 2011). In contrast to this postsynaptic phenotype, our data do not indicate alterations in presynaptic PPF. Together with unaltered levels of presynaptic marker proteins synaptophysin, SNAP25 and synapsin-I in neuroserpin-deficient mice, these results argue against presynaptic effects of neuroserpin.
Locomotion and novelty-induced behavior have previously been assessed in neuroserpin-deficient mice (Madani et al. 2003). Similarly to us, Madani and colleagues did not detect any difference between genotypes in the open-field paradigm. However, in the elevated maze they reported increased avoidance to novel stimuli and, in contrast to our study, reduced novelty-induced locomotion in neuroserpin-deficient mice compared with wild-type mice. The discrepancy between these results could be due to relevant methodological differences between the two studies known to influence novelty-induced exploration in mice. In our study, we analyzed male mice caged in groups of littermates, whereas Madani et al. tested single caged male and female mice, conditions known to differentially affect mouse behavior (Bartolomucci et al. 2003; Palermo-Neto et al. 2008). Moreover, it can be assumed that the arenas used in the two studies (a circular maze with a diameter of 150 cm by Madani et al. versus the more conventional 50 cm × 50 cm maze used by us) influence the locomotion patterns of mice thereby leading to slightly different results (Eilam 2003; Grabovskaya and Salyha 2014).
Given the high expression of neuroserpin in the hippocampus, a brain region involved in cognition, dysregulated levels of neuroserpin reported in patients suffering neuropsychiatric disorders (Hakak et al. 2001; Vawter et al. 2004; Brennand et al. 2011; Wen et al. 2014), conditions characterized by altered synaptic function (Penzes et al. 2011), and the absence of reports investigating social and cognitive function in neuroserpin-deficient mice, we extended the previously reported behavioral study (Madani et al. 2003) and assessed the role of neuroserpin in cognition and mental disorders by applying multiple testing paradigms to neuroserpin-deficient mice. We found impairments in spatial learning and memory in the water maze test and in associative learning in the contextual fear conditioning test. Interestingly, rats injected with recombinant adenovirus expressing neuroserpin in the dorsal hippocampus were subjected to the same behavioral tests (Tsang et al. 2014), but no alterations were detected, suggesting that the absence of neuroserpin, but not its overexpression, alters hippocampus-dependent cognitive functions. The situation is different for the regulation of exploratory behavior and anxiety, because transgenic mice overexpressing neuroserpin in neurons under the control of the Thy1.2 promoter show similar behavioral abnormalities as do mice deficient in neuroserpin (Madani et al. 2003). In addition, we observed deficits in social behavior toward an unfamiliar male mouse in neuroserpin-deficient mice. This paradigm is indicative of social deficits characteristic of autism, a disorder characterized by social avoidance and lack of interest in social interactions (Silverman et al. 2010; Barak and Feng 2016). The alteration in social behavior observed in neuroserpin-deficient mice prompted us to investigate levels of neuroserpin protein in fusiform gyrus of autistic patients, a brain region involved in face perception tasks fundamental to sociability and hypoactive in patients with autism (Boucher and Lewis 1992; Allison et al. 1994; Gauthier et al. 1997; Schultz et al. 2000). We did not find any differences in neuroserpin expression between the patient and the control group. Moreover, since dysregulation of neuroserpin expression has been previously described in patients affected by schizophrenia (Hakak et al. 2001; Vawter et al. 2004; Brennand et al. 2011; Wen et al. 2014), we compared levels of neuroserpin between patients with schizophrenia and controls in dorsolateral prefrontal cortex, a region essential for working memory, a task shown to be impaired in schizophrenia (Goldman-Rakic 1994). Again, we did not detect any changes between schizophrenia patients and controls. This is in line with the unaltered working memory that we found in neuroserpin-deficient mice compared with wild-type controls in the spontaneous alternation test (Y-maze), but contradicts the dysregulated expression previously described in patients. There are several possible reasons for this discrepancy. We measured neuroserpin protein levels and not neuroserpin transcripts, we used brain tissue and not induced pluripotent stem cells from patients (Brennand et al. 2011; Wen et al. 2014), and the high variation in neuroserpin levels between patients of the same group found in this study may have led to false-negative significance.
Overall, this work demonstrates the decisive role of neuroserpin in regulating cognitive and social processes in the hippocampus by modeling morphological, biochemical, and functional aspects of synapses. Furthermore, these results introduce a new player in the pathogenesis of cognitive and social dysfunction and reinforce the link between synaptic dysfunction and social deficits. At the molecular level, further work is needed to explain the mechanisms of neuroserpin's contribution to synaptic plasticity.
Materials and Methods
Animals
Generation of neuroserpin-deficient mice (Ns−/−) has been previously described (Madani et al. 2003). The strain was established on a mixed 129SvEv/C57BL/6 background and backcrossed into C57BL/6J for more than 10 generations. Wild-type and knockout animals used in this study were generated from heterozygous breeding pairs. To reduce variability due to aging and gender, only male mice aged 15–25 wk were used in this study. Animal experiments were in strict accordance with the principles of laboratory animal care (NIH publication No. 86-23, revised 1985), the recommendations in the Guide for the Care and Use of Laboratory Animals of the German Animal Welfare Act on protection of animals and the ARRIVE guidelines.
Human brain tissue samples
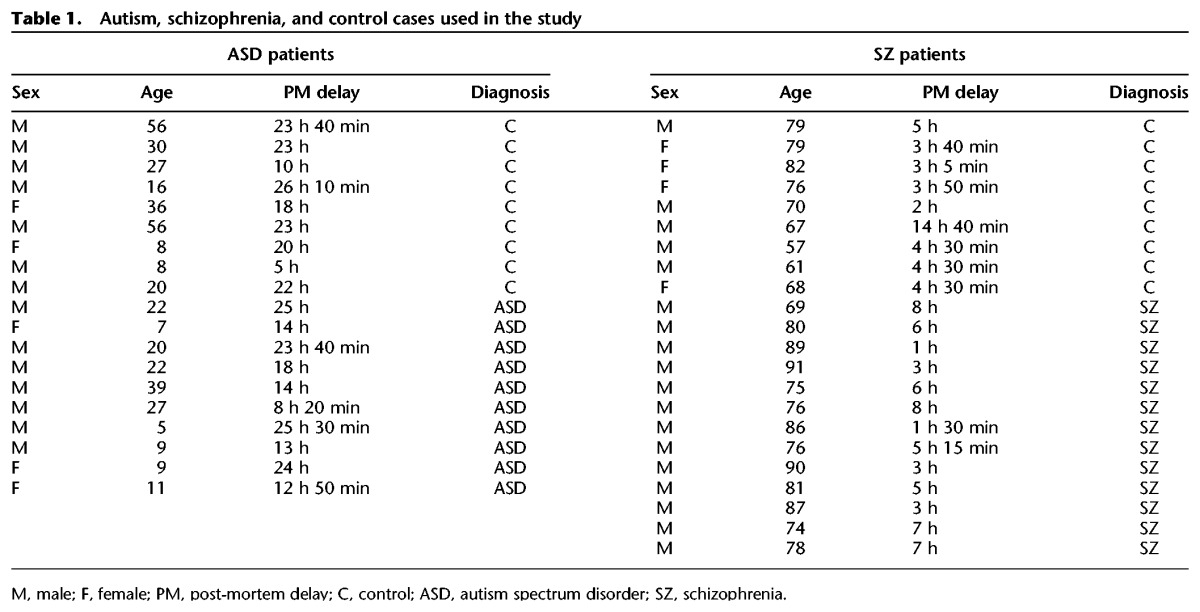
The Research Ethics Board of McMaster University as well as local and institutional ethics committees at Parc Sanitari Sant Joan de Déu approved all experimental protocols following the guidelines and legislation. The work described was carried out in accordance with The Code of Ethics of the World Medical Association (Declaration of Helsinki), and informed consent was obtained for experimentation with human subjects. Frozen samples of fusiform gyrus from subjects with idiopathic autism (n = 10, 3 females and 7 males, mean age 17.1 ± 10.8) and appropriate controls (n = 9, 2 females and 7 males, mean age 28.6 ± 18.2) were provided by Autism BrainNet, a resource of the Simons Foundation and Autism Research Initiative, now including also the Autism Speaks Autism Tissue Program (ATP) collection. The authors also acknowledge the Autism Tissue Program that was the predecessor to Autism BrainNet and provided this tissue via the Harvard Brain Tissue Resource Centre (Belmont, MA) and the National Institute of Child Health and Human Development (NICHD) Brain and Tissue Bank (University of Maryland, Baltimore, MD). Frozen samples (dorsolateral prefrontal cortex, Brodmann area 9) from subjects with schizophrenia (n = 13, all males, mean age 80.9 ± 7.0) and controls (n = 9, 5 males and 4 females, mean age 71 ± 8.6) were from Parc Sanitari Sant Joan de Déu (Roca Casasús et al. 2008) and the Institute of Neuropathology Brain Bank (HUB-ICO-IDIBELL Biobank). Samples were matched for age, gender, and post-mortem interval whenever possible. All specimens were stored at −80°C before use.
Clinical information on autism samples was obtained through the Autism Tissue Program online portal (http://www.atpportal.org) (Garcia et al. 2012; Nicolini et al. 2015). The diagnosis of autism was confirmed using the Autism Diagnostic Interview-Revised (Lord et al. 1994). With the exception of cause of death, there were no significant differences between groups for these variables (Garcia et al. 2012). Samples from patients with known genetic causes of autism spectrum and related disorders (Rett, Asperger etc.) were excluded.
The diagnosis of schizophrenia was made according to Diagnostic and Statistical Manual of Mental Disorders IV (DSM-IV) and International Classification of Diseases 10 (ICD-10) criteria. A summary of the samples from autism and schizophrenia patients is shown in Table 1. Sex aspect could not be considered because of limited human material.
Table 1.
Autism, schizophrenia, and control cases used in the study
Electron microscopy
Eighteen week-old neuroserpin-deficient mice (n = 3) and wild-type littermates (n = 3) (all male) were sacrificed and transcardially perfused with 1% glutaraldehyde and 1% paraformaldehyde in 0.1 M phosphate buffer, pH 7.4. After fixation, brains were post-fixed in 1% OsO4 for 30 min, dehydrated in graded ethanol using 1% uranyl acetate in 70% ethanol for 30 min, and embedded in Epon 820 (Serva). The blocks were trimmed to contain only stratum pyramidale and radiatum of the CA1 region. Thin sections were cut on a Reichert-Jung OmU3 ultramicrotome. Ultrathin sections were stained with uranyl acetate, followed by lead citrate. For the analysis of spine-synapse density, electron microscopy (EM) prints covering corresponding neuropil fields in pairs of consecutive serial ultrathin sections were analyzed. Photographs were taken from the proximal aspect of radiatum (the termination zone of Schaffer collateral path) at a magnification of 2600×, with the observer blinded to the sample's genotype. Areas occupied by interfering structures, such as large dendrites or blood vessels, were intentionally avoided. To obtain a comparable measure of synaptic numbers, unbiased for possible changes in synaptic size, the dissector technique was used (Sterio 1984). The density of spine-synapses of pyramidal cell dendrites was calculated with the aid of a reference grid superimposed on the EM prints. Only those spine-synapses that were present in the reference section, but not in the look-up section, were counted. The dissector volume was calculated by the distance (0.1 µm) between the reference and the look-up section. At least 10 neuropil fields were photographed on each EM grid. With at least two grids of each section (containing two pairs of consecutive, serial ultrathin sections), each animal provided at least 10 × 2 × 2 = 40 neuropil fields. Each pair of photographs (photos of reference and look-up sections) represented an 8 × 8 × 0.1 µm = 6.4 µm³ volume. For 40 photographs analyzed, this represents a volume of at least 256 µm3 per animal.
Protein extraction
Hippocampi (dissected from 15-wk-old mice, all male) were homogenized in 200 µL 20 mM Tris–HCl, pH 7.5, containing 150 mM NaCl, protease inhibitor cocktail (complete, Mini, EDTA-free, Roche) and PhosSTOP phosphatase inhibitor cocktail (Roche) using a dounce homogenizer. Proteins were solubilized by the addition of Triton X-100 to a final concentration of 1%. Extracts were cleared from insoluble material by centrifugation for 30 min at 20,000g, 4°C, and protein concentration of the supernatant was determined with Quick Start Bradford 1× Dye Reagent (BioRad Laboratories) as described by the manufacturer. Protein extraction from human brain tissue samples was performed as previously described (Garcia et al. 2012; Nicolini et al. 2015). Samples were sonicated on ice without thawing in homogenization buffer with protease inhibitor cocktail (complete, Mini, EDTA-free) and PhosSTOP phosphatase inhibitor cocktail. Homogenates were incubated on ice for 15 min and then centrifuged at 12000g for 30 min, 4°C, to precipitate insoluble debris. Protein concentrations were determined using Quick Start Bradford 1× Dye Reagent (Bio-Rad Laboratories) as described by the manufacturer.
Western blotting and densitometry
Mouse hippocampal extracts (80 µg total protein) were electrophoretically separated on 10% SDS-PAGE under reducing conditions. Proteins were transferred to nitrocellulose membranes (Bio-Rad Laboratories) and membranes were blocked for 1 h at room temperature with 5% nonfat dry milk in Tris-buffered saline containing 0.05% Tween-20 or with a 1:1 solution of phosphate-buffered saline (PBS) pH 7.4 and Odyssey Blocking Buffer (BB) (LI-COR Biosciences). Overnight incubation at 4°C of the primary antibody was followed by incubation with horseradish peroxidase-conjugated secondary antibody (1:5000) for 1 h at room temperature and visualization of the bands with SuperSignal West Pico (Pierce) and ChemiDoc XRS (Bio-Rad Laboratories). Alternatively, secondary antibodies conjugated with IRDye 800CW or IRDye 680RD (1:10,000) (LI-COR Biosciences) were incubated for 1 h at room temperature and membranes were scanned using an Odyssey Infrared Imaging System (LI-COR Biosciences). Densitometric quantification was performed with Imager Gel Doc System and Quantity One software (Bio-Rad Laboratories) (Schipanski et al. 2014) or using LI-COR Odyssey Software, version 2.0 and local background subtraction.
Human brain extracts (35 µg total protein) were electrophoretically separated on 10% SDS-PAGE under reducing conditions. Proteins were transferred to nitrocellulose membranes (Bio-Rad Laboratories) and membranes were blocked for 1 h at room temperature with a 1:1 solution of phosphate-buffered saline (PBS) pH 7.4 and Odyssey Blocking Buffer (BB) (LI-COR Biosciences). Overnight incubation at 4°C of the primary antibody in BB:PBS (1:1), 0.5% Tween-20 (PBS-T) was followed by incubation with the secondary antibodies conjugated with IRDye 800CW or IRDye 680RD (1:10000) (LI-COR Biosciences) for 1 h at room temperature. Last, the blots were scanned using an Odyssey Infrared Imaging System (LI-COR Biosciences). Band intensities were quantified by densitometry with local background subtraction using LI-COR Odyssey Software, version 2.0. Each Western blot contained a standard curve consisting of different amounts of protein per lane (from 10 to 70 µg) to allow normalization between blots and to ensure that the sample loading amount was in the linear range of detection for all targets tested. Moreover, correct identity of the neuroserpin band was guaranteed by running a hippocampal extract from a neuroserpin-deficient mouse as a negative control.
Antibodies
Generation and affinity-purification of anti-neuroserpin goat polyclonal antibody has been previously described (Galliciotti et al. 2007). Commercially available antibodies included: Anti-synaptophysin (ab32594) and anti-SNAP25 (ab41455) from Abcam, anti-synapsin-I (D12G5) from Cell Signaling Technology, anti-PSD-95 (clone EP2652Y) and anti-β-actin (clone C4) from Millipore.
Hippocampal acute slice preparation
Mice aged 21–27 wk (all male) were anesthetized with isoflurane and subsequently decapitated. The brain was removed immediately and transferred into ice-cold ACSF (artificial cerebrospinal fluid). Horizontal hippocampal slices (300 µm) were cut using a microvibratome (VT1000; Leica). Slices were kept at 37°C in continuously oxygenized ACSF containing 125 mM NaCl, 25 mM NaHCO3, 2.5 mM KCl, 1.25 mM NaH2PO4, 2 mM CaCl2, 1.5 mM MgCl2, 22.7 mM D-glucose for 30 min after slicing and remained for another 60 min during cooling to room temperature.
Electrophysiology
Acute slices were transferred to a brain slice chamber and continuously perfused with oxygenized ACSF using a peristaltic pump (2–3 mL/min). Slices were allowed to equilibrate for at least 30 min in ACSF at 29°C–32°C before electrode placement and recordings were started. In all experiments, evoked-field excitatory postsynaptic potentials (fEPSPs) were recorded extracellularly from the stratum radiatum of the CA1 area. Schaffer collaterals were stimulated concomitantly with a second glass electrode placed in the CA3 area, ∼500 µm from the recording electrode. All glass electrodes were filled with ACSF and had resistances between 2 and 4 MΩ. Stimulation, data acquisition and analysis were carried out using Pulse software in combination with an EPC-9 patch-clamp amplifier (HEKA). The synaptic responses were preamplified (gain of 10) by a Phillips PM 5170 amplifier.
LTP
At the beginning of each recording, single pulses (0.2 msec, every 2.5 sec) were used to set the stimulus strength, yielding baseline fEPSPs with an amplitude ≤50% from the fEPSP subthreshold maximum. To induce LTP, we used theta burst stimulation (TBS), a pattern consisting of eight bursts applied at 5 Hz with each burst being composed of four pulses at 100 Hz and 0.2-msec pulse duration (modified from Muller et al. 1996; Bukalo et al. 2004). Synaptic transmission was monitored every 20 sec (three consecutive data points were averaged to single time point = 1 min). After 20-min baseline recording, TBS was administered to induce LTP, and synaptic transmission was monitored continuously for a further 70 min after high frequency stimulation. The mean percentage changes of fEPSP slopes (calculated at 60–70 min post-tetanus compared with baseline average 20–0 min pretetanus) were used as a measure of LTP.
PPF
Paired-pulse facilitation, a presynaptic facilitation, was induced with two stimuli of equal intensity delivered in closely spaced, variable interstimulus intervals ranging from 320–20 msec. Facilitation was measured as a ratio of the fEPSP slope of stimulus 2 to that of the first stimulus, averaged over three responses per pulse pair.
Behavioral analyses
Husbandry and animals
Wild-type mice and Ns−/− littermates were transferred from the breeding facility into a vivarium with an inverted 12:12 light:dark cycle (light off at 8:00 a.m.) and maintained in groups of 2–4 littermates under standard housing conditions (21 ± 1°C, 40%–50% humidity, food and water ad libitum). All tests were performed during the dark cycle of the animals in a room next to the vivarium that was illuminated with dim red light. Tests started and ended at least 2 h after light offset and 3 h before light onset, respectively. The experimental material was cleaned with soap, water, and ethanol (70%) before and after each contact with an animal. To avoid a “litter effect,” no more than two animals per genotype were used from the same litter. Eleven wild-type mice and 10 Ns−/− littermates (all male, aged 16–25 wk) underwent a longitudinal study starting 3 wk after they had been accustomed to the animal facility according to the temporal order: open field, elevated-plus maze, spontaneous alternation, social behavior, water maze, and contextual fear conditioning tests. Tests were separated by at least a 2-d break. All tests were video-recorded. Tracks representing the position of the mice were created and analyzed with the software EthoVision (Noldus) as described (Freitag et al. 2003). Analysis of behavior with the software The Observer (Noldus) was performed by a trained experimenter blind to the genotype. The experimenter trained himself until he repeatedly scored at least 90% consistency between two analyses performed at different times on the same mouse, as calculated with the Reliability Test provided by the software The Observer (having 1 sec as maximal time discrepancy between two evaluations).
Open field
The open-field test was performed in a box (50 cm × 50 cm and 40 cm high) illuminated with white light (10 lux). Mice were started from one corner of the box, and their behavior was analyzed for 15 min. Distance moved, mean minimal distance to walls, time spent in the center (an imaginary 25 cm × 25 cm square in the middle of the arena) were analyzed with the software EthoVision, whereas the parameters rearing on wall (the mouse stands on the hind limbs and touches the wall with at least one forepaw) and self-grooming were analyzed by a blind observer for the first 5 min of the test using the software The Observer.
Elevated plus maze
The maze had the shape of a plus with four 30 cm long and 5 cm wide arms, connected by a squared center (5 cm × 5 cm). Two opposing arms were bordered by 15-cm high walls (closed arms), whereas the other two arms (open arms) were bordered by a 2-mm rim. The maze was elevated 75 cm from the floor and an infrared camera allowed video-recording under total darkness. The mouse was placed into the center facing one open arm and left on the maze for 5 min. The following parameters were analyzed with The Observer: entries into the open and closed arms (calculated when all four paws were on an arm), total transitions (the sum of entries into the open and closed arms), entries into the edges of the open arms (calculated when the mouse reaches with its snout the edge of an open arm), latency to enter into the open arms, latency to reach the edge of an open arm, stretch attend posture toward the open arm, rearing, self-grooming, head dips from the “protected” area (head movements over the side of an open arm with the snout pointing downwards while the mouse is still in the center or closed arm), and head dips from the “unprotected” area (head dips are done as the mouse is on the open arms).
Spontaneous alternation
Spontaneous alternation in the Y maze was performed to test for working memory performance. The maze consisted of three equally sized arms (34 cm × 5 cm and 30 cm high) made of transparent Plexiglas connected such as to make a Y and illuminated with 5 lux. Mice were placed in the center of the maze and allowed to freely explore the maze until they performed 27 transitions or after a maximal given time of 20 min. An entry into any arm with the four paws was considered as a transition. An entry into a new arm after having visited the two other arms was considered as alternation. Data were analyzed as percentage of alternations over all transitions. Average time to make a transition was calculated by dividing the duration of the test by the number of total transitions.
Social behavior
In this test, motivation to investigate a social stimulus was tested by giving the experimental mouse the choice to investigate a beaker containing an unfamiliar sex-matched mouse or an empty beaker. The apparatus consisted of a squared box (50 cm × 50 cm and 40 cm high) illuminated with white light (10 lux). Two beakers made of transparent plastic (diameter 10 cm, 15 cm high) with several holes (diameter = 1 cm) drilled at the bottom were placed at two opposite corners of the box. In one beaker an unfamiliar adult male mouse was placed. The 10-min test started by placing the experimental mouse next to the beaker with the social stimulus. Distance moved and time at the beakers was analyzed with EthoVision, whereas rearing, self-grooming, and time spent sniffing the two beakers were analyzed with The Observer.
Water maze
The water maze consisted of a circular tank (145 cm in diameter) circled by dark curtains. The water was made opaque by the addition of nontoxic white paint such that the white platform (14 cm diameter, 9 cm high, 1 cm below water surface) was not visible. Four dark landmarks (35 cm × 35 cm) placed on a white background, differing in shape and gray gradient were hung on the inner white wall of the maze. Light was provided by four white spot lights placed on the floor around the swimming pool that provided homogeneous illumination of 60 lux on the water surface. Landmarks were arranged in an asymmetric fashion, so that mice could locate the platform by using the Euclidean properties of the environment (Morellini 2013). Before the experiment started, mice were familiarized for 3 d to swim and climb onto a platform (diameter of 10 cm) placed in a small rectangular maze (42.5 cm × 26.5 cm and 15.5 cm high). During familiarization, the position of the platform was unpredictable since its location was randomized and training was performed under darkness. After familiarization, mice underwent three learning days during which they had to learn the location of a hidden platform. Starting position and position from which mice were taken out of the maze were randomized. At day 1, mice underwent four learning trials (maximum duration 90 sec, inter-trial interval of 20 min). After staying on the platform for 10 sec, mice were returned to their home cage and warmed up under red light. Day 2 consisted of five trials: trials 1, 2, 4, and 5 were learning trials, whereas trial 3 was a so-called transfer trial during which the platform was removed (short-term memory transfer trial). Day 3 consisted of one transfer trial (long-term memory transfer trial). The transfer trials had a fixed duration of 60 sec. All trials were video recorded and the position of the mice was tracked using the software EthoVision.
Contextual fear conditioning
In this test, mice had to learn the association between the unconditioned (electric footshock: 340 µA, 1 sec) and conditioned (context) stimuli. Mice were conditioned in the context, a chamber (23.5 cm × 23.5 cm and 19.5 cm high) with Plexiglas walls and ceiling and a stainless grid-floor from which an electric shock could be elicited. The chamber was illuminated by white light (10 lux). Mice were placed in the center of the cage and received three electric footshocks at 120, 160, and 200 sec. At 230 sec, the recoding ended and the mouse was immediately returned to its home cage. Mice were tested for memory retrieval in the conditioning chamber (context) and in an unfamiliar cage (new cage). The new cage consisted of a Plexiglas cage (15 cm × 25 cm and 23 cm high) with a stainless grid-floor and different landmarks placed on the external side of the walls. During the memory retrieval test, all conditions were kept the same as for the conditioning protocol, except that the mice did not receive any shock. Mice were tested for memory retention 6 and 7 d after the conditioning trial. To avoid possible bias due to the temporal order of the tests, half of the mice from each genotype were first tested in the context and then in the new cage, whereas the other half were tested first in the new cage and then in the context. The conditioned response was analyzed using infrared sensors (Mouse-E-Motion, Infra-e-motion) by quantifying the percentage of time spent freezing, i.e., no body movement besides breathing for at least one second.
Statistical analysis
Ultrastructural, electrophysiological, and behavioral data are reported as mean ± SEM. Protein band quantification from Western blots is reported as mean ± SD, differences between Ns−/− and control littermates as well as patient and control samples were calculated by Student's t-test. For LTP measurements, data were analyzed by mixed-factor ANOVA to check whether there are statistically significant differences in fEPSP slopes during various phases of LTP between wild-type and Ns−/− animals (within group factor = LTP phase, between group factor = genotype). In order to determine putative differences between induction (10–20 min after TBS) and maintenance phase (60–70 min after TBS) we examined the data by one-way ANOVA followed by Tukey post hoc test. For the behavioral analysis, data were analyzed either by Student's t-test or by mixed two-way ANOVA for repeated measurements having genotype as between group factor and time bin (for the open-field test), learning trial (for the water maze test), chamber (“Context” versus “New cage” for the contextual fear conditioning test), or stimulus (“Mouse” versus “Object” for the test for social behavior) as within group factor, followed by Newman–Keuls post hoc analyses when appropriate. For the Y-maze, the percentage of alternations of each genotype was tested against the chance value (50%) using the one-sample t-test. All tests were two-tailed. Statistical significance was set at *P < 0.05, **P < 0.01, and ***P < 0.001. The following Software was used: Statgraphics Statistical Analysis and Data Visualization Software version 5.1, GraphPad Prism version 5.0 (GraphPad Software), PulseFit 8.11 (HEKA Elektronik), Sigma Plot (SPSS), Excel (Microsoft-Office), and SPSS 18.0 (IBM).
Supplementary Material
Acknowledgments
We thank the families who donated tissue for research purposes to Autism BrainNet and Autism Tissue Program, and Parc Sanitari Sant Joan de Déu Brain Bank for providing brain tissue samples of schizophrenic cases. G.G. was supported by the Pro-Exzellenzia program and Werner-Otto-Foundation. M.G. was supported by grants from the DFG (GRK1459 and SFB877). M.F. was supported by a grant from the Ontario Mental Health Foundation.
Author contributions: G.G. conceived and coordinated the study; G.R. and M.G. contributed to the design of the study; G.G., R.V., L.Z., F.G., R.R., V.K., J.M., E.R., F.M., I.F., C.N., and M.F. performed and analyzed the experiments; G.G. and M.G. wrote the paper; R.V., L.Z., F.M., I.F., M.F., and G.R. contributed to the preparation of the paper.
Footnotes
[Supplemental material is available for this article.]
Article is online at http://www.learnmem.org/cgi/doi/10.1101/lm.045864.117.
Freely available online through the Learning & Memory Open Access option.
References
- Allison T, Ginter H, McCarthy G, Nobre AC, Puce A, Luby M, Spencer DD. 1994. Face recognition in human extrastriate cortex. J Neurophysiol 71: 821–825. [DOI] [PubMed] [Google Scholar]
- Barak B, Feng G. 2016. Neurobiology of social behavior abnormalities in autism and Williams syndrome. Nat Neurosci 19: 647–655. [DOI] [PMC free article] [PubMed] [Google Scholar]
- Bartolomucci A, Palanza P, Sacerdote P, Ceresini G, Chirieleison A, Panerai AE, Parmigiani S. 2003. Individual housing induces altered immuno-endocrine responses to psychological stress in male mice. Psychoneuroendocrinology 28: 540–558. [DOI] [PubMed] [Google Scholar]
- Borges VM, Lee TW, Christie DL, Birch NP. 2010. Neuroserpin regulates the density of dendritic protrusions and dendritic spine shape in cultured hippocampal neurons. J Neurosci Res 88: 2610–2617. [DOI] [PubMed] [Google Scholar]
- Boucher J, Lewis V. 1992. Unfamiliar face recognition in relatively able autistic children. J Child Psychol Psychiatry 33: 843–859. [DOI] [PubMed] [Google Scholar]
- Brennand KJ, Simone A, Jou J, Gelboin-Burkhart C, Tran N, Sangar S, Li Y, Mu Y, Chen G, Yu D, et al. 2011. Modelling schizophrenia using human induced pluripotent stem cells. Nature 473: 221–225. [DOI] [PMC free article] [PubMed] [Google Scholar]
- Bukalo O, Fentrop N, Lee AY, Salmen B, Law JW, Wotjak CT, Schweizer M, Dityatev A, Schachner M. 2004. Conditional ablation of the neural cell adhesion molecule reduces precision of spatial learning, long-term potentiation, and depression in the CA1 subfield of mouse hippocampus. J Neurosci 24: 1565–1577. [DOI] [PMC free article] [PubMed] [Google Scholar]
- Bukhari N, Burman PN, Hussein A, Demars MP, Sadahiro M, Brady DM, Tsirka SE, Russo SJ, Morishita H. 2015. Unmasking proteolytic activity for adult visual cortex plasticity by the removal of Lynx1. J Neurosci 35: 12693–12702. [DOI] [PMC free article] [PubMed] [Google Scholar]
- Cane M, Maco B, Knott G, Holtmaat A. 2014. The relationship between PSD-95 clustering and spine stability in vivo. J Neurosci 34: 2075–2086. [DOI] [PMC free article] [PubMed] [Google Scholar]
- deToledo-Morrell L, Geinisman Y, Morrell F. 1988. Age-dependent alterations in hippocampal synaptic plasticity: relation to memory disorders. Neurobiol Aging 9: 581–590. [DOI] [PubMed] [Google Scholar]
- Ehrlich I, Klein M, Rumpel S, Malinow R. 2007. PSD-95 is required for activity-driven synapse stabilization. Proc Natl Acad Sci 104: 4176–4181. [DOI] [PMC free article] [PubMed] [Google Scholar]
- Eilam D. 2003. Open-field behavior withstands drastic changes in arena size. Behav Brain Res 142: 53–62. [DOI] [PubMed] [Google Scholar]
- Freitag S, Schachner M, Morellini F. 2003. Behavioral alterations in mice deficient for the extracellular matrix glycoprotein tenascin-R. Behav Brain Res 145: 189–207. [DOI] [PubMed] [Google Scholar]
- Galliciotti G, Sonderegger P. 2006. Neuroserpin. Front Biosci 11: 33–45. [DOI] [PubMed] [Google Scholar]
- Galliciotti G, Glatzel M, Kinter J, Kozlov SV, Cinelli P, Rülicke T, Sonderegger P. 2007. Accumulation of mutant neuroserpin precedes development of clinical symptoms in familial encephalopathy with neuroserpin inclusion bodies. Am J Pathol 170: 1305–1313. [DOI] [PMC free article] [PubMed] [Google Scholar]
- Garcia KL, Yu G, Nicolini C, Michalski B, Garzon DJ, Chiu VS, Tongiorgi E, Szatmari P, Fahnestock M. 2012. Altered balance of proteolytic isoforms of pro-brain-derived neurotrophic factor in autism. J Neuropathol Exp Neurol 71: 289–297. [DOI] [PMC free article] [PubMed] [Google Scholar]
- Gauthier I, Anderson AW, Tarr MJ, Skudlarski P, Gore JC. 1997. Levels of categorization in visual recognition studied using functional magnetic resonance imaging. Curr Biol 7: 645–651. [DOI] [PubMed] [Google Scholar]
- Goldman-Rakic PS. 1994. Working memory dysfunction in schizophrenia. J Neuropsychiatry Clin Neurosci 6: 348–357. [DOI] [PubMed] [Google Scholar]
- Grabovskaya SV, Salyha YT. 2014. Do results of the open field test depend on the arena shape? Neurophysiology 46: 376–380. [Google Scholar]
- Hakak Y, Walker JR, Li C, Wong WH, Davis KL, Buxbaum JD, Haroutunian V, Fienberg AA. 2001. Genome-wide expression analysis reveals dysregulation of myelination-related genes in chronic schizophrenia. Proc Natl Acad Sci 98: 4746–4751. [DOI] [PMC free article] [PubMed] [Google Scholar]
- Holtmaat A, Svoboda K. 2009. Experience-dependent structural synaptic plasticity in the mammalian brain. Nat Rev Neurosci 10: 647–658. [DOI] [PubMed] [Google Scholar]
- Ishigami S, Sandkvist M, Tsui F, Moore E, Coleman TA, Lawrence DA. 2007. Identification of a novel targeting sequence for regulated secretion in the serine protease inhibitor neuroserpin. Biochem J 402: 25–34. [DOI] [PMC free article] [PubMed] [Google Scholar]
- Katz B, Miledi R. 1968. The role of calcium in neuromuscular facilitation. J Physiol 195: 481–492. [DOI] [PMC free article] [PubMed] [Google Scholar]
- Krueger SR, Ghisu GP, Cinelli P, Gschwend TP, Osterwalder T, Wolfer DP, Sonderegger P. 1997. Expression of neuroserpin, an inhibitor of tissue plasminogen activator, in the developing and adult nervous system of the mouse. J Neurosci 17: 8984–8996. [DOI] [PMC free article] [PubMed] [Google Scholar]
- Lee TW, Coates LC, Birch NP. 2008. Neuroserpin regulates N-cadherin-mediated cell adhesion independently of its activity as an inhibitor of tissue plasminogen activator. J Neurosci Res 86: 1243–1253. [DOI] [PubMed] [Google Scholar]
- Lord C, Rutter M, Le Couteur A. 1994. Autism Diagnostic Interview—Revised: a revised version of a diagnostic interview for caregivers of individuals with possible pervasive developmental disorders. J Autism Dev Disord 24: 659–685. [DOI] [PubMed] [Google Scholar]
- Madani R, Kozlov S, Akhmedov A, Cinelli P, Kinter J, Lipp HP, Sonderegger P, Wolfer DP. 2003. Impaired explorative behavior and neophobia in genetically modified mice lacking or overexpressing the extracellular serine protease inhibitor neuroserpin. Mol Cell Neurosci 23: 473–494. [DOI] [PubMed] [Google Scholar]
- Manabe T, Wyllie DJ, Perkel DJ, Nicoll RA. 1993. Modulation of synaptic transmission and long-term potentiation: effects on paired pulse facilitation and EPSC variance in the CA1 region of the hippocampus. J Neurophysiol 70: 1451–1459. [DOI] [PubMed] [Google Scholar]
- Morellini F. 2013. Spatial memory tasks in rodents: what do they model? Cell Tissue Res 354: 273–286. [DOI] [PubMed] [Google Scholar]
- Muller D, Wang C, Skibo G, Toni N, Cremer H, Calaora V, Rougon G, Kiss JZ. 1996. PSA-NCAM is required for activity-induced synaptic plasticity. Neuron 17: 413–422. [DOI] [PubMed] [Google Scholar]
- Nicolini C, Ahn Y, Michalski B, Rho JM, Fahnestock M. 2015. Decreased mTOR signaling pathway in human idiopathic autism and in rats exposed to valproic acid. Acta Neuropathol Commun 3: 3. [DOI] [PMC free article] [PubMed] [Google Scholar]
- Palermo-Neto J, Fonseca ES, Quinteiro-Filho WM, Correia CS, Sakai M. 2008. Effects of individual housing on behavior and resistance to Ehrlich tumor growth in mice. Physiol Behav 95: 435–440. [DOI] [PubMed] [Google Scholar]
- Penzes P, Cahill ME, Jones KA, VanLeeuwen JE, Woolfrey KM. 2011. Dendritic spine pathology in neuropsychiatric disorders. Nat Neurosci 14: 285–293. [DOI] [PMC free article] [PubMed] [Google Scholar]
- Perez-Cruz C, Nolte MW, van Gaalen MM, Rustay NR, Termont A, Tanghe A, Kirchhoff F, Ebert U. 2011. Reduced spine density in specific regions of CA1 pyramidal neurons in two transgenic mouse models of Alzheimer's disease. J Neurosci 31: 3926–3934. [DOI] [PMC free article] [PubMed] [Google Scholar]
- Roca Casasús M, Escanilla Casal A, Monje Hernández A, Baño Galindo V, Planchat Teruel LM, Costa Escola J, Haro Abad JM. 2008. Banco de tejidos neurológicos de Sant Joan de Déu-Serveis de Salut Mental para la investigación de las enfermedades mentales. La importancia de un programa de donación en vida. Psiquiatría Biológica 15: 73–79. [Google Scholar]
- Rogers JT, Rusiana I, Trotter J, Zhao L, Donaldson E, Pak DT, Babus LW, Peters M, Banko JL, Chavis P, et al. 2011. Reelin supplementation enhances cognitive ability, synaptic plasticity, and dendritic spine density. Learn Mem 18: 558–564. [DOI] [PMC free article] [PubMed] [Google Scholar]
- Schipanski A, Oberhauser F, Neumann M, Lange S, Szalay B, Krasemann S, van Leeuwen FW, Galliciotti G, Glatzel M. 2014. Lectin OS-9 delivers mutant neuroserpin to endoplasmic reticulum associated degradation in familial encephalopathy with neuroserpin inclusion bodies. Neurobiol Aging 35: 2394–2403. [DOI] [PubMed] [Google Scholar]
- Schultz RT, Gauthier I, Klin A, Fulbright RK, Anderson AW, Volkmar F, Skudlarski P, Lacadie C, Cohen DJ, Gore JC. 2000. Abnormal ventral temporal cortical activity during face discrimination among individuals with autism and Asperger syndrome. Arch Gen Psychiatry 57: 331–340. [DOI] [PubMed] [Google Scholar]
- Silverman JL, Yang M, Lord C, Crawley JN. 2010. Behavioural phenotyping assays for mouse models of autism. Nat Rev Neurosci 11: 490–502. [DOI] [PMC free article] [PubMed] [Google Scholar]
- Snigdha S, Prieto GA, Petrosyan A, Loertscher BM, Dieskau AP, Overman LE, Cotman CW. 2016. H3K9me3 inhibition improves memory, promotes spine formation, and increases BDNF levels in the aged hippocampus. J Neurosci 36: 3611–3622. [DOI] [PMC free article] [PubMed] [Google Scholar]
- Sterio DC. 1984. The unbiased estimation of number and sizes of arbitrary particles using the disector. J Microsc 134: 127–136. [DOI] [PubMed] [Google Scholar]
- Tsang VW, Young D, During MJ, Birch NP. 2014. AAV-mediated overexpression of neuroserpin in the hippocampus decreases PSD-95 expression but does not affect hippocampal-dependent learning and memory. PLoS One 9: e91050. [DOI] [PMC free article] [PubMed] [Google Scholar]
- Vawter MP, Shannon Weickert C, Ferran E, Matsumoto M, Overman K, Hyde TM, Weinberger DR, Bunney WE, Kleinman JE. 2004. Gene expression of metabolic enzymes and a protease inhibitor in the prefrontal cortex are decreased in schizophrenia. Neurochem Res 29: 1245–1255. [DOI] [PubMed] [Google Scholar]
- Volianskis A, Collingridge GL, Jensen MS. 2013. The roles of STP and LTP in synaptic encoding. PeerJ 1: e3. [DOI] [PMC free article] [PubMed] [Google Scholar]
- von Bohlen und Halbach O, Zacher C, Gass P, Unsicker K. 2006. Age-related alterations in hippocampal spines and deficiencies in spatial memory in mice. J Neurosci Res 83: 525–531. [DOI] [PubMed] [Google Scholar]
- Wannier-Morino P, Rager G, Sonderegger P, Grabs D. 2003. Expression of neuroserpin in the visual cortex of the mouse during the developmental critical period. Eur J Neurosci 17: 1853–1860. [DOI] [PubMed] [Google Scholar]
- Weeber EJ, Beffert U, Jones C, Christian JM, Forster E, Sweatt JD, Herz J. 2002. Reelin and ApoE receptors cooperate to enhance hippocampal synaptic plasticity and learning. J Biol Chem 277: 39944–39952. [DOI] [PubMed] [Google Scholar]
- Wen Z, Nguyen HN, Guo Z, Lalli MA, Wang X, Su Y, Kim NS, Yoon KJ, Shin J, Zhang C, et al. 2014. Synaptic dysregulation in a human iPS cell model of mental disorders. Nature 515: 414–418. [DOI] [PMC free article] [PubMed] [Google Scholar]
Associated Data
This section collects any data citations, data availability statements, or supplementary materials included in this article.