Abstract
In this methods development we present an ultra-high-field, diffusion-weighted MRI method to quantitatively assess u-fibers and use it to compare u-fiber counts in non-lesional epilepsy patients to controls. Emerging evidence implicates white matter abnormalities in non-lesional epilepsy, including the short-range, cortical-cortical connections or u-fibers. Eight patients with non-lesional epilepsy and 8 demographically matched controls underwent 7 Tesla MRI consisting of a T1-weighted sequence (0.7 mm isotropic resolution) and high-angular-resolved diffusion-weighted MRI (1.05 mm isotropic resolution, 68 directions). MRI data were used to quantify u-fiber counts in known u-fiber populations based on an atlas and fiber tractography. From tractography, connectivity matrices summarizing the u-fiber counts were computed. Quantitative group comparisons were performed on the connectivity matrices. U-fiber counts were found to be lower on average in subjects with epilepsy than in healthy controls. The results indicate that the density or number of u-fibers is reduced in patients with non-lesional epilepsy. Future work will be focused histological validation and determining whether differences in u-fiber counts can be used clinically to non-invasively identify seizure onset zones.
Keywords: Diffusion, DWI, DTI, Epilepsy, U-fibers, Connectivity
1. Introduction
The u-fiber system consists of subcortical arcuate fibers that serve as short-range association fibers that connect neighboring cortical regions. Emerging evidence from studies using magnetic resonance imaging (MRI) [1] and animal work [2] suggests that the u-fiber system may be implicated in disorders such as non-lesional epilepsy. Currently there is no method to invasively assess u-fibers, however, the orientation of the axons that comprise white matter, including u-fibers, can be inferred from diffusion-weighted MRI (dMRI).
Many dMRI-based studies are focused on metrics of anisotropy and diffusivity. For example, in the case of epilepsy, such studies have confirmed the presence of white matter pathology, which can be both widespread as well as localized near the suspected seizure onset zone [3,4,5]. Another approach to analyzing dMRI data uses fiber tractography to estimate the locations and orientations of white matter fibers. A study of tractography in children with left temporal lobe epilepsy found reduced anisotropy in major fiber tracts connecting the temporal lobe [6].
Historically, it had not been possible to examine the integrity of the u-fiber system in vivo because of low resolution of previous dMRI methods at traditional field strengths. However, a recent study [7] established that dMRI can be used to identify homologous u-fiber structures in the human and macaque brain. In the macaque, the existence of these u-fiber pathways is supported by evidence from tract tracing studies, the current gold standard for assessing white matter connectivity [7]. Thus, the dMRI combined with tractography provides a mechanism by which to assess u-fibers in vivo from radiological data. In this work we further develop the methodology for u-fiber system quantification and we demonstrate its usefulness in the study of non-lesional epilepsy.
2. Methods
2.1 Subjects
Eight patients (age 33 ± 8 years, 4 females) with focal, non-lesional epilepsy and eight healthy volunteers (age 39 ± 9 years, 2 females) provided informed consent according to a protocol approved by the local institutional review board. Patients with epilepsy were diagnosed by 2 board certified neurologists with over 10 years of experience each, based on clinical assessment and electroencephalography (EEG). In each patient, the suspected seizure onset zone was derived from integration of seizure semiology and EEG. Seizure onset zones were as follows: patient 1: left posterior temporal and parietal, patient 2: left frontal, patient 3: left frontal-temporal, patient 4: left temporal, patient 5: bilateral frontal, patient 6: bilateral frontal, patient 7: bilateral temporal, patient 8: bilateral temporal.
2.2 MRI
All subjects underwent MRI in a 7 Tesla scanner with a 32-channel receive-only head coil with a protocol that includes a dMRI and a T1-weighted structural scan. dMRI was performed with a high-angular-resolved single-shot, spin echo EPI sequence [TR= 13000ms, echo time TE=67ms, 1.05 mm isotropic resolution and multi-band factor of R=2 with in-plane acceleration of R=3]. Paired acquisitions with reversed phase encoding in the AP/PA direction were acquired, each with 64 matched diffusion-encoding directions (b=1200 s/mm2) and 4 unweighted (b=0) scans [8,9]. The total scan time for each acquisition was 10 min. T1-weighted magnetization-prepared 2-echo rapid gradient echo (MP2RAGE) sequence [10] at 0.7 mm isotropic resolution was obtained for segmentation and anatomical reference with a scan time of 9 min [TR/TE= 4500/3.37ms and TI1/TI2 = 1000/3200 ms].
2.3 Image Pre-processing
T1-weighted images and dMRI were pre-processed using pipelines based on those from the human connectome project (HCP) [11] modified for in-house use [12].
Structural
Cortical reconstruction and volumetric segmentation was performed with the Freesurfer image analysis suite (http://surfer.nmr.mgh.harvard.edu/). Advanced normalization tools (ANTS, antsRegistrationSyNQuick.sh, http://stnava.github.io/ANTs/) was used to register the combined T1-weighted image of each participant to the atlas image [7] (http://cmrm.med.jhmi.edu/).
dMRI
Preprocessing consisted of fitting of the field map from oppositely encoded non-diffusion-weighted (b=0) images with the topup module in FSL to correct for susceptibility-induced distortions, correction of motion and distortions due to eddy currents using the eddy module in FSL, correction of gradient non-linearities, and registration to the aligned and normalized T1-weighted structural image.
2.4 U-fiber Quantification
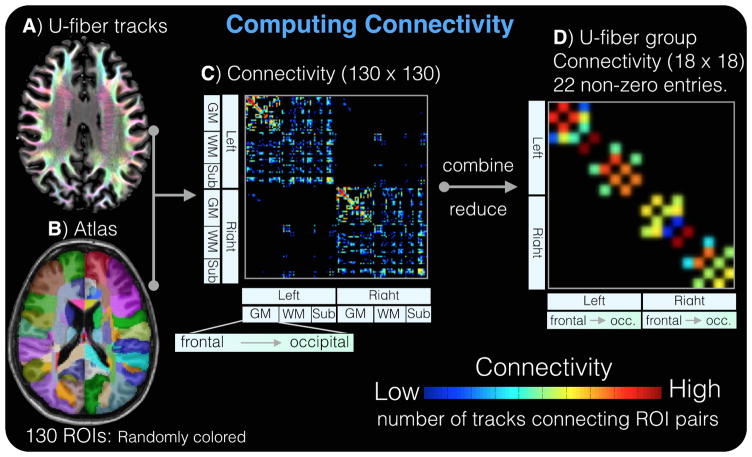
An overview of the u-fiber quantification pipeline is given in Figure 1. Tractography data analysis involved several steps: (1) iFOD2 [13] tractography using MRtrix3 (108 tracks and FA cutoff of 0.01), (2) SIFT [14] filtering was to enforce consistency of the tracks with underlying fiber orientation distributions, (3) exclusion of tracks passing through the corpus callosum (4) selection of u-fibers longer than 3 cm, and that satisfied the constraint, D ≤ L / π, where D is the distance from the initial and end point and L is the length of the track (Figure 1d). This geometric criterion was chosen to reflect tracks that were u-shaped.
Figure 1.
U-fibers tracks (D) are combined with the labeled atlas (F) to produce the 130×130-element connectivity matrix (G). The connectivity matrix is collapsed into a smaller, 18×18-element, u-fiber group connectivity matrix (H). This matrix has 22 non-zero elements corresponding to the 22 u-fiber groups (11 per hemisphere).
Quantitative comparisons were performed on connectivity matrices. The u-fiber tracks (Figure 1a) and the labeled atlas (Figure 1b) were warped to the subjects’ native space and used to compute the connectivity matrix (Figure 1c). The resulting 130×130-element connectivity matrix (Figure 1c) was then collapsed into an 18×18-element u-fiber group connectivity matrix that could then be projected onto the known u-fiber groups [7] (Figure 1d). In this scheme, these nodes are connected by 22 u-fiber groups represented as edges in network modeling. There are 18 distinct ROI’s (9 per hemisphere) comprised of the superior frontal (SF), middle frontal (MF), inferior frontal (IF), Pre-central (PrC), post-central (PoC), Parieto-temporal (PT), superior parietal (SP), temporal (Tmp), and occipital (Occ). The short range connections among these 9 regions on each hemisphere contribute to the 22 u-fiber groups (11 per hemisphere). In each subject, we computed the (a) the mean u-fiber count for each of the 22 u-fiber groups, (b) z-score of the mean u-fiber count for each of the 22 u-fiber groups which accounts for regional differences, (c) mean u-fiber count across all 22 u-fiber groups, and (d) the z-score of the mean u-fiber count across all 22 u-fiber groups.
2.5. Statistics
All statistical analyses were performed using software developed in-house using MATLAB. Permutation testing was done in order to control Type 1 errors. For all tests, 5000 permutations were used, with those differences surviving p<0.05 considered significant. The effect of group (patients vs. controls) was examined on average and standardized u-fiber track counts for each of the 22 u-fiber groups individually and across all 22 u-fiber groups as a whole using a Student’s t-test. An estimate of the effect size of group differences was obtained using Cohen’s d.
3. Results
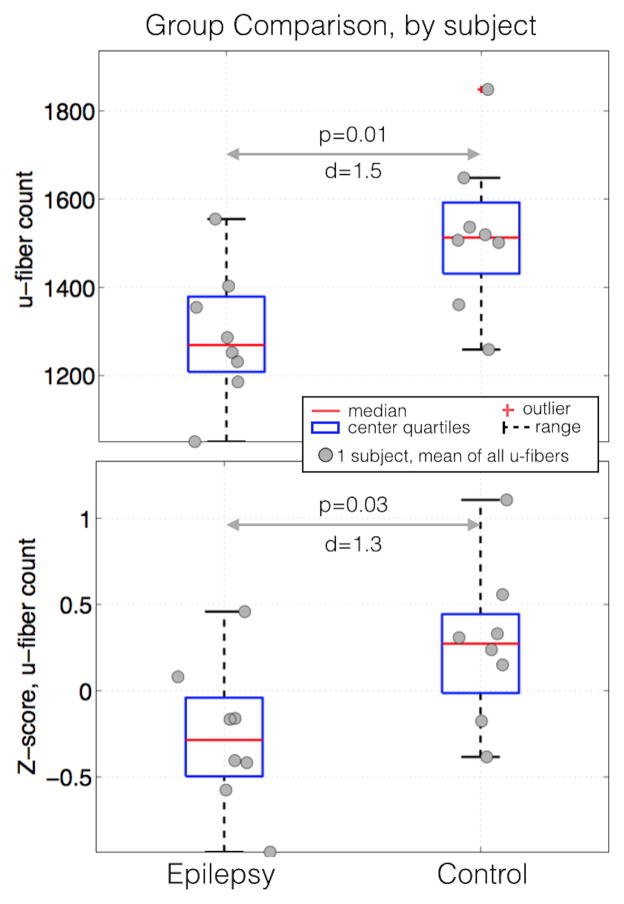
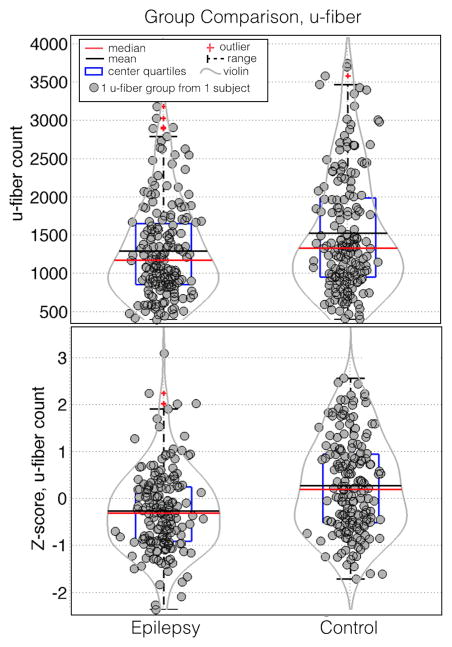
We found that subjects with epilepsy had significantly lower raw (Figure 2a, p=0.01, Cohen’s d=1.5) and normalized (Figure 2a, p=0.03, Cohen’s d=1.3) mean u-fiber count across all 22 u-fiber groups. The same effect was observed when the analysis was repeated for each individual u-fiber group (Figure 3). The box plots show that in the mean and median of both raw (Figure 3a, p=0.16×10⁻⁶, Cohen’s d=0.57) and normalized counts (Figure 3b, p=0.0018, d=0.34), were lower in epilepsy patients compared to controls. As a visual aide, violin plots are superimposed on Figure 3. The grey violin lines indicate the density of points at each vertical location with the distance from the center of the box plot proportional to the density. The violin plots were implemented using a free MATLAB function (Hoffmann H, 2013: violin.m - Simple violin plot using MATLAB default kernel density estimation. INRES, University of Bonn).
Figure 2.
Box and whisker plots of the z-score of the u-fiber count, the total number of tracks connecting each region. Red horizontal lines indicate the median value of each distribution while the blue boxes delineate the 25th to 75th percentiles. Gaussian random shifts in the × direction are added to each data point to aide visualization.
Figure 3.
Box and whisker plots of the z-score of the u-fiber count. Red horizontal lines indicate the median value of each distribution while the blue boxes delineate the 25th to 75th percentiles. Gaussian random shifts in the × direction are added to each data point to aide visualization. Violin plot overlays (gray curves) have been added to aide visualization of the density of points at each y position.
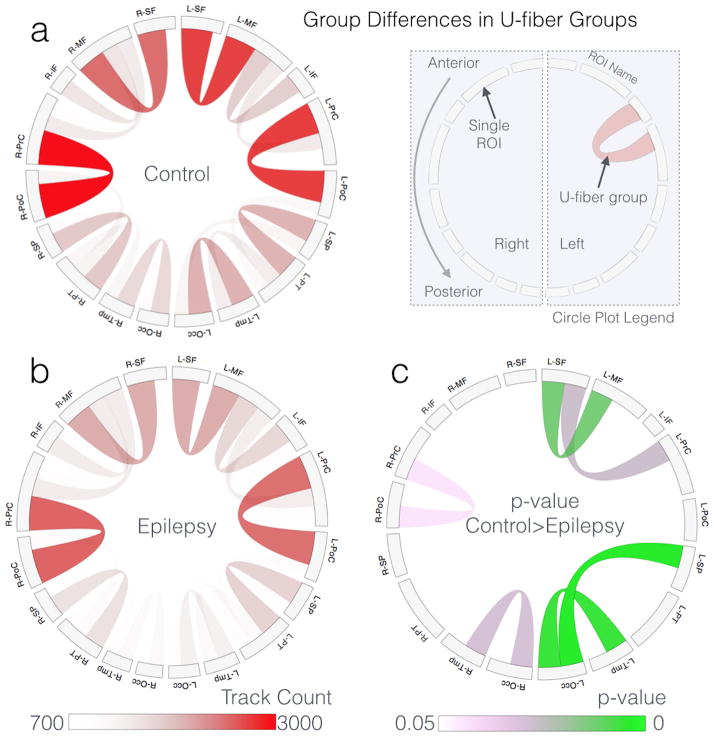
Group averages of the u-fiber connectivity (18×18 connectivity matrix) are presented separately for controls (Figure 4a) and patients (Figure 4b) as circle plots in which each chord represents a u-fiber group and its color and opacity indicate the track count in that group. Figure 4c displays the results of the significant differences between patients and controls color-coded according to their p-value. In the chord diagram the chords represent u-fibers (as they do in Figure 4a and 4b) but in Figure 4c the color indicates the p-value with light pink colors close to 0.05 and lower p-values being progressively close to solid green. Significant group differences were mostly left-lateralized which may be related to seizure onset zones that were also mostly left-lateralized.
Figure 4.
Group averages for the control and epilepsy groups for each u-fiber group rendered using a chord diagram (a, b, respectively) and p-values for the t-test that track counts in epilepsy are greater than controls (c). The color in the p-value plot (c) indicates the p-value with light pink colors close to 0.05 and lower p-values being progressively close to solid green. Multiple comparisons corrections were done using permutation testing with 5000 permutations.
4. Discussion
In this work a method to quantitatively assess u-fibers in the human brain in vivo was presented and used to test the integrity of the u-fiber system in patients with focal, non-lesional epilepsy. U-fiber counts were found to be lower on average in subjects with epilepsy than in healthy controls. This is the first study to examine u-fibers in a group of epilepsy patients using an atlas with known, validated u-fiber population. In addition this is the first in vivo study of u-fibers using 7T MRI. Our results add to evidence from prior tensor-based studies that had lacked the ability to study microstructural changes in fine-grained white matter features such as the u-fiber system [4,5,6]. Our current work suggests that short-range network connections are compromised in epilepsy, contributing to the concept of epilepsy as a network disease [15] and the growing body of work on structural network changes in epilepsy [16].
While there is some evidence that the lowest u-fiber counts may be related to seizure onset zones, a full comparison is beyond the scope of this methods article. However, recent work suggests that u-fiber density appears to be more specifically affected in the seizure onset zones than tensor-based metrics [17]. The details of the methods used by Goc et al. [17] have not been published so we cannot speculate on potential differences in methodology. A direct comparison with their methodology will be the a subject of future study. A limitation of this method, and perhaps all dMRI-based methods, is that it may systematically underrepresent u-fibers originating from or connecting to the sulci of the cortex. Recent work highlights the effect of fibers running parallel to the grey-white mater boundary masking the ability to track fibers connecting near sulci [18]. Finally, because it only considers fibers connecting established u-fiber bundles from regions on interest on an atlas, this method explicitly excludes analysis of long-range fibers such as the superior longitudinal faciculus. While, it is possible that these tracts are affected in epilepsy, that analysis is beyond the scope of this work.
In conclusion, a dMRI-based method for quantitatively assessing u-fibers was presented and used to compare u-fibers in a group of patients with focal, non-lesional epilepsy and matched controls scanned with 7T MRI. U-fiber counts in non-lesional epilepsy patients were found to be lower on average than controls. Future work will be aimed at histological validation of the method and exploration of u-fiber quantification in epilepsy as well as other neurological disorders.
Acknowledgments
The study was funded in part by an award to PB (NIH-NINDS R00 NS070821).
Footnotes
Conflicts of interest: none declared.
References
- 1.Goc J, Khalilieh N, Hartl E, et al. The effects of preprocessing on statistical DTI fibre quantification in cryptogenic focal epilepsy. Proceedings of Annual Meeting of OHBM. 2015:1756. [Google Scholar]
- 2.Young NA, Szabo CA, Phelix CF, et al. Epileptic baboons have lower numbers of neurons in specific areas of cortex. Proceedings of the National Academy of Sciences. 2013;110:19107–19112. doi: 10.1073/pnas.1318894110. [DOI] [PMC free article] [PubMed] [Google Scholar]
- 3.Eriksson S, Rugg-Gunn FJ, Symms MR, et al. Diffusion tensor imaging in patients with epilepsy and malformations of cortical development. Brain. 2001;124:617–26. doi: 10.1093/brain/124.3.617. [DOI] [PubMed] [Google Scholar]
- 4.Gross DW, Concha L, Beaulieu C. Extratemporal white matter abnormalities in mesial temporal lobe epilepsy demonstrated with diffusion tensor imaging. Epilepsia. 2006;47:1360–3. doi: 10.1111/j.1528-1167.2006.00603.x. [DOI] [PubMed] [Google Scholar]
- 5.Chiang S, Levin HS, Wilde E, et al. White matter structural connectivity changes correlate with epilepsy duration in temporal lobe epilepsy. Epilepsy research. 2016;120:37–46. doi: 10.1016/j.eplepsyres.2015.12.002. [DOI] [PMC free article] [PubMed] [Google Scholar]
- 6.Govindan RM, Makki MI, Sundaram SK, et al. Diffusion tensor analysis of temporal and extra-temporal lobe tracts in temporal lobe epilepsy. Epilepsy research. 2008;80:30–41. doi: 10.1016/j.eplepsyres.2008.03.011. [DOI] [PMC free article] [PubMed] [Google Scholar]
- 7.Oishi K, Huang H, Yoshioka T, et al. Superficially located white matter structures commonly seen in the human and the macaque brain with diffusion tensor imaging. Brain connectivity. 2011;1:37–47. doi: 10.1089/brain.2011.0005. [DOI] [PMC free article] [PubMed] [Google Scholar]
- 8.Ugurbil K, Xu J, Auerbach EJ, et al. Pushing spatial and temporal resolution for functional and diffusion MRI in the human connectome project. Neuroimage. 2013;80:80–104. doi: 10.1016/j.neuroimage.2013.05.012. [DOI] [PMC free article] [PubMed] [Google Scholar]
- 9.Vu A, Auerbach E, Lenglet C, et al. High resolution whole brain diffusion imaging at 7T for the human connectome project. NeuroImage. 2015;122:318–331. doi: 10.1016/j.neuroimage.2015.08.004. [DOI] [PMC free article] [PubMed] [Google Scholar]
- 10.Marques JP, Kober T, Krueger G, et al. MP2RAGE, a self bias-field corrected sequence for improved segmentation and T1-mapping at high field. Neuroimage. 2010;49:1271–1281. doi: 10.1016/j.neuroimage.2009.10.002. [DOI] [PubMed] [Google Scholar]
- 11.Glasser MF, Sotiropoulos S, Wilson N, et al. The minimal preprocessing pipelines for the Human Connectome Project. Neuroimage. 2013;80:105–124. doi: 10.1016/j.neuroimage.2013.04.127. [DOI] [PMC free article] [PubMed] [Google Scholar]
- 12.O’Halloran R, Yang C, Xu J. Correction of artifacts caused by transient eddy currents in simultaneous multi-slice dMRI. Proc 23rd Annual Meeting of the Intl Soc Mag Reson Med(ISMRM) 2015:2931. [Google Scholar]
- 13.Tournier J, Calamante F, Connelly A. Improved probabilistic streamlines tractography by 2nd order integration over fibre orientation distributions. Proc 18th Annual Meeting of the Intl Soc Mag Reson Med(ISMRM) 2010:1670. [Google Scholar]
- 14.Smith RE, Tournier JD, Calamante F, et al. Sift: spherical-deconvolution informed filtering of tractograms. Neuroimage. 2013;67:298–312. doi: 10.1016/j.neuroimage.2012.11.049. [DOI] [PubMed] [Google Scholar]
- 15.Engel J, Jr, Thompson PM, Stern JM, et al. Connectomics and epilepsy. Current opinion in neurology. 2013;26:186. doi: 10.1097/WCO.0b013e32835ee5b8. [DOI] [PMC free article] [PubMed] [Google Scholar]
- 16.Bonilha L, Nesland T, Martz GU, et al. Medial temporal lobe epilepsy is associated with neuronal fibre loss and paradoxical increase in structural connectivity of limbic structures. Journal of Neurology, Neurosurgery & Psychiatry. 2012 doi: 10.1136/jnnp-2012-302476. [DOI] [PMC free article] [PubMed] [Google Scholar]
- 17.Goc J, Hartl E, Noachtar S, et al. DTI Analysis of U-fibre density images localises the epileptogenic zone better than FA or MD. Proceedings of Annual Meeting of OHBM. 2016:3166. [Google Scholar]
- 18.Reveley C, Seth AK, Pierpaoli C, et al. Superficial white matter fiber systems impede detection of long-range cortical connections in diffusion MR tractography. Proceedings of the National Academy of Sciences. 2015;112:2820-8.12. doi: 10.1073/pnas.1418198112. [DOI] [PMC free article] [PubMed] [Google Scholar]


