Abstract
AMP-activated protein kinase (AMPK) occurs as heterotrimeric complexes in which a catalytic subunit (α1/α2) is bound to one of two β subunits (β1/β2) and one of three γ subunits (γ1/γ2/γ3). The ability to selectively activate specific isoforms would be a useful research tool, and a promising strategy to combat diseases such as cancer and type 2 diabetes. We report that the AMPK activator PT-1 selectively increased the activity of γ1- but not γ3-containing complexes in incubated mouse muscle. PT-1 increased the AMPK-dependent phosphorylation of the autophagy-regulating kinase ULK1 on Ser555 but not proposed γ3 AMPK substrates such as TBC1D1 Ser231 or ACC2 Ser212 phosphorylation, nor did PT-1 stimulate glucose transport. Surprisingly, however, in HEK-293 cells expressing human γ1, γ2 or γ3, PT-1 activated all three complexes equally. We were unable to reproduce previous findings suggesting that PT-1 activates AMPK by direct binding between the kinase and auto-inhibitory domains of the α subunit. We show instead that PT-1 activates AMPK indirectly by inhibiting the respiratory chain and increasing cellular AMP:ATP and/or ADP:ATP ratios. Consistent with this mechanism, PT-1 failed to activate AMPK in HEK-293 cells expressing an AMP-insensitive R299G mutant of AMPK-γ1. We propose that the failure of PT-1 to activate γ3-containing complexes in muscle is not an intrinsic feature of such complexes, but is because PT-1 does not increase cellular AMP:ATP ratios in the specific subcellular compartment(s) in which γ3 complexes are located.
Keywords: AMPK, ULK1, skeletal muscle, glucose, TBC1D1, ACC2
Introduction
The heterotrimeric AMP-activated protein kinase (AMPK) complex, consisting of a catalytic α subunit (α1 or α2) in combination with regulatory β (β1 or β2) and γ subunits (γ1, γ2 or γ3), is activated by falling cellular energy status in multiple tissues. Once activated, AMPK conserves ATP by inhibiting anabolic pathways, while promoting ATP production by stimulating catabolic pathways [17;18]. Over the last decade, proof-of-concept studies in rodents have demonstrated that chronic administration of AMPK activators, including metformin, the anti-diabetic drug most widely prescribed world-wide, offers protection against a variety of disease states such as cardiovascular and inflammatory diseases, type 2 diabetes and some forms of cancer [5;11;16;37;38].
Nevertheless, chronic AMPK activation could have deleterious effects in some tissues. This is suggested, for example, by the effects of point mutations in the gene encoding the AMPK-γ2 subunit, which cause increased basal AMPK activity and lead to excessive glycogen accumulation and arrhythmias (Wolff-Parkinson-White syndrome) in the heart [1;26]. Although there are currently no indications that similar adverse effects are caused by transient pharmacological activation of AMPK, one potential strategy to minimize side effects would be to develop drugs that specifically target and activate only certain subsets of AMPK heterotrimers. Such drugs would also be a useful research tool to assign known and novel targets and physiological functions of AMPK to specific AMPK complexes. Several reports of α and β subunit-selective AMPK activators have been published [22;27;36;46;49] but a γ subunit-selective compound has not yet been reported.
In the current study, we set out to test the use of a newly available AMPK activator, PT-1, as a tool to study AMPK function in skeletal muscle. PT-1 was proposed to interact directly with AMPK by binding in the cleft between the kinase domain (KD) and the auto-inhibitory domains (AID) on the α subunits, relieving inhibition of the KD by the AID [32]. We found that PT-1 stimulated AMPK heterotrimers associated only with γ1, and not γ3, in contrast to the commonly used activator AICAR which activated both isoforms. Consistent with previous findings that the γ3 isoform has a function in regulating glucose uptake [2], that process was stimulated by AICAR but not PT-1. Despite the apparent isoform selectivity in muscle, when AMPK complexes containing γ1, γ2 or γ3 were expressed in HEK-293 cells, all three were activated by PT-1. Finally, we re-investigated the mechanism by which PT-1 activates AMPK and provide evidence that, contrary to previous findings, it does not act by directly binding between the KD and AID, but instead acts indirectly (like many other AMPK activators) by inhibiting the respiratory chain and thus increasing cellular AMP levels.
Experimental
Materials
PT-1 was purchased from Tocris Biosciences (USA) and dissolved in DMSO (40 mM stock). AICAR was from Toronto Research Chemicals (Canada). Unless otherwise stated, materials were from Sigma Aldrich.
Animals
C57BL/6NTac females were purchased from Taconic and housed on a 12h light:12h dark-cycle with free access to chow diet (Altromin # 1324, Chr. Pedersen, Denmark) and tap water. The mice arrived at age 10-12 weeks and were acclimatized for at least 1 week before experimentation. Wild type and muscle-specific dominant-negative kinase-dead α2 (KD) AMPK female mice were provided by Morris Birnbaum [30] and have been backcrossed at our facility for >10 generations onto the C57BL/6NTac strain. All experiments were carried out on 11-14 wk. old mice. All experiments were approved by the Danish Animal Experiments Inspectorate and carried out in accordance with the “European Convention for the Protection of Vertebrate Animals Used for Experiments and Other Scientific Purposes”.
Ex vivo muscle incubation
Fed mice were anesthetized by intraperitoneal injection of pentobartital/lidocain (6 mg pentobarbital sodium and 0.6 mg lidocain/100 g body weight) after which soleus and EDL muscles were tied with non-absorbable 4-0 silk suture loops (Look SP116, Surgical Specialities Corporation, Reading, PA, USA) at both ends and suspended on adjustable hooks at resting length (1-2 mN tension) in ex vivo incubation chambers (Multi Myograph system, Danish Myo-Technology, Denmark) at 30°C with constantly 95% O2/5% CO2-bubbled Krebs-Ringer-Henseleit buffer (118.5 mM NaCl, 24.7 mM NaHCO3, 4.74 mM KCl, 1.18 mM MgSO4·7 H2O, 1.18 mM KH2PO4, 2.5 mM CaCl2·2 H2O) supplemented with 8 mM mannitol and 2 mM pyruvate (KRH medium). After 5-10 min of rest, fresh KRH medium was added with either DMSO (amount corresponding to PT-1 treatment), PT-1, AICAR (2 mM dissolved directly in KRH buffer), or combined PT-1+AICAR. After 50 min, the medium was changed to one containing radioactively labeled 3H-2-deoxyglucose (0.13 μCi/ml in 1 mM cold 2DG) and mannitol (0.11 μCi/ml in 8 mM cold mannitol) keeping the PT-1 and AICAR-treatments the same throughout. At 1h, the muscles were harvested, dipped in ice-cold KRH medium, dapped dry on paper and snap-frozen in liquid nitrogen until further analyses.
Muscle immunoblotting and 2 deoxy-glucose (DG) transport analyses
Western blotting and 2DG transport were performed on the same muscle lysate. Each muscle was trimmed free of connective tissue and sutures in a small container with liquid nitrogen and weighed. Afterwards, muscles were homogenized in 300 μl ice-cold lysis buffer (50 mM Tris·HCl, 150 mM NaCl, 1 mM EDTA, 1 mM EGTA, 50 mM NaF, 5 mM Na4P2O7, 2 mM Na3VO4, 1 mM dithiothreitol, 1 mM benzamidine, 1% Nonidet P-40, and 0.5% protease inhibitor cocktail, pH 7.4) on a beadmill (Tissuelyser II (Qiagen, USA - 1 min, 30 Hz, maximum 10 muscles/round)), rotated end-over-end for 30 min and spun at 13000·g for 20 min to generate lysates. 10 μl was used for protein determination (1:10 dilution, Bicinchoninic acid method, Pierce, USA) and 100 μl was dissolved in 2 ml of β-scintillation liquid (Ultima Gold, Perkin Elmer, USA) for measurement of 2DG transport using 14C mannitol to estimate extracellular space using β-scintillation counting. Immunoblotting was performed as described previously [23]. The primary antibodies used were actin (Sigma-Aldrich, USA, cat#A2668), α2 AMPK (provided by D.G. Hardie), AMPK Thr172 (Cell Signaling Technology (CST), USA, cat#2531), ACC1 and ACC2 (provided by D.G. Hardie), ACC1 Ser79/ACC2 Ser212 (Millipore, USA, cat# 07-303), eEF2 Thr56 (CST cat#2331), Glycogen synthase Ser8 (provided by D.G. Hardie [24][19]), p38 MAPK Thr180/Tyr182 (CST cat# 9211), Raptor Ser792 (CST cat# 2083), TBC1D1 Ser231 (Millipore cat# 07-2268), TBC1D1 Thr590 (CST cat# 6927), TBC1D1 (CST cat#4629) and TBC1D4 (provided by C. MacKintosh, University of Dundee, UK [33][18]), ULK1 (Sigma, A7481) ULK1 Ser555 (CST Cat# 5869),. All blots were developed on a ChemiDoc MP imaging system (Biorad, Denmark) using enhanced chemiluminescence (ECL+, Amersham Biosciences, USA). For stripping and reprobing, membranes were placed in stripping buffer (100 mM 2-mercaptoethanol, 2% SDS, Tris HCl pH 6.7) for 1h at 50°C with occasional agitation, washed and redeveloped with fresh secondary antibody to verify strip of primary antibody. Stripped membranes were then blocked and reincubated with new primary antibodies overnight. For coomassie-staining, the blots were submerged in coomassie brilliant blue G-250 solution for 1 min, washed in distilled water and then left in de-staining solution for 10-15 min until a picture using the ChemiDoc MP system.
AMPK activity assay in mouse lysate
The measurement of AMPK trimer activities in sequential IPs has been described in detail previously (Birk and Wojta 2006; Treebak 2009) and the antibodies used verified for use in mouse muscle (Treebak 2009; Treebak 2014). In brief, AMPK activities were measured over 3 days by first IP over night of the γ3 subunit to isolate α2/β2/γ3 complex for the activity assay, then IP of the α2 subunit to assay α2/β1/γ1 and α2/β2/γ1 activity, then the α1 subunit to measure α1/β1/γ1 and α1/β2/γ1 from activity. No detectable activity associates with γ2 AMPK in mouse or human skeletal muscle (Birk 2006; Treebak 2009).
Generation of Stable Cell Lines
DNAs encoding full-length human AMPK-γ isoforms were amplified and cloned into the pcDNA5/FRT/TO plasmid (Invitrogen). T-Rex HEK-293 cells containing a single FRT site (Invitrogen) were transfected with Fugene6 (Promega) using the plasmids POG44 and pcDND5/FRT/TO/gamma at a ratio of 9:1. Plates were trypsinised 48 hr after transfection and replated in media containing 200 and 15 μg/ml hygromycin B and blasticidin respectively. The medium was replaced every 3 days until foci could be identified, and individual foci were then selected and expanded. Protein expression was induced by addition of 1 μg/ml of tetracycline for 48 hr. The expression of FLAG-tagged γ isoforms was checked by Western blotting using anti-FLAG antibodies.
Culture and treatment of cells
HEK-293 cells stably expressing γ1, γ2 or γ3 were grown for 48 hr in Dulbecco’s modified Eagle’s medium (DMEM) containing 1 g/L glucose, 10% (v/v) tetracycline-free foetal bovine serum, 100 U/ml penicillin, 100 μg/ml streptomycin and 200 μg/ml hygromicin B, 15 μg/ml blasticidin and 1 μg/ml tetracycline. The cells were then washed into the above media without foetal bovine serum for 16 hr. Cells were treated for 1 hr, rapidly lysed [19] and lysates stored at -80°C until use.
Cell culture assay of AMPK
AMPK was assayed using either AMARA or SAMS peptide as described previously [9;19][1, 2]. AMPK from cell lysates was assayed in immunoprecipitates made using EZview Red anti-flag M2 affinity gel (Sigma). Truncated AMPK-α1 protein (residues 1-312 and 1-335, see below) was maximally phosphorylated with saturating amounts of CaMKKβ, before being assayed in the presence of increasing concentrations of PT1. Rat liver AMPK was purified as described [20].
Cell culture immunoprecipitation, SDS-PAGE and western blotting
Lysates were immunoprecipitated using EZview Red anti-flag M2 affinity gel (Sigma). The beads were washed 2x in IP buffer (50 mM Na Hepes, 1 mM DTT pH 7.4, the supernatant was removed and the beads resuspended in SDS-PAGE sample buffer. The beads were incubated at 100°C for 20 min and the supernatant analysed by SDS-PAGE and Western blotting as described. The anti-pT172, AMPK-α and AMPK-β1 antibodies were from Cell Signaling, the anti-FLAG antibody from Sigma, and all other antibodies were made in-house [6;44].
Expression and purification of bacterial proteins
Truncated rat AMPK-α1 kinase domain constructs (residues 1-312 and 1-335) were produced as described [13]. Plasmids were transfected into BL21 (DE3) competent cells and expressed in LB media until the absorbance at 600 nm was ≈0.6, when protein expression was induced with IPTG. Cells were harvested by centrifugation, lysed using a pestle and mortar and resuspended in 50 mM Tris pH 8.0, 500 mM NaCl, 1 mM EDTA, 1 mM EGTA, 1 mM DTT and protease inhibitor tablets (Roche). The lysates were clarified by centrifugation (30,000 rpm; 30 min; 4°C) and the supernatants applied to GST FF columns (1 ml, Life Science). After washing, protein was eluted in buffer containing 20 mM glutathione.
Other procedures
Measurement of whole cell oxygen uptake and estimation of cellular ADP:ATP ratio was as described [21].
Statistical analyses
One or 2-way ANOVA was performed as appropriate (Sigmaplot 12.5). When significant, post hoc tests were used to control for multiple comparisons as indicated in the figure legends. The significance level was set at p<0.05.
Results
PT-1 activates AMPK, but does not increase glucose uptake in mouse muscle incubated ex vivo
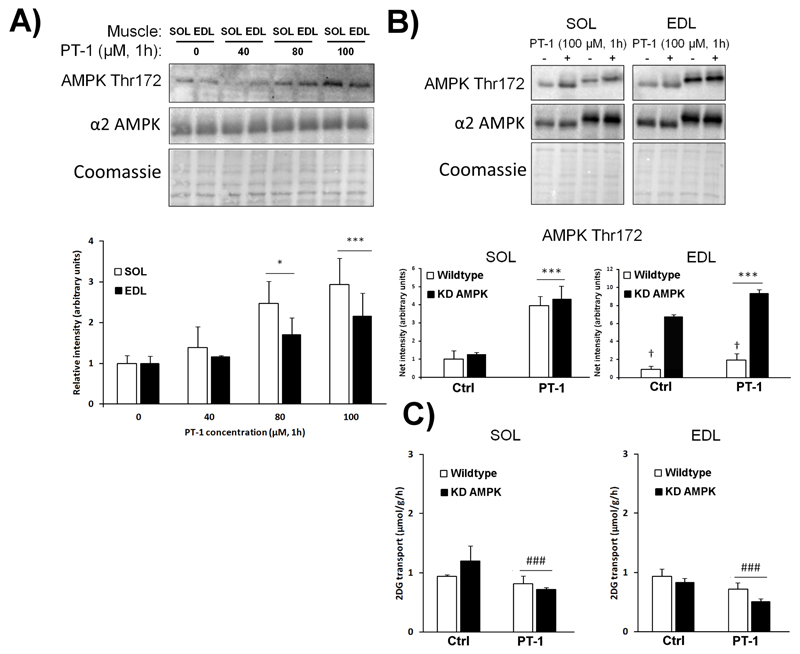
In cultured L6 myotubes, PT-1 at 20-80 μM was previously reported to dose-dependently increase phosphorylation of Thr172 on AMPK [32]. In our ex vivo mouse muscle incubation system, we initially tested the effect of increasing doses of PT-1 for 1h on Thr172 phosphorylation in the oxidative, type I fiber-enriched soleus muscle, and the more glycolytic type II fiber-enriched EDL muscle. We observed a consistent 2-3-fold increase in phosphorylation by 100 μM PT-1 in both muscle types (Fig. 1A). The AMPK activator AICAR, which is converted to the AMP mimetic ZMP within the cells [7], increases glucose transport in isolated mouse muscle in an AMPK-dependent manner in various transgenic mouse models [2;25;39]. To test if this was also the case for PT-1, muscles from wild type mice or mice with muscle-specific expression of a kinase-inactive, dominant-negative AMPK-α2 mutant (KD AMPK) were incubated with PT-1. PT-1 clearly increased AMPK Thr172 phosphorylation (Fig. 1B) but, unexpectedly, slightly suppressed glucose transport (Fig. 1C). Total AMPK α2 expression on average was respectively 2.7±0.18 and 2.9±0.01 times higher in the KD AMPK soleus and EDL muscles compared to wild type (representative blots shown but quantifications not shown).
Figure 1.
PT-1 dose-dependently increases AMPK Thr172 phosphorylation but slightly suppresses muscle glucose transport. A) C57BL/6 soleus and EDL muscles were incubated with 0, 40, 80 and 100 μM PT-1 for 1h after which AMPK Thr172 was measured by western blotting. Actin was used as a loading control. B) Representative blots and quantifications of AMPK Thr172 in soleus and EDL muscle from wild type vs. kinase-dead (KD) AMPK mice C) 2DG transport in the same muscles. */*** p<0.05/0.001 ANOVA main-effect compared to basal, ### p < 0.001 genotype-effect. n = 2 for optimization and n= 4 for wild type vs. kinase-dead AMPK mice. Results are mean ± SE.
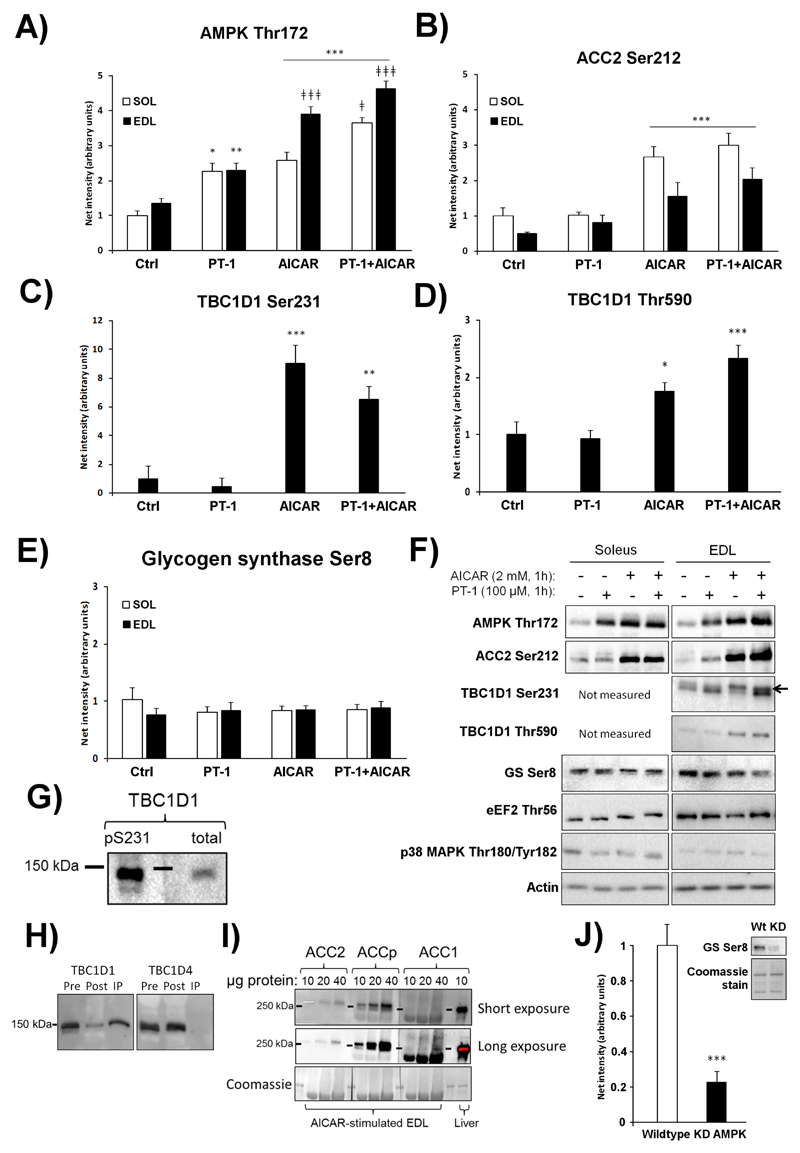
To directly compare the effect of AICAR and PT-1, mouse muscles were stimulated ex vivo with either one or both compounds combined. AMPK Thr172 phosphorylation was increased by PT-1 in both soleus and EDL muscle (Fig. 2A). Interestingly, AICAR increased the phosphorylation of Ser212 on the endogenous AMPK substrate ACC2, whereas PT-1 did not (Fig. 2B). Another AMPK substrate and proposed mediator of the stimulatory effect of AMPK on glucose transport is the Rab-GTPase activating protein, TBC1D1. This protein is enriched in mouse EDL muscle [40] and was therefore only measured in EDL. Similar to phosphorylation of Ser212 on ACC2, PT-1 failed to increase phosphorylation of Ser231 on TBC1D1, in contrast to AICAR (Fig. 2C). Another phosphorylation site on TBC1D1, Thr590, followed the same pattern as Ser231 in response to PT-1 and AICAR (Fig. 2D). Glycogen synthase (GS) Ser8 phosphorylation is reduced in α2 AMPK knockouts [24] and was recently proposed to be a target of γ1-containing complexes in mouse muscle [34]. However, phosphorylation of Ser8 (also referred to as site 2) on GS was not changed by either PT-1 or AICAR (Fig. 2E, representative blots in Fig. 2F). The phosphorylation of proteins not considered to be part of the AMPK signaling axis in muscle, i.e. Thr180/Tyr182 on p38 MAPK and Thr56 on elongation factor-2 (the latter targeted by the Ca2+/calmodulin-dependent kinase eEF2K) did not respond to PT-1 or AICAR (quantification not shown, but blots included in Fig 2F). As expected, the upper band detected by the TBC1D1 Ser231 antibody aligned with total TBC1D1 (Fig. 2G) and detection was lost when TBC1D1, but not TBC1D4, was immunodepleted (Fig. 2H). In some blots for ACC Ser212 phosphorylation in muscle, we observed a second faint band below the strong ACC2 band. When loading high amounts of muscle lysate protein, ACC1 is detectable in skeletal muscle (Fig. 2I), making the lower phospho-ACC band likely to stem from ACC1, either expressed in muscle fibers or in non-muscle-cell types contaminating the lysate. As a positive control for the GS Ser8 phospho-specific antibody, we confirmed that basal phosphorylation was reduced in mouse muscles expressing the KD mutant of AMPK (Fig. 2J), as shown previously with AMPK-α2 knockout mice [19].
Figure 2.
PT-1 stimulates AMPK Thr172, but not ACC2 or TBC1D1 phosphorylation, whereas AICAR stimulates all. Western blotting were performed on C57BL/6 soleus and EDL muscles stimulated with PT-1 (100 μM, 1h), AICAR (2 mM, 1h) or combined PT-1+AICAR treatment to assess A) AMPK Thr172, B) ACC2 Ser212, C) TBC1D1 Ser231 in EDL and D) TBC1D1 Thr590 in EDL. E) Glycogen synthase (GS) Ser8 in soleus and EDL. Representative blots are shown in F). To verify the TBC1D1 Ser231 antibody in G), the top band of the doublet recognized by the phospho-Ser231 antibody in AICAR-stimulated mouse EDL was shown to align with total TBC1D1 and H) to be depleted by immunoprecipitation with total TBC1D1 but not TBC1D4. I) Immunoblot of ACC1, ACC2 and ACC1/2 Ser79/Ser212 in mouse muscle and liver as indicated. J) The GS Ser8 phosphorylation was reduced in resting kinase-dead (KD) AMPK overexpressing soleus muscles compared to wild type. */**/***p <0.05/0.01/0.001 T-test or Tukey post hoc difference compared to control, ǂ/ǂǂǂ p<0.05/0.001 Tukey post hoc difference compared to AICAR. n=8 for PT+AICAR experiments, n=6 for wild type vs. kinase-dead (KD) AMPK muscles. Results are mean ± SE.
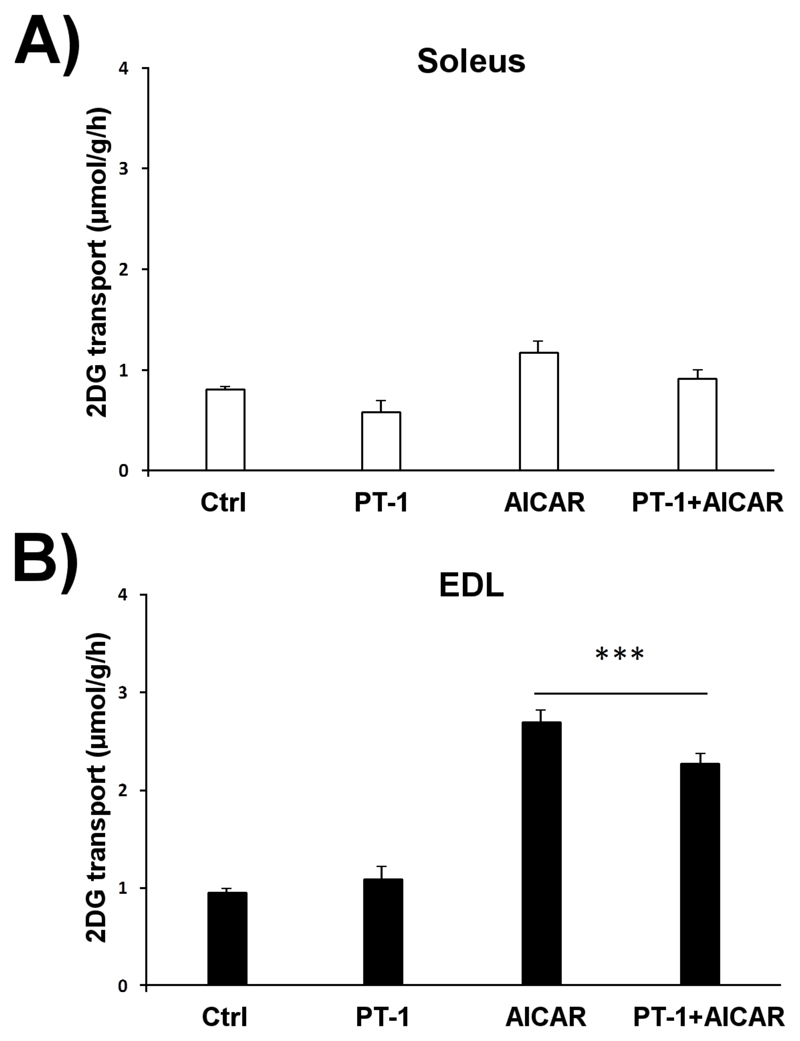
Consistent with a role for TBC1D1 in the regulation of glucose transport, AICAR markedly stimulated glucose transport (Fig. 3A and 3B) in EDL muscle (which is enriched in the α2β2γ3 isoform of AMPK [41]), while having only modest effects, which were not statistically significant, in soleus muscle. As before (see Fig. 1D), PT-1 had no stimulatory effect on glucose transport and, if anything, tended to suppress both basal and AICAR-stimulated glucose transport.
Figure 3.
In contrast to AICAR, PT-1 does not stimulate muscle glucose transport. C57BL/6 soleus and EDL muscles were stimulated with PT-1 (100 μM, 1h), AICAR (2 mM, 1h) or combined PT-1+AICAR treatment after which 2-deoxyglucose transport was measured in A) soleus and B) EDL. *** p < 0.001 Tukey post hoc difference compared to Basal. n=8. Results are mean ± SE.
PT-1 activated γ1 but not γ3 complexes in mouse muscle incubated ex vivo
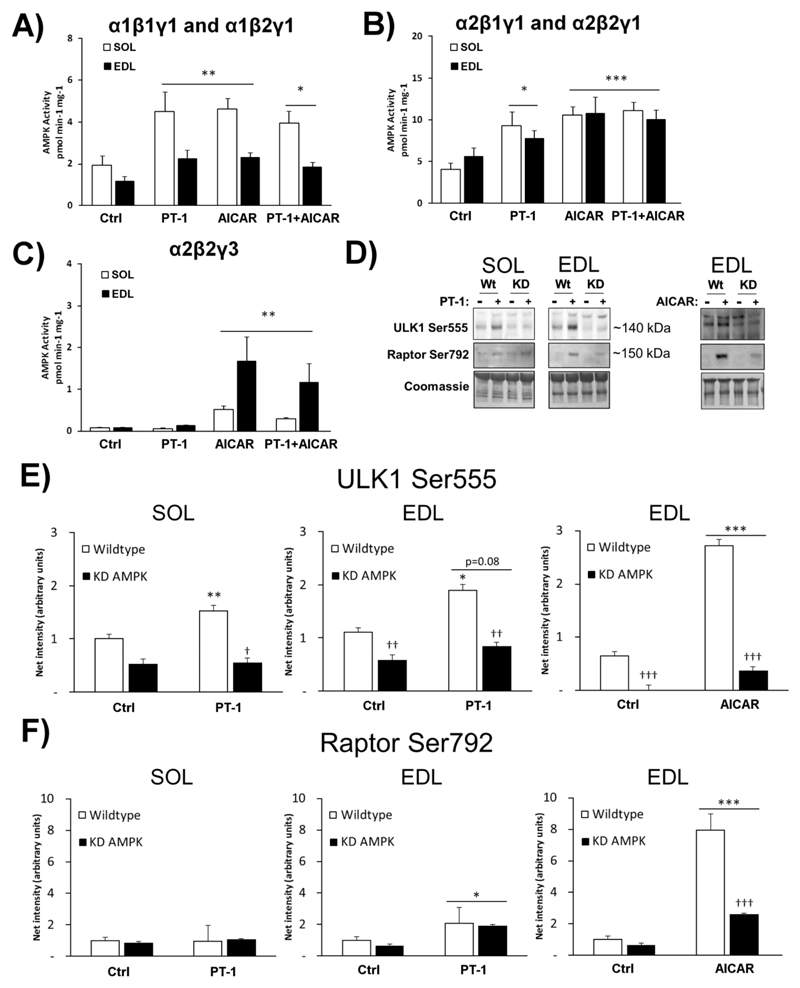
The AMPK heterotrimer composition in soleus and EDL muscle of C57BL/6 mice has been previously characterized [41]: α2β2γ3 complexes account for <2% and ~20% of total AMPK activity in soleus and EDL respectively, with the remaining activity being associated with the γ1 isoform. Having observed the differential phosphorylation of downstream targets in mouse muscles incubated with PT-1 or AICAR, we hypothesized that PT-1 might not be activating all AMPK complexes. The kinase activity of specific complexes, prepared by sequential immunoprecipitation from lysates of muscle treated with PT-1 or AICAR, was therefore measured. This revealed that PT-1 increased the activity of γ1-containing complexes (containing either α1, Fig. 4A, or α2, Fig. 4B) just as effectively as AICAR. However, the activity of the α2β2γ3 complex was increased by AICAR, but not PT-1 (Fig. 4C). Surprisingly, whereas the AMPK Thr172 phosphorylation was additive when combining PT-1 with AICAR, none of the AMPK activities showed additivity. Taken together with the results in the previous section, this suggests that the α2β2γ3 complex, rather than any γ1 complex, is the major regulator of phosphorylation of ACC2 and TBC1D1, as well as AMPK-mediated glucose transport, in skeletal muscle. They also reveal that PT-1 activates γ1 complexes, but not γ3 complexes, in mouse muscle.
Figure 4.
PT-1 increases γ1 AMPK, but not α2β2γ3 AMPK associated kinase activity in vitro, whereas AICAR stimulates all complexes. AMPK complexes were sequentially immunoprecipitated from C57BL/6 soleus and EDL muscles (n=8) stimulated with PT-1 (100 μM, 1h), AICAR (2 mM, 1h) or combined PT-1+AICAR treatment to isolate the activities of A) α1β1γ1 and α1β2γ1, B) α2β1γ1 and α2β2γ1, C) α2β2γ3 AMPK. D) Immunoblots and coomassie (loading control) of Raptor Ser792 and ULK1 Ser555 phosphorylation in wild type and kinase-dead (KD) AMPK soleus and EDL ± PT-1 (n=5-7), E) ± AICAR (n=3). E) Quantification of ULK1 Ser555 phosphorylation and F) Quantification of Raptor Ser792 phosphorylation. */**/*** p <0.05/0.01/0.001 Tukey post hoc or T-test difference. †/††/††† p <0.05/0.01/0.001 ANOVA main-effect or interaction (if only above stimulated bars). Results are mean ± SE.
ULK1 Ser555 phosphorylation was AMPK-dependently increased by PT-1
To identify γ1 AMPK-regulated substrates, we chose to blot for known AMPK sites on ULK1 Ser555 and Raptor Ser792 in wild type and KD AMPK muscles ± PT-1. PT-1 increased the phosphorylation of ULK1 Ser555 AMPK-dependently in soleus (Fig. 4C+D). In EDL, there was no ANOVA main-effect (p=0.08) but using a T-test in wild type alone, there was a significant difference (Fig. 4C+D). PT-1 had no effect in soleus but caused a small but significant increase in Raptor Ser792 in EDL which was not inhibited by KD AMPK expression (Fig 4C+E). Both sites responded potently to AICAR, in particular Raptor Ser792 and were strongly inhibited by KD AMPK expression during AICAR-stimulation. This suggests that ULK1 is a γ1 AMPK substrate in mouse skeletal muscle whereas Raptor Ser792 is likely a γ3 AMPK substrate.
PT-1 activates AMPK not by binding to the α subunit, but by increasing cellular AMP levels
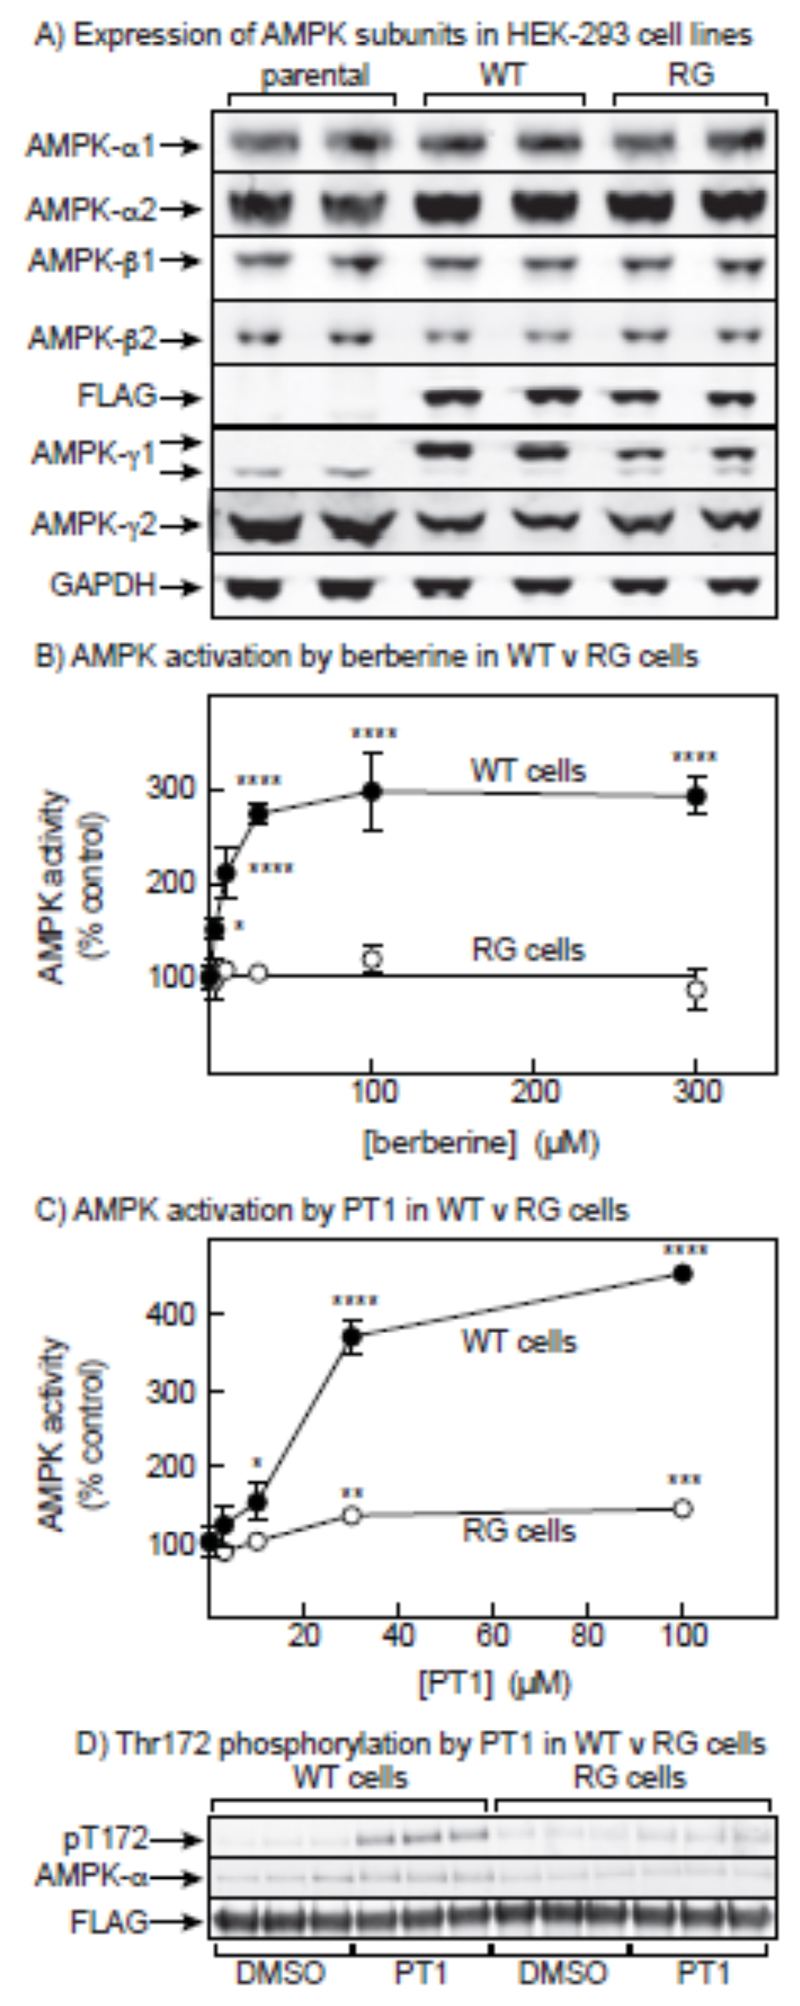
Since PT-1 has been proposed to activate AMPK by binding to the α subunit in the cleft between the KD and the AID [32], the apparent selectivity for the γ subunit isoform was puzzling. We therefore re-investigated the mechanism by which PT-1 activates AMPK. We started by testing its ability to activate AMPK in cells expressing an AMP-insensitive γ subunit mutant. We have previously used this approach [21] with HEK-293 cells stably expressing either wild type γ2 or an R531G mutant, a point mutation originally found in humans with Wolff-Parkinson-White syndrome [12] that makes AMPK insensitive to AMP or ADP. However, since we were not sure whether PT-1 would activate γ2 complexes, we constructed new cell lines in which wild type γ1 or an R299G mutant (equivalent to R531G in γ2) were expressed in HEK-293 cells from a tetracycline-inducible promoter. Characterization of these cells by Western blotting is shown in Fig. 5A. In cells expressing wild type γ1 (WT cells), the recombinant FLAG-γ1 had largely replaced the endogenous γ1 and also reduced the expression of endogenous γ2. Replacement of the endogenous γ subunits was less complete in the cells expressing the R299G mutant (RG cells). The expression of α1, α2, β1 and β2 was not significantly affected by the expression of WT γ1 or the RG mutant.
Figure 5.
PT-1 fails to fully activate AMPK in a cell line expressing an AMP-insensitive AMPK-γ1 mutant. (A) Characterization by Western blotting of parental HEK-293 cells and cells stably expressing either the wild type (WT) or the R299G mutant (RG) of AMPK-γ1. Duplicate cell lysates were blotted with the indicated antibodies. (B) Effect of incubating WT or RG cells with increasing concentrations of berberine for 1 hr. AMPK was immunoprecipitated using anti-FLAG antibody and immunoprecipitates assays for AMPK activity. Results are expressed as % of the activity in a control without berberine. Mean values significantly different from controls without berberine (1-way ANOVA with Dunnett’s multiple comparison test, n = 4) are indicated: *P<0.05, **P<0.01, ***P<0.001, ****P<0.0001. (C) As (B), but replacing berberine by PT-1 (n = 3). (D) Effect of PT-1 (n = 3) on phosphorylation of Thr172; Western blots for total AMPK-α and FLAG are also shown to confirm equal loadings.
We next tested the activation of AMPK (immunoprecipitated using anti-FLAG antibody to obviate interference from endogenous γ subunits) in WT and RG cells using berberine, an inhibitor of the respiratory chain [43][28] that activates AMPK by increasing cellular AMP levels. As found previously using mutations in γ2 rather than γ1 [21], berberine activated AMPK in WT cells but completely failed to activate AMPK in RG cells (Fig. 5B). When we tested PT-1 in the same cells, we found that the activation was greatly reduced in the RG cells although there did appear to be a small residual activation at high PT-1 concentrations (Fig. 5C). PT-1 also caused marked increases in Thr172 phosphorylation in WT cells, which were reduced or absent in the RG cells (Fig. 5D).
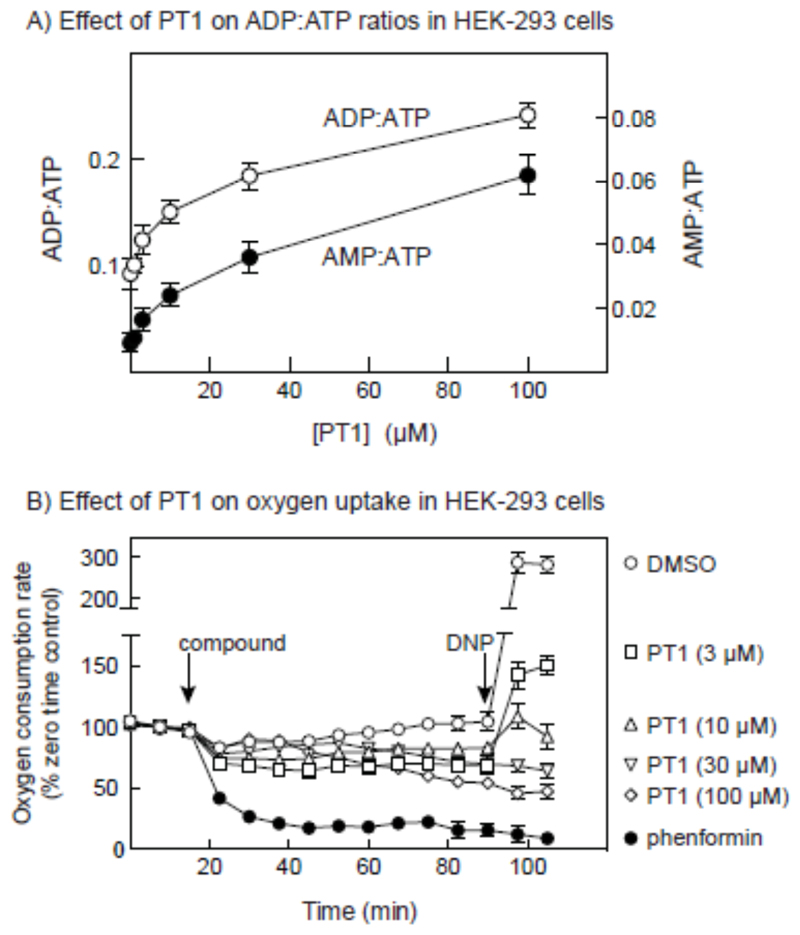
The results in Fig. 5 showed that the primary mechanism by which PT-1 activated AMPK was dependent on the presence of an intact AMP-binding site. To confirm that PT-1 increased cellular AMP, we measured cellular ADP:ATP ratios by capillary electrophoresis of perchloric acid extracts, and calculated the AMP:ATP ratios by assuming that the adenylate kinase reaction was at equilibrium [14]. Fig. 6A showed that increasing concentration of PT-1 in the medium caused progressive increases in the ADP:ATP and AMP:ATP ratios, up to a maximum of 2.7-fold in ADP:ATP and 7-fold in AMP:ATP with 100 μM PT-1. We also addressed the effect of PT-1 on cellular oxygen uptake (Fig. 6B). Concentrations of PT-1 up to 100 μM caused progressive decreases in oxygen uptake, although not as great as those caused by 3 mM phenformin. Like the effect of phenformin, the effects of high concentrations of PT-1 were not reversed by adding the mitochondrial uncoupler, 2-dinitrophenol.
Figure 6.
Effect of PT-1 on cellular ADP:ATP and AMP:ATP ratios, and cellular oxygen uptake. (A) Effect on adenine nucleotide ratios; cells were incubated with the indicated concentration of PT-1 for 1hr, perchloric acid extracts prepared, and ADP:ATP ratios estimated by capillary electrophoresis [26]. AMP:ATP ratios were calculated from ADP:ATP by assuming that the adenylate kinase reaction was at equilibrium, so that AMP:ATP = (ADP:ATP)2 [29]. Results are mean ± SD (n = 2). (C) Effect on oxygen uptake; cells were grown in Seahorse™ plates and the baseline rate of oxygen uptake measured in the Seahorse™ XF24 Extracellular Flux Analyzer. At the point shown by the first vertical arrow, PT1 (indicated concentrations), phenformin (3 mM) or vehicle (DMSO) were added and oxygen uptake measured for 75 min. Dinitrophenol (DNP, 100 μM) was then added and measurement of oxygen uptake continued for a further 15 min. results are expressed as percentages of baseline oxygen uptake as mean ± SD (n =3, DMSO/phenformin; n = 4, PT-1).
PT-1 did not activate AMPK in cell-free assays
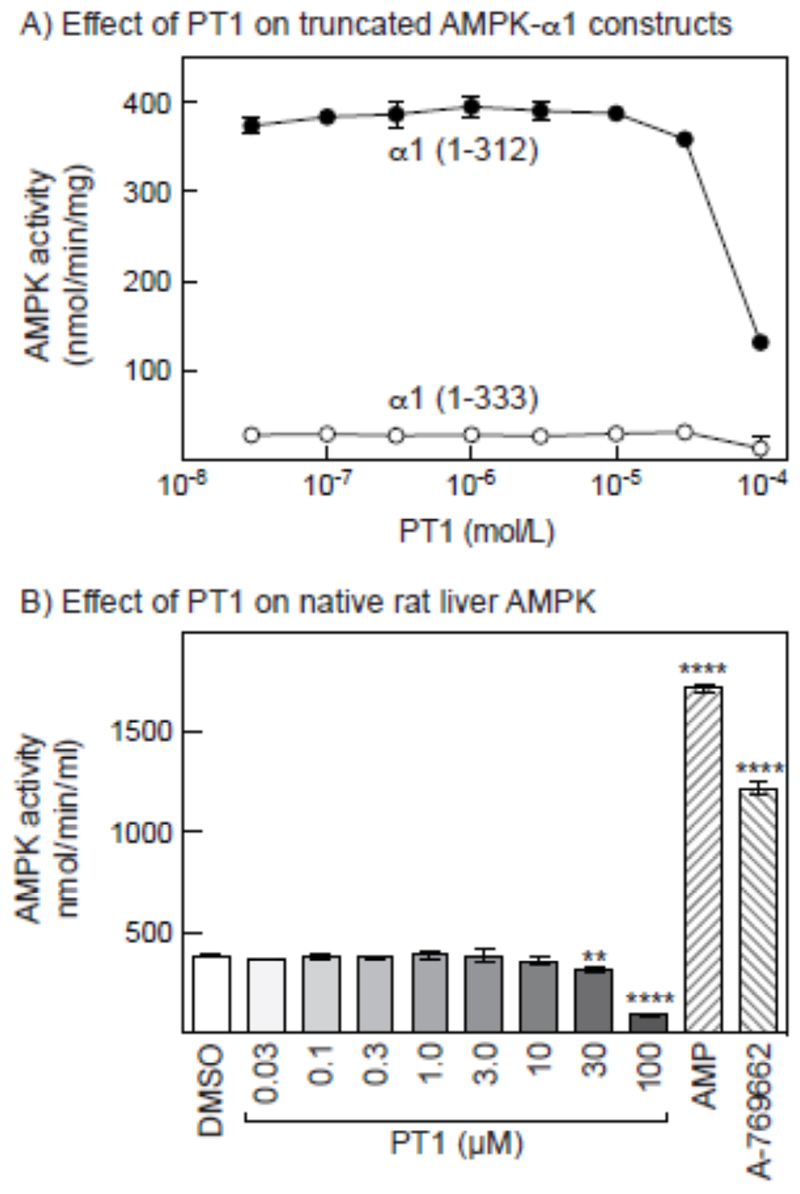
PT-1 had originally been isolated from a screen searching for activators of a truncated (1-394) human α1 subunit, and was subsequently shown to also activate an intact α1β1γ1 complex, as well as a human α1 construct (1-335) containing the KD and AID, but not a construct (1-312) containing the KD only [32]. Surprisingly, although we found (as expected [31]) that a 1-312 construct was >10-fold more active than a 1-333 construct when both were phosphorylated on Thr172, neither was activated significantly by PT1. The only effect we saw was a progressive inhibition by PT-1 at concentrations above 10 μM. In agreement with these results, we found that purified, native rat liver AMPK was not activated by PT-1, although like the α1 (1-312) construct it was inhibited at high concentrations. As positive controls for allosteric activation, rat liver AMPK was activated 4.5-fold by AMP and 3.2-fold by A-769662 (Fig. 7B). In view of the discrepancies with previous reports, we performed chemical analysis of our commercial preparation of PT-1 (see Methods section), which confirmed the expected structure.
Figure 7.
Effect of PT-1 on the kinase activity in cell-free assays of bacterially expressed constructs derived from rat AMPK-α1 and native AMPK from rat liver. (A) Effect of increasing concentrations of PT-1 on the activity of constructs containing the KD and AID (1-333) and the KD only (1-312). (B) Effect of increasing concentrations of PT-1, and of AMP (200 μM) and A-769662 (1 μM) on the activity of AMPK purified from rat liver.
PT-1 activates γ1, γ2 and γ3 complexes expressed in HEK-293 cells
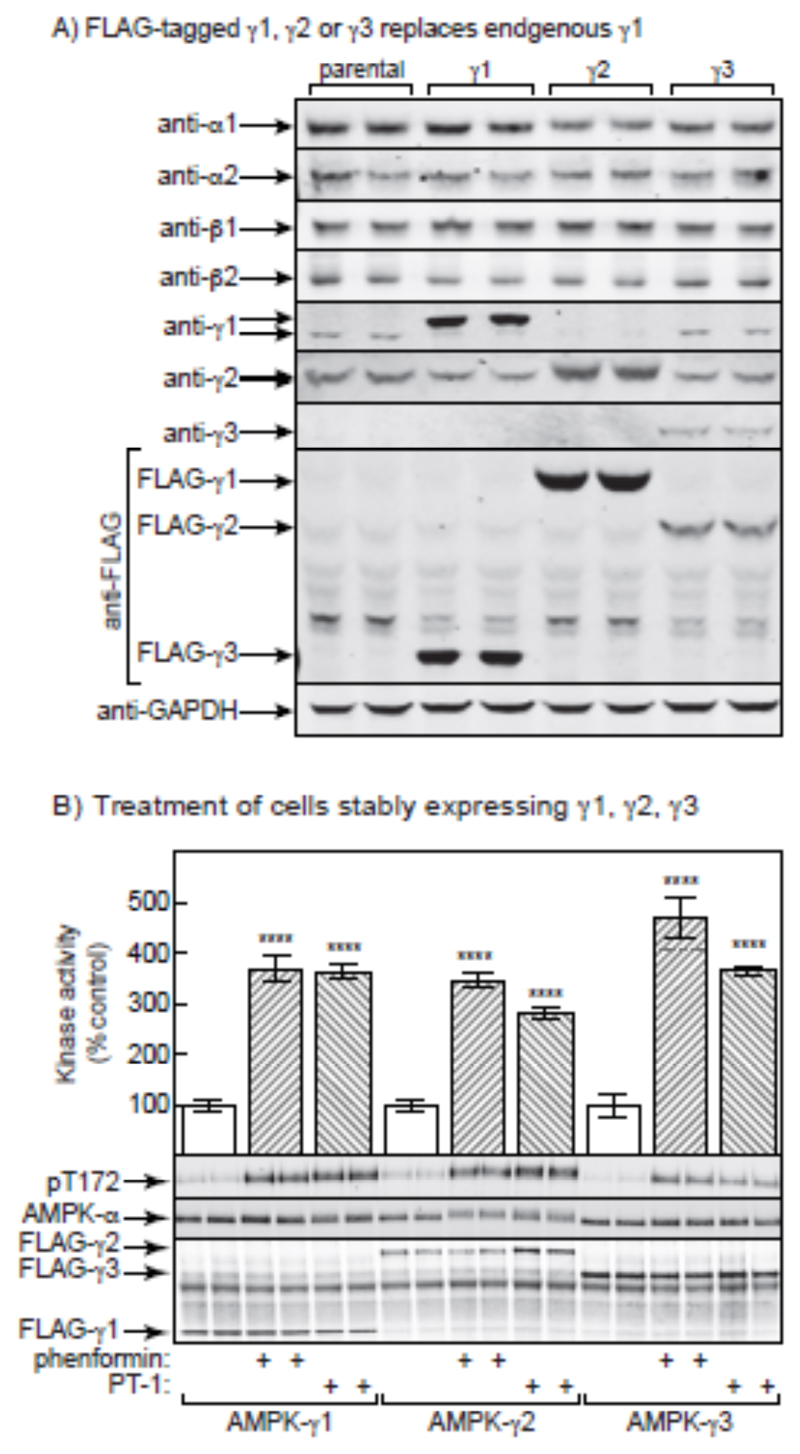
The results in the previous sections supported the idea that PT-1 did not activate AMPK directly by binding between the KD and AID, but instead indirectly by inhibiting the respiratory chain. Since all of the residues involved in binding of adenine nucleotides to the γ subunit [45] are conserved in the sequences of γ1, γ2 and γ3, our findings that PT-1 was a selective activator of γ1 complexes in mouse skeletal muscle remained puzzling. To test whether this apparent selectivity was an intrinsic feature of the γ subunit isoforms or was specific to skeletal muscle, we generated isogenic HEK-293 cells expressing tetracycline-inducible FLAG-tagged human γ1, γ2 or γ3 isoforms. Fig. 8A shows that, after tetracycline induction, the FLAG-tagged γ subunits partially, but not completely, replaced the endogenous γ1 subunit. The expression of endogenous γ1 (which has a higher mobility on SDS-PAGE than the FLAG-γ1) decreased in the cells expressing FLAG-γ1 and FLAG-γ2, although the effect was less obvious in the cells expressing FLAG-γ3, which was expressed at lower levels as judged by the anti-FLAG blots. The expression of endogenous γ2 was also slightly decreased in the cells expressing FLAG-γ1 and FLAG-γ3, but the expression of endogenous α1, α2, β1, and β2 did not change significantly. We next treated tetracycline-induced cells with PT-1 or another AMPK activator, phenformin, and immunoprecipitated AMPK using anti-FLAG antibodies prior to kinase assay or Western blotting. The Western blots probed with anti-FLAG antibody in Fig. 5B show that approximately equal amounts of the FLAG-tagged γ1, γ2 and γ3 complexes (due to variable N-terminal regions, these isoforms vary markedly in size) were precipitated. However, in contrast to the results obtained in skeletal muscle, the kinase assays on FLAG-tagged AMPK isoforms showed that PT-1 and phenformin activated γ1, γ2 and γ3 complexes to similar extents. AICAR was not used for the HEK-293 cell experiments because it is a poor activator of AMPK in this cell type. This was associated in every case with large increases in Thr172 phosphorylation. Since the expressed recombinant γ subunits only partially replaced the endogenous γ1 and γ2 subunits in these cells, we did not attempt to study the phosphorylation of downstream targets of AMPK.
Figure 8.
Phenformin and PT-1 are equally effective in stimulating the activity of AMPK complexes containing γ1, γ2 and γ3 in HEK-293 cells. (A) Characterization by Western blotting of parental HEK-293 cells and cells stably expressing either wild type -γ1, -γ2 or -γ1. Duplicate cell lysates were blotted with the indicated antibodies. (B) Bar chart showing AMPK activity measured in anti-FLAG immunoprecipitates of cells treated for 1 hr with phenformin (10 mM) or PT-1 (100 μM). Results are mean ± SD (n = 3, separate cell incubations), and results that are significantly different from the relevant control without phenformin or PT-1 (1-way ANOVA with Sidak’s multiple comparison test of selected datasets) are shown with asterisks (**** p<0.0001). The lower panels show Western blots of duplicate dishes of cells probed using anti-pT172 (top), anti-AMPK-α (centre) or anti-FLAG (bottom).
Discussion
Activators that specifically target the regulatory subunits of AMPK hold much promise in development of drugs targeted against human disorders, and as research tools to study AMPK function in vivo. Isoform-selective AMPK activation has previously been reported for the α and β subunits [22;27;36;46;49] but to our knowledge this is the first study to report a selective activation of a subset of AMPK heterotrimers containing the γ1 isoform, at least in skeletal muscle.
The mechanisms underlying the γ1-specific effects of PT-1 in skeletal muscle remain unclear. PT-1 was identified by screening a small molecule library [32] against a recombinant, truncated AMPK-α1 subunit (residues 1-394), which contains the KD and AID plus part of the linker connecting the AID to the C-terminal domain. This construct, when phosphorylated on Thr172, was much less active than a construct (1-311) containing the KD only [8;32]. The lead compound PT-1 was found to increase the activity of the 1-394 construct, which also held true for the equivalent α2 construct (1-398), as well as a smaller α1 construct (1-335) containing only the KD and AID, and a full-length α1β1γ1 complex [32]. Other analyses also suggested that PT-1 bound in the cleft between the KD and AID, causing a conformational change that relieves auto-inhibition [32]. However, in our incubated mouse muscle system PT-1 did not activate all AMPK complexes. Although it activated all γ1-containing complexes (containing α1 or α2, with either β1 or β2), it failed to activate the a2β2γ3 complex, which has previously been proposed to play a special role in increasing glucose transport in response to muscle contraction, based on the requirement of α2, β2 and γ3 for AICAR-stimulated glucose transport [2;25;39].
Since it was difficult to envisage how the effect of an activator that bound between the KD and the AID would be affected by the identity of the γ subunit, we re-investigated the mechanism by which PT-1 activated AMPK. We constructed HEK-293 cells expressing either wild type human γ1 or γ1 with an R299G mutation. This mutation abolishes the positive charge on a side chain involved in the interaction with the phosphate group of AMP in the critical regulatory site on the γ subunits, site 3 [45–47]. We expected that the R299G mutation in γ1, like the equivalent mutation in γ2 [21], would render AMPK insensitive to drugs that activate AMPK by inhibiting mitochondrial ATP synthesis and increasing cellular AMP. This was indeed confirmed using treatment with berberine, a known inhibitor of Complex I of the respiratory chain [43]. However, to our surprise, PT-1 failed to fully activate AMPK in cells expressing the RG mutation, and also increased cellular ADP:ATP and AMP:ATP ratios, suggesting that it acted by increasing cellular AMP and/or ADP. In addition, over the same concentration range PT-1 inhibited cellular oxygen uptake. Since the uncoupler dinitrophenol failed to reverse the inhibition of oxygen uptake using the highest concentrations of PT-1, the effect on oxygen uptake appears to be due to inhibition of the respiratory chain, rather than the mitochondrial ATP synthase. In the cells expressing the RG mutation, there did appear to be a very small residual activation of AMPK, and perhaps also increased Thr172 phosphorylation, by PT-1 (Fig. 5C/D), indicating that PT-1 might be acting by another minor mechanism in addition to its effects on cellular AMP and ADP. However, we could find no evidence (Fig. 7) that PT-1 directly activated AMPK in cell-free assays as suggested by Pang et al [32], using either a KD:AID (1-333) construct of human AMPK-α1, or native AMPK purified from rat liver, which is a mixture of α1β1γ1 and α2β1γ1 heterotrimers. All that we observed was an inhibition at concentrations above 10 μM; since this also occurred with the 1-312 construct that contained only the kinase domain, this was likely to be due to binding of PT-1 to the catalytic site.
Since our results were very different to those reported previously [20], we analyzed our commercial preparation of PT1 by mass spectrometry and NMR spectroscopy. The results were identical with those reported previously, indicating that the compound was, as expected, a mixture of the amino and imino tautomers [48]; the purity was estimated to be >98%. At present, the discrepancies between our results and previous results with PT-1 [32] are difficult to explain. The original authors recently reported that PT-1 was not an effective AMPK activator in vivo due to its poor bio-availability, and have developed a new activator, C24, which appears to bind between the KD and AID [28;48]. Although apparently derived by systematic modifications of PT-1, its structure is in fact quite different.
Although our results showed that PT-1 was selective for γ1- rather than γ3-containing complexes in mouse skeletal muscle incubated ex vivo, in HEK-293 cells expressing γ1-, γ2- or γ3-complexes it activated all three complexes, and increased the phosphorylation of all three on Thr172. Thus, the apparent selectivity of PT-1 for γ1 over γ3 complexes in skeletal muscle appears to be a specific feature of that tissue, rather than being an intrinsic feature of the γ subunit isoforms themselves. One potential explanation is that AMPK complexes containing γ1 or γ3 are targeted to distinct subcellular compartments in skeletal muscle. Inhibition of the respiratory chain (and hence mitochondrial ATP synthesis) might increase AMP:ATP and/or ADP:ATP ratios only in the compartment where γ1 complexes are localized, whereas increased turnover of ATP during muscle contraction may increase AMP:ATP and/or ADP:ATP ratios only in the compartment where the α2β2γ3 complex is localized, explaining why this is the only complex rapidly activated by high intensity exercise [4]. In fact, previous studies support the idea that the γ isoforms may target AMPK heterotrimers to different subcellular compartments [15;34;35]. In mouse skeletal muscle, γ1 complexes have been reported to be localized to the Z-disks, and γ3 complexes to the I-band [34].
Irrespective of the explanation for selective activation of γ1- over γ3-containing complexes in muscle, our data indicate that PT-1 can be used to distinguished between substrates of γ1 and γ3 AMPK in mouse skeletal muscle. For instance, Ser212 on ACC2 is predominantly a target of AMPK complexes containing γ3 rather than γ1. The major γ3-containing complex in both mouse and human muscle is α2β2γ3 [4;41]. Our results are consistent with studies of exercise in humans, where short-duration, high-intensity cycling increased the activity of the α2β2γ3 complex but not γ1-containing complexes in vastus lateralis, correlating with phosphorylation of ACC2 on the site equivalent to Ser212 [4;42]. A similar validation has been made for TBC1D1 Ser231 [10] and we have unpublished data showing that 15 min of high-intensity bicycle exercise in humans, expected to activate predominantly the α2β2γ3 complex, potently stimulates Raptor Ser792 phosphorylation (M. Kleinert, T.E. Jensen and E.A. Richter – unpublished observation). In contrast, our data indicate that the autophagy-regulating AMPK site on ULK1 Ser555 might be a γ1 AMPK site, which intuitively seems consistent with the delayed increase in γ1 AMPK activity during human exercise. Importantly, an earlier study reported that over-expression of an activating R70Q γ1 AMPK mutation in mouse muscle increased phosphorylation of Ser212 on ACC2 [3], similar to over-expression of an activated γ3 mutant (R225Q) [2]. Since acute activation of endogenous γ1 complexes did not increase ACC2 phosphorylation in the present study, this suggests that the ACC2 phosphorylation observed with the activated γ1 mutant may have been an artefact, perhaps because the over-expressed γ1 complex locates to a subcellular compartment where endogenous γ1 complexes are not found.
In summary, PT-1 selectively stimulated the activity of AMPK complexes containing γ1, but not γ3 in mouse skeletal muscle, and also failed to promote ACC2 phosphorylation, TBC1D1 phosphorylation and glucose transport. However, this selectivity is a specific feature of skeletal muscle, since no isoform selectivity was observed when γ1, γ2 and γ3 were expressed in HEK-293 cells. Despite this, this compound may aid in identifying new substrates and roles of γ1 complexes in skeletal muscle. We also report that PT-1 activates AMPK in HEK-293 cells (and presumably also therefore in skeletal muscle) not by relieving inhibition of the kinase domain by the auto-inhibitory domain as previously proposed, but by inhibiting the mitochondrial respiratory chain and increasing cellular AMP and/or ADP levels.
Summary statement.
PT-1 activates γ1- but not γ3-containing AMPK complexes in mouse muscle, while activating all three γ isoforms in HEK-293 cells. PT-1 activates AMPK not by direct binding to α subunits, but by inhibiting the respiratory chain and increasing cellular AMP.
Acknowledgements
We thank Janne R. Hingst for allowing us to verify the TBC1D1 Ser231 antibody on his immunoprecipitations of TBC1D1 and TBC1D4 and Jesper B. Birk for measuring AMPK activity in the mouse muscle lysates.
Funding
This study was supported by grants from the Weimann foundation, NovoNordisk Foundation and Danish Research Council to TEJ and by grants to EAR from the Danish Medical Research Council, The Lundbeck Foundation and NovoNordisk Foundation. FAR and DGH were supported by a Senior Investigator Award from the Wellcome Trust.
Footnotes
Author contribution
TEJ, EAR, DGH designed research, TEJ, FAR, LS, MK and JRK performed research, TEJ, FAR analyzed data, TEJ and DGH wrote the paper with input from all co-authors.
References
- 1.Arad M, Seidman CE, Seidman JG. Circ Res. 2007;100:474–488. doi: 10.1161/01.RES.0000258446.23525.37. [DOI] [PubMed] [Google Scholar]
- 2.Barnes BR, Marklund S, Steiler TL, Walter M, Hjalm G, Amarger V, Mahlapuu M, Leng Y, Johansson C, Galuska D, Lindgren K, et al. J Biol Chem. 2004;279:38441–38447. doi: 10.1074/jbc.M405533200. [DOI] [PubMed] [Google Scholar]
- 3.Barre L, Richardson C, Hirshman MF, Brozinick J, Fiering S, Kemp BE, Goodyear LJ, Witters LA. Am J Physiol Endocrinol Metab. 2007;292:E802–E811. doi: 10.1152/ajpendo.00369.2006. [DOI] [PubMed] [Google Scholar]
- 4.Birk JB, Wojtaszewski JF. J Physiol. 2006;577:1021–1032. doi: 10.1113/jphysiol.2006.120972. [DOI] [PMC free article] [PubMed] [Google Scholar]
- 5.Carling D, Thornton C, Woods A, Sanders MJ. Biochem J. 2012;445:11–27. doi: 10.1042/BJ20120546. [DOI] [PubMed] [Google Scholar]
- 6.Cheung PC, Salt IP, Davies SP, Hardie DG, Carling D. Biochem J. 2000;346(Pt 3):659–669. [PMC free article] [PubMed] [Google Scholar]
- 7.Corton JM, Gillespie JG, Hawley SA, Hardie DG. Eur J Biochem. 1995;229:558–565. doi: 10.1111/j.1432-1033.1995.tb20498.x. [DOI] [PubMed] [Google Scholar]
- 8.Crute BE, Seefeld K, Gamble J, Kemp BE, Witters LA. J Biol Chem. 1998;273:35347–35354. doi: 10.1074/jbc.273.52.35347. [DOI] [PubMed] [Google Scholar]
- 9.Davies SP, Carling D, Hardie DG. Eur J Biochem. 1989;186:123–128. doi: 10.1111/j.1432-1033.1989.tb15185.x. [DOI] [PubMed] [Google Scholar]
- 10.Frosig C, Pehmoller C, Birk JB, Richter EA, Wojtaszewski JF. J Physiol. 2010;588:4539–4548. doi: 10.1113/jphysiol.2010.194811. [DOI] [PMC free article] [PubMed] [Google Scholar]
- 11.Fullerton MD, Galic S, Marcinko K, Sikkema S, Pulinilkunnil T, Chen ZP, O'Neill HM, Ford RJ, Palanivel R, O'Brien M, Hardie DG, et al. Nat Med. 2013;19:1649–1654. doi: 10.1038/nm.3372. [DOI] [PMC free article] [PubMed] [Google Scholar]
- 12.Gollob MH, Seger JJ, Gollob TN, Tapscott T, Gonzales O, Bachinski L, Roberts R. Circulation. 2001;104:3030–3033. doi: 10.1161/hc5001.102111. [DOI] [PubMed] [Google Scholar]
- 13.Goransson O, McBride A, Hawley SA, Ross FA, Shpiro N, Foretz M, Viollet B, Hardie DG, Sakamoto K. J Biol Chem. 2007;282:32549–32560. doi: 10.1074/jbc.M706536200. [DOI] [PMC free article] [PubMed] [Google Scholar]
- 14.Gowans GJ, Hawley SA, Ross FA, Hardie DG. Cell Metab. 2013;18:556–566. doi: 10.1016/j.cmet.2013.08.019. [DOI] [PMC free article] [PubMed] [Google Scholar]
- 15.Gregor M, Zeold A, Oehler S, Marobela KA, Fuchs P, Weigel G, Hardie DG, Wiche G. J Cell Sci. 2006;119:1864–1875. doi: 10.1242/jcs.02891. [DOI] [PubMed] [Google Scholar]
- 16.Hardie DG. Diabetes. 2013;62:2164–2172. doi: 10.2337/db13-0368. [DOI] [PMC free article] [PubMed] [Google Scholar]
- 17.Hardie DG. Annu Rev Nutr. 2014;34:31–55. doi: 10.1146/annurev-nutr-071812-161148. [DOI] [PMC free article] [PubMed] [Google Scholar]
- 18.Hardie DG, Ashford ML. Physiology (Bethesda) 2014;29:99–107. doi: 10.1152/physiol.00050.2013. [DOI] [PMC free article] [PubMed] [Google Scholar]
- 19.Hardie DG, Salt IP, Davies SP. Methods Mol Biol. 2000;99:63–74. doi: 10.1385/1-59259-054-3:63. [DOI] [PubMed] [Google Scholar]
- 20.Hawley SA, Davison M, Woods A, Davies SP, Beri RK, Carling D, Hardie DG. J Biol Chem. 1996;271:27879–27887. doi: 10.1074/jbc.271.44.27879. [DOI] [PubMed] [Google Scholar]
- 21.Hawley SA, Ross FA, Chevtzoff C, Green KA, Evans A, Fogarty S, Towler MC, Brown LJ, Ogunbayo OA, Evans AM, Hardie DG. Cell Metab. 2010;11:554–565. doi: 10.1016/j.cmet.2010.04.001. [DOI] [PMC free article] [PubMed] [Google Scholar]
- 22.Hunter RW, Foretz M, Bultot L, Fullerton MD, Deak M, Ross FA, Hawley SA, Shpiro N, Viollet B, Barron D, Kemp BE, et al. Chem Biol. 2014;21:866–879. doi: 10.1016/j.chembiol.2014.05.014. [DOI] [PMC free article] [PubMed] [Google Scholar]
- 23.Jensen TE, Leutert R, Rasmussen ST, Mouatt JR, Christiansen ML, Jensen BR, Richter EA. PLoS ONE. 2012;7:e31054. doi: 10.1371/journal.pone.0031054. [DOI] [PMC free article] [PubMed] [Google Scholar]
- 24.Jorgensen SB, Nielsen JN, Birk JB, Olsen GS, Viollet B, Andreelli F, Schjerling P, Vaulont S, Hardie DG, Hansen BF, Richter EA, et al. Diabetes. 2004;53:3074–3081. doi: 10.2337/diabetes.53.12.3074. [DOI] [PubMed] [Google Scholar]
- 25.Jørgensen SB, Viollet B, Andreelli F, Frosig C, Birk JB, Schjerling P, Vaulont S, Richter EA, Wojtaszewski JFP. J Biol Chem. 2004;279:1070–1079. doi: 10.1074/jbc.M306205200. [DOI] [PubMed] [Google Scholar]
- 26.Kim M, Hunter RW, Garcia-Menendez L, Gong G, Yang YY, Kolwicz SC, Jr, Xu J, Sakamoto K, Wang W, Tian R. Circ Res. 2014;114:966–975. doi: 10.1161/CIRCRESAHA.114.302364. [DOI] [PMC free article] [PubMed] [Google Scholar]
- 27.Lai YC, Kviklyte S, Vertommen D, Lantier L, Foretz M, Viollet B, Hallen S, Rider MH. Biochem J. 2014;460:363–375. doi: 10.1042/BJ20131673. [DOI] [PubMed] [Google Scholar]
- 28.Li YY, Yu LF, Zhang LN, Qiu BY, Su MB, Wu F, Chen DK, Pang T, Gu M, Zhang W, Ma WP, et al. Toxicol Appl Pharmacol. 2013;273:325–334. doi: 10.1016/j.taap.2013.09.006. [DOI] [PubMed] [Google Scholar]
- 29.Merry TL, Steinberg GR, Lynch GS, McConell GK. Am J Physiol Endocrinol Metab. 2010;298:E577–E585. doi: 10.1152/ajpendo.00239.2009. [DOI] [PubMed] [Google Scholar]
- 30.Mu J, Brozinick JT, Jr, Valladares O, Bucan M, Birnbaum MJ. Mol Cell. 2001;7:1085–1094. doi: 10.1016/s1097-2765(01)00251-9. [DOI] [PubMed] [Google Scholar]
- 31.Pang T, Xiong B, Li JY, Qiu BY, Jin GZ, Shen JK, Li J. J Biol Chem. 2007;282:495–506. doi: 10.1074/jbc.M605790200. [DOI] [PubMed] [Google Scholar]
- 32.Pang T, Zhang ZS, Gu M, Qiu BY, Yu LF, Cao PR, Shao W, Su MB, Li JY, Nan FJ, Li J. J Biol Chem. 2008;283:16051–16060. doi: 10.1074/jbc.M710114200. [DOI] [PMC free article] [PubMed] [Google Scholar]
- 33.Pehmoller C, Treebak JT, Birk JB, Chen S, MacKintosh C, Hardie DG, Richter EA, Wojtaszewski JF. Am J Physiol Endocrinol Metab. 2009;297:E665–E675. doi: 10.1152/ajpendo.00115.2009. [DOI] [PMC free article] [PubMed] [Google Scholar]
- 34.Pinter K, Grignani RT, Watkins H, Redwood C. J Muscle Res Cell Motil. 2013;34:369–378. doi: 10.1007/s10974-013-9359-4. [DOI] [PMC free article] [PubMed] [Google Scholar]
- 35.Pinter K, Jefferson A, Czibik G, Watkins H, Redwood C. Cell Cycle. 2012;11:917–921. doi: 10.4161/cc.11.5.19412. [DOI] [PMC free article] [PubMed] [Google Scholar]
- 36.Scott JW, van Denderen BJ, Jorgensen SB, Honeyman JE, Steinberg GR, Oakhill JS, Iseli TJ, Koay A, Gooley PR, Stapleton D, Kemp BE. Chem Biol. 2008;15:1220–1230. doi: 10.1016/j.chembiol.2008.10.005. [DOI] [PubMed] [Google Scholar]
- 37.Steinberg GR, Dandapani M, Hardie DG. Trends Endocrinol Metab. 2013;24:481–487. doi: 10.1016/j.tem.2013.06.002. [DOI] [PMC free article] [PubMed] [Google Scholar]
- 38.Steinberg GR, Kemp BE. Physiol Rev. 2009;89:1025–1078. doi: 10.1152/physrev.00011.2008. [DOI] [PubMed] [Google Scholar]
- 39.Steinberg GR, O'Neill HM, Dzamko NL, Galic S, Naim T, Koopman R, Jorgensen SB, Honeyman J, Hewitt K, Chen ZP, Schertzer JD, et al. J Biol Chem. 2010;285:37198–37209. doi: 10.1074/jbc.M110.102434. [DOI] [PMC free article] [PubMed] [Google Scholar]
- 40.Taylor EB, An D, Kramer HF, Yu H, Fujii NL, Roeckl KS, Bowles N, Hirshman MF, Xie J, Feener EP, Goodyear LJ. J Biol Chem. 2008;283:9787–9796. doi: 10.1074/jbc.M708839200. [DOI] [PMC free article] [PubMed] [Google Scholar]
- 41.Treebak JT, Birk JB, Hansen BF, Olsen GS, Wojtaszewski JF. Am J Physiol Cell Physiol. 2009;297:C1041–C1052. doi: 10.1152/ajpcell.00051.2009. [DOI] [PubMed] [Google Scholar]
- 42.Treebak JT, Birk JB, Rose AJ, Kiens B, Richter EA, Wojtaszewski JF. Am J Physiol Endocrinol Metab. 2006:00380. doi: 10.1152/ajpendo.00380.2006. [DOI] [PubMed] [Google Scholar]
- 43.Turner N, Li JY, Gosby A, To SW, Cheng Z, Miyoshi H, Taketo MM, Cooney GJ, Kraegen EW, James DE, Hu LH, et al. Diabetes. 2008;57:1414–1418. doi: 10.2337/db07-1552. [DOI] [PubMed] [Google Scholar]
- 44.Woods A, Salt I, Scott J, Hardie DG, Carling D. FEBS Lett. 1996;397:347–351. doi: 10.1016/s0014-5793(96)01209-4. [DOI] [PubMed] [Google Scholar]
- 45.Xiao B, Heath R, Saiu P, Leiper FC, Leone P, Jing C, Walker PA, Haire L, Eccleston JF, Davis CT, Martin SR, et al. Nature. 2007;449:496–500. doi: 10.1038/nature06161. [DOI] [PubMed] [Google Scholar]
- 46.Xiao B, Sanders MJ, Carmena D, Bright NJ, Haire LF, Underwood E, Patel BR, Heath RB, Walker PA, Hallen S, Giordanetto F, et al. Nat Commun. 2013;4:3017. doi: 10.1038/ncomms4017. [DOI] [PMC free article] [PubMed] [Google Scholar]
- 47.Xiao B, Sanders MJ, Underwood E, Heath R, Mayer FV, Carmena D, Jing C, Walker PA, Eccleston JF, Haire LF, Saiu P, et al. Nature. 2011;472:230–233. doi: 10.1038/nature09932. [DOI] [PMC free article] [PubMed] [Google Scholar]
- 48.Yu LF, Li YY, Su MB, Zhang M, Zhang W, Zhang LN, Pang T, Zhang RT, Liu B, Li JY, Li J, et al. ACS Med Chem Lett. 2013;4:475–480. doi: 10.1021/ml400028q. [DOI] [PMC free article] [PubMed] [Google Scholar]
- 49.Zadra G, Photopoulos C, Tyekucheva S, Heidari P, Weng QP, Fedele G, Liu H, Scaglia N, Priolo C, Sicinska E, Mahmood U, et al. EMBO Mol Med. 2014;6:519–538. doi: 10.1002/emmm.201302734. [DOI] [PMC free article] [PubMed] [Google Scholar]


