Abstract
The question of stem cell control is at the center of our understanding of tissue functioning, both in healthy and cancerous conditions. It is well accepted that cellular fate decisions (such as divisions, differentiation, apoptosis) are orchestrated by a network of regulatory signals emitted by different cell populations in the lineage and the surrounding tissue. The exact regulatory network that governs stem cell lineages in a given tissue is usually unknown. Here we propose an algorithm to identify a set of candidate control networks that are compatible with (a) measured means and variances of cell populations in different compartments, (b) qualitative information on cell population dynamics, such as the existence of local controls and oscillatory reaction of the system to population size perturbations, and (c) statistics of correlations between cell numbers in different compartments. Using the example of human colon crypts, where lineages are comprised of stem cells, transit amplifying cells, and differentiated cells, we start with a theoretically known set of 32 smallest control networks compatible with tissue stability. Utilizing near-equilibrium stochastic calculus of stem cells developed earlier, we apply a series of tests, where we compare the networks’ expected behavior with the observations. This allows us to exclude most of the networks, until only three, very similar, candidate networks remain, which are most compatible with the measurements. This work demonstrates how theoretical analysis of control networks combined with only static biological data can shed light onto the inner workings of stem cell lineages, in the absence of direct experimental assessment of regulatory signaling mechanisms. The resulting candidate networks are dominated by negative control loops and possess the following properties: (1) stem cell division decisions are negatively controlled by the stem cell population, (2) stem cell differentiation decisions are negatively controlled by the transit amplifying cell population.
1 Introduction
The stem cell lineage is a basic unit of hierarchical tissues and as such it has attracted the attention of both experimental biologists, and mathematical/computational modelers. The question of stem cell control is at the center of our understanding of tissue (mal-) functioning. Every day, cells in hierarchical tissues perform their specific functions and die to be replaced by new cell divisions. This process is stochastic in nature (see e.g. Wagers et al. (2002); Arai (2016)), and involves very large numbers of cellular events. The cells involved in the functioning and renewal of an organ differ from each other by their division and apoptosis capabilities, as well as the types of signals they send and the kinds of cell fate decisions they make.
In Komarova (2013) we developed a framework of reasoning about stem cell signaling networks. Let us suppose that there are three compartments in a set cell lineage: stem cells (SCs), transit amplifying cells (TACs) and differentiated cells (DCs). In the colon and intestinal crypts, as well as other structures, these are linearly ordered with SC at the bottom, DC cells at the top, and TAC in between. In order to maintain the number of each cell type, the rate of removal of the DCs from the top is balanced by division and differentiation of the SCs and TACs below.
Each cellular compartment may receive signals from other compartments (as well as from its own cells), which influence the rate of differentiation and proliferation. For example, having too few DCs may call for the need of faster differentiation of TACs into DCs. This faster differentiation of TACs may be achieved by relieving the negative control on the probability of TACs to differentiate exerted by DCs. Many molecules produced by these cells have been detected (Gregorieff et al., 2005; Kosinski et al., 2007; Hsieh, 2012), but their role in each step of the regulatory network is yet to be completely determined (Crosnier et al., 2006; Medema and Vermeulen, 2011).
Theoretically, each cell population may influence (in a negative or positive way) each of the processes that happen in the system, which gives rise to a very large number of networks of cellular control. In Komarova (2013) we examined such controls from the (linear) stability point of view. We called the stable networks with the smallest possible number of loops the “minimal networks”. In a three-compartment system, assume that the following five processes can be controlled: divisions of SCs and TACs, differentiations of SCs and TACs, and death of DCs. It turns out that in this case, the smallest number of control loops is three, and there are exactly 32 different three-loop control networks that are stable. These 32 stable networks have different topologies and different signs of control loops (positive or negative).
In the present paper we are interested in determining the most likely control network(s) that govern the regulation of human colon crypt stem cell lineages. While the analysis of Komarova (2013) restricts the total number of possibilities to 20 (plus additional 12 networks with non constant DC death terms), the analysis did not indicate which of the 32 were most likely to describe the regulation in a real biological system.
We have now determined the most likely regulatory network(s), among the 32 three-compartment stable networks, by using actual measurements of the number of SCs, TACs, and DCs in biopsies of human colon crypts, and additional mathematical methodology. Bravo and Axelrod (2013) performed detailed measurements of the number of each of the three cell types (SCs, TACs, DCs) in 49 colon crypts in human biopsy specimens. In this paper we will examine each of the 32 possible networks (including the 20 networks explicitly presented in Komarova (2013) plus 12 additional ones) to determine whether it can produce the correct measured means and variances of cell population numbers. In addition to this static information we have also used data on the dynamics of injury recovery, as well as experimentally obtained intracrypt correlations. Using these criteria, a selection algorithm was devised that identified three of the 32 possible control networks as most likely the ones corresponding to the regulation of homeostasis of human colon crypts.
This paper contributes to the growing literature on the theory of stem cells, which ranges from ODE modeling (Stiehl and Marciniak-Czochra, 2011; Nakata et al., 2012) to stochastic modeling (Enderling et al., 2007, 2009a,b,c; Dingli et al., 2007), and includes research of stem cells in the context of feedback mechanisms (Lander et al., 2009; Youssefpour et al., 2012; Konstorum et al., 2016; Kunche et al., 2016), carcinogenesis (Yatabe et al., 2001; Hardy and Stark, 2002; Ganguly and Puri, 2006; Johnston et al., 2007; Ganguly and Puri, 2007; Boman et al., 2008; Ashkenazi et al., 2007, 2008; Enderling and Hahnfeldt, 2011), modeling hematopoietic SC dynamics (Glauche et al., 2007; Marciniak-Czochra et al., 2009; Foo et al., 2009; Stiehl and Marciniak-Czochra, 2012), and cancer stem cells (Dingli and Michor, 2006; Johnston et al., 2010; Enderling and Hahnfeldt, 2011; Hillen et al., 2013; Scott et al., 2014; Enderling, 2015).
2 Materials and Methods
2.1 Data Description
We have measured the number and location of dividing cells (Ki-67 positively stained cells) and non-dividing cells (Ki-67 non-stained cells) in 49 colon crypts in human biopsy specimens. The non-dividing cells at the bottom of the crypt are considered quiescent stem cells, the non-dividing cells in the top two-thirds of the crypt are considered differentiated cells. The dividing cells near the bottom third of the crypt are considered to consist of transient amplifying cells and active stem cells (Li and Clevers, 2010). The experimental details of the source of the specimens, measurement of each cell type, and determination of reliability of measurements, have previously been described (Bravo and Axelrod, 2013). The measurements are included in the supplement to this article.
For our model we need an approximate distribution of active cells into active stem cells and transit amplifying cells. This can be done by using experimental observations, as described below. Li and Clevers (2010) have reviewed evidence for the existence of quiescent stem cells at the bottom of the crypt and, in addition, of active stem cells among the dividing cells above the bottom. The existence of a quiescent stem cell population is consistent with the observation that mTert-expressing slowly cycling cells are resistant to intestinal injury and function in intestinal regeneration (Montgomery et al., 2011). And the existence of an active stem cell population is consistent with the observation that rapidly cycling Lgr5+ cells are highly sensitive to intestinal damage (Barker et al., 2007). We will denote the fraction of dividing cells that are active stem cells as W, and the fraction of active cells that are transient amplifying cells as (1 − W). The value of W can be estimated using the following considerations.
Cells staining positive for various stem cell markers (Musashi-1, Bmi1, Lgr5, Lrig1) have been observed in the region of dividing cells in the small intestine of the mouse (Potten et al., 2003; Muñoz et al., 2012; Barker et al., 2007; Powell et al., 2012).
W, the proportion of active stem cells among all of the dividing cells in human colon crypts, can be determined from data available about human colon crypts stained with the stem cell marker Musashi-1, and stained separately with the proliferating cell marker Ki-67.
The percentages of Musashi-1 positively staining cells at different positions in the human colon crypt were reported in Nishimura et al. (2003) figure 4. According to this study, 69% of all positively staining cells are in positions 1–7 at the bottom of the crypt, and 31% of all positively staining cells are in positions 8 and above. Bravo and Axelrod (2013) have reported, in Table 1, the number of Ki-67 positively and negatively staining cells at different positions of the human colon crypt. The average number of negatively staining cells in positions 1–7, is 35.7 ± 36.3 s.d.1, and the average number of positively stained cells in positions 8 and above is 623.9 ± 234.1 s.d. The negatively stained cells at the bottom of the crypt are considered quiescent stem cells. The positively stained cells are considered to comprise all of the dividing cells, including both active stem cells and transient amplifying cells.
Figure 4.
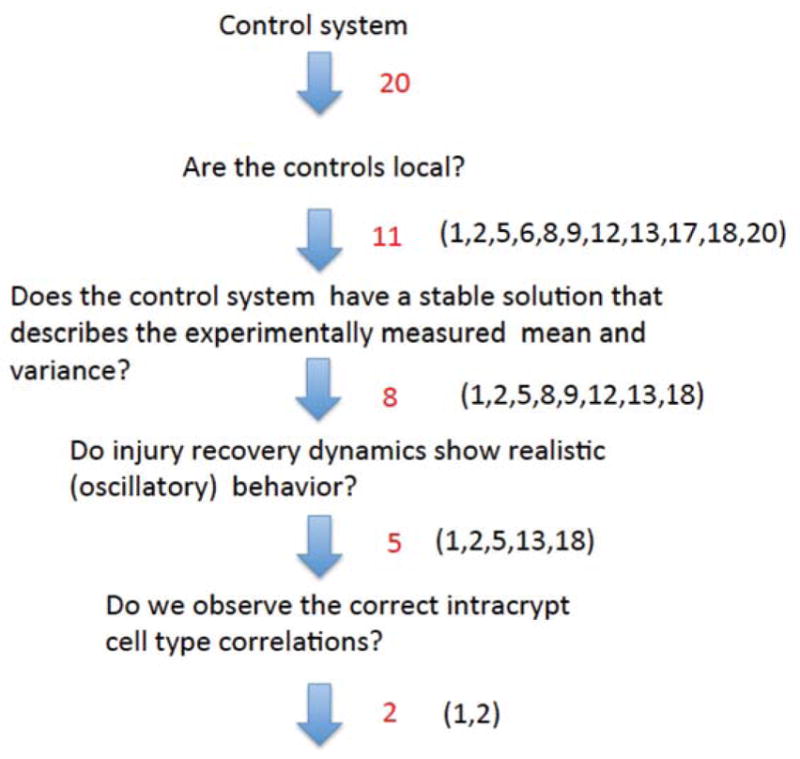
The outcome of the selection algorithm for the constant death networks of figure 2 with W = 0.03.
Table 1.
Notations used to calculate W, the fraction of active SCs.
| %SCq | The percentage of all of the stem cells that are at the bottom of the crypt, e.g. quiescent stem cells |
| %SCa | The percentage of all of the stem cells that are above the bottom of the crypt, e.g. active stem cells in the region of dividing cells |
| #SCq | The number of quiescent stem cells at the bottom of the crypt |
| #SCa | The number of active stem cells above the bottom of the crypt in the region of dividing cells |
| #Ki67+ | The total number of dividing cells |
The probability distribution for the values of W, as well as the lower and upper bounds of W, can be determined. Using the notations defined in table 1, the number of active stem cells is given by
and the parameter W can be calculated as follows:
| (1) |
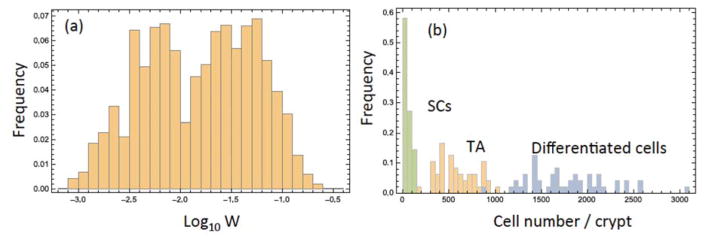
The first quotient in the right hand side of this expression can be calculated from the data of Bravo and Axelrod (2013), and the second quotient from Nishimura et al. (2003). The probability distribution of the estimated values of W are shown in figure 1(a). It was approximated numerically using all the realizations of the cell numbers measured experimentally in Bravo and Axelrod (2013). The mean of this distribution corresponds to W = 0.03, the value used in the calculations presented here, unless otherwise noted. In figure 1(b) we show the frequency histograms of the three cell types obtained from the data by Bravo and Axelrod (2013) using W = 0.03; again, this was created using all the experimentally obtained values of the cell numbers. We also investigated the effect of W = 0, as discussed in the last paragraph of section 3.
Figure 1.
Estimating cell numbers. (a) Histogram of the experimentally calculated values of W, equation (1). The apparent bimodality of the distribution may be ascribed to the relative scarcity of the data, because the distribution on a non-logarithmic scale does not appear bimodal. (b) Histograms showing the distribution of cell numbers per crypt, by cell type, where W = 0.03 was assumed.
2.2 Stochastic model formulation
Consider a three-compartment model consisting of stem cells (SCs), transient amplifying cells (TACs), and differentiated cells (DCs). We will refer to the number of stem cells as I1, the number of transient amplifying cells as I2, and the number of differentiated cells as I3. We assume only symmetric divisions of stem cells, see section Results and Discussion, and employ a Poisson process to describe the dynamics (Poisson processes, and a related birth-death process, are conventionally used to describe cellular processes, see e.g. Nowak (2006); Wodarz and Komarova (2014)). The cells are subject to the following changes during an infinitesimally small time-increment, Δt:
-
With probability L1(I1, I2, I3)Δt a stem cell (SC) divides.
With probability L1(I1, I2, I3)P1(I1, I2, I3)Δt a SC differentiation takes place resulting in a creation of two transient amplifying cells (TACs), (I1, I2, I3) → (I1 − 1, I2 + 2, I3).
With probability L1(I1, I2, I3)(1 − P1(I1, I2, I3))Δt a SC proliferation takes place in a creation of SC, (I1, I2, I3) → (I1 + 1, I2, I3).
-
With probability L2(I1, I2, I3)Δt a transient amplifying cell (TA) divides.
With probability L2(I1, I2, I3)P2(I1, I2, I3)Δt a TA differentiation takes place resulting in a creation of two differentiated cells (DCs), (I1, I2, I3) → (I1, I2 − 1, I3 + 2).
With probability L2(I1, I2, I3)(1 − P2(I1, I2, I3))Δt a TA proliferation takes place resulting in a creation of a TA, (I1, I2, I3) → (I1, I2 + 1, I3).
With probability D(I1, I2, I3)Δt, a differentiated cell dies, (I1, I2, I3) → (I1, I2, I3 − 1).
A deterministic model that captures these events can be expressed as the following system of ordinary differential equations:
| (2) |
| (3) |
| (4) |
The equilibrium of this system, (Ī1, Ī2, Ī3), can be obtained by solving equations (2) – (4) in steady state:
| (5) |
| (6) |
2.3 Stochastic analysis
There are five distinct processes that can take place in this system: differentiation divisions of SCs (Q1), proliferation divisions of SCs (Q2), differentiation divisions of TACs (Q3), proliferation divisions of TACs (Q4), and death (Q5). The rates of these processes are given by:
| (7) |
The stochastic description in terms of the Kolmogorov forward equation is given by the following equation for the variable φI1,I2,I3, the probability to find the system in state (I1, I2, I3) at time t:
| (8) |
where the processes of the right hand side are presented in the same order as they appear in section 2.2.
The methodology presented here was developed in Komarova (2013); Yang et al. (2015b) and is related to the linear noise approximation of Van Kampen (1992). A detailed derivation and justification can be found in Sun et al. (2016). Let us use the symbol HI1,I2,I3 to denote any of the functions L1(I1, I2, I3), L2(I1, I2, I3), P1(I1, I2, I3), P2(I1, I2, I3), and D(I1, I2, I3). Suppose that we can represent the functions HI1,I2,I3 near the equilibrium as HI1,I2,I3 = H(εI1, εI2, εI3), where the parameter ε ≪ 1 defines the weakness of the dependence of these rates on the populations that control them. Note that in this methodology, the peak of the probability distribution of the number of cells is assumed to be located near population sizes of the order 1/ε and has a width of the order of 1/ε1/2, see the derivation in Komarova (2013). While the validity of this approach has been studied extensively, see e.g. Gardiner (2004); Wallace et al. (2012), in our context it is important to note that typical fluctuations (of size 1/ε1/2) must remain sufficiently small compared with the typical population size (~ 1/ε), such that the system will remain near the equilibrium and stochastic extinction is an unlikely event (for a time-duration which grows with 1/ε). These are conditions of homeostasis in a biological system; our approximation will technically break down outside the homeostatic regime.
It is convenient to denote the continuous variables
and further shift the cell counts to be equal to zero at the equilibrium:
| (9) |
We can expand the functions HI1,I2,I3 around the equilibrium (Ī1, Ī2, Ī3) in Taylor series:
| (10) |
where the subscripts x1, x2, and x3 denote the partial derivative of the function with respect to its argument, evaluated at (Ī1, Ī2, Ī3). Terms of the order of ε2 will be dropped.
To obtain the equations for the means and variances, we will follow the stochastic calculus of stem cells methodology developed in Sun et al. (2016). The stochastic processes defined in section 2.2 can be characterized by the following cell number changes:
Q1: Differentiation of SCs, Δ1I1 = −1, Δ1I2 = 2, Δ1I3 = 0,
Q2: Proliferation of SCs, Δ2I1 = 1, Δ2I2 = 0, Δ2I3 = 0,
Q3: Differentiation of TACs, Δ3I1 = 0, Δ3I2 = −1, Δ3I3 = 2,
Q4: Proliferation of TACs, Δ4I1 = 0, Δ4I2 = 1, Δ4I3 = 0,
Q5: Death of DCs, Δ5I1 = 0, Δ5I2 = 0, Δ5I3 = −1.
Then equation (8) can be expressed as:
| (11) |
Define φ̃im,in,ik = φIm,In,Ik, and Q̃k(im, in, ik) = Qk(Im, In, Ik), then equation (11) can be rewritten as:
| (12) |
Here we use a standard technique to derive equations for the moments. Let us adopt the following notations for the first moments and the second moments of cell numbers:
We multiply both sides of Kolmogorov forward equation (12) by im and by ipiq, and sum over the indices i1, i2, i3, to obtain:
| (13) |
| (14) |
where m = 1, 2, 3 and p, q = 1, 2, 3. The right hand side of the equations is zero because we consider the equilibrium state and the time-derivatives in the Kolmogorov forward equation are zero.
Next, we use expansions (10) in equations (13–14), and truncate the expressions by keeping terms of order ε and ε2 in equations for the first and second moments respectively. This results in the following moment equations of the cell numbers:
| (15) |
| (16) |
where , and Qk* is the equilibrium of Qk.
Because of definition (9), the means ym are all zero, and solving equations (16), we can obtain the expressions for the second moments, which are equal to the cell number variances,
3 Selection Algorithm
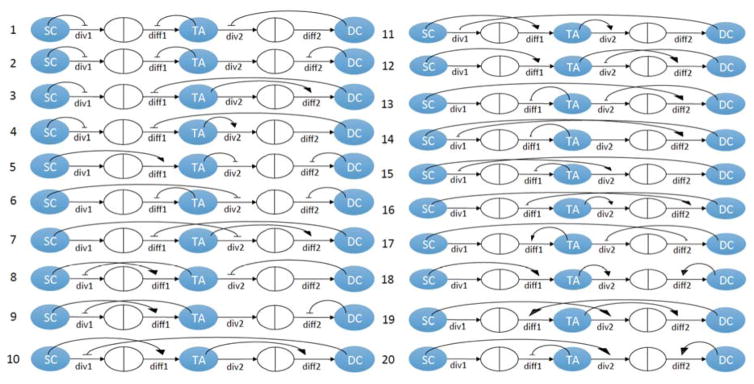
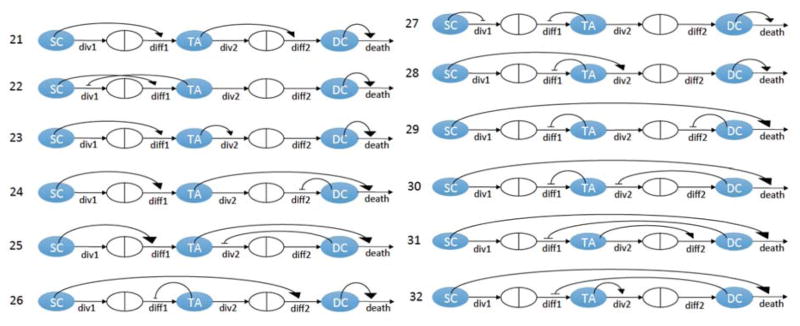
In Komarova (2013), we have identified 20 different 3-compartment minimal control networks that are compatible with stable homeostatic control, see figure 2. These networks are characterized by constant death terms. In addition, there are 12 minimal control networks with non-constant death terms, see figure 3. Regulated death terms occur in different contexts and have been modelled in the past (Mahaffy et al., 1998; Fuertinger et al., 2012; Stiehl et al., 2014b, a). All of these networks have exactly three controls (it was shown that this is the minimal number of controls compatible with stability), and include the 5 processes described in Section (2.2). We will use a selection algorithm to determine the most likely minimal control network that matches the distribution of the measured data, see figure 4. This algorithm allows us to use biological criteria to exclude many of the possible control networks depicted in figures 2, 3. It uses the data generated for the distribution of the cell numbers (see Supplement) as well as other considerations from the literature. The algorithm is demonstrated here using the 20 constant death rate networks of figure 2. The 12 networks of figure 3 are considered in Appendix C. The following is the step-by-step procedure used.
Figure 2.
Twenty 3-compartment minimal control networks identified in Komarova (2013), which are characterized with constant death rates. The three types of cells are marked by SC (stem cells), TA (transient amplifying cells), DC (differentiated cells). Horizontal arrows indicate the cell fate decisions: div1 and div2 the division process of SCs and TACs; diff1 and diff2 are the probability of the division to be a differentiation, as opposed to proliferation, for SCs and TACs respectively. The curved positive and negative arrows indicate control. The point of the arrow corresponds to the process that is being controlled, and the base of the arrow corresponds to the cell type controlling the process.
Figure 3.
Twelve additional 3-compartment minimal control networks with non-constant death rates. Notations are as in figure 2.
Choose networks with local controls
Cell-cell communication may occur by direct mechanical contact or by dispersal of molecules from a source cell. Mechanisms for the dispersal of molecules include transport through cell membranes, extracellular Brownian motion, or transport on the outer cell surface (Schier and Needleman, 2009). In each situation the effect of one cell is greatest on an adjacent cell and decreases on cells further away. Taking into account the spatial organization of the crypt, we therefore assume that SCs can only control SCs and TACs; that TACs can only control TACs, SCs, and DCs; and that DCs can only control DCs and TACs. It follows that 11 out of the 20 control networks have local controls, see figure 4. We used figure 2 to select local controls, and the results are independent of the values of W.
Choose networks with stable solution and measured means and variances
Let us assume that all the control functions are linear (or consider the linearization of nonlinear controls, see Appendix A), and the death rate of DCs is constant in our analysis (this assumption is relaxed in Appendix C). Using equations (5–6) as constraints, we define linearized control functions as
| (17) |
| (18) |
| (19) |
| (20) |
| (21) |
where coefficients a, b, and c with the appropriate subscripts are constants. Functions (17–20) are the most general linear functions compatible with identities (5–6). We however are interested in “minimal controls”, which is a restricted subset of such functions. It was shown in Komarova (2013) that for stability of a three-compartment system, it is necessary to have at least three control loops, and all three populations must be involved in the control. There are exactly 20 systems with minimal control (that is, only 3 control loops) with constant death terms, see figure 2 (the non-constant death terms are included in networks of figure 3 and analyzed in Appendix C). Each of these control networks is characterized by exactly one nonzero coefficient a, one nonzero coefficient b, and one nonzero coefficient c in system (17–20). For example, the topmost network in the left column of figure 2 contains control of SC divisions by SCs, control of SC differentiation probabilities by TACs, and control of TAC divisions by DCs. This means that the corresponding linear system of controls, equations (17–20), contains nonzero coefficients
with the rest of coefficients being zero. For each minimal control network, there are 5 unknown constants: the equilibrium values L0, D0, and the nonzero controls (a, b, c). Let us denote
where q is the ratio between the division rate of the SCs and the death rate of DCs at equilibrium. Equations (5) and (6) imply that q ∈ (0, 1/2) (since the probability P2 ≤ 1). Further, by rescaling the time unit, we can set D0 = 1. Therefore, only four unknown coefficients remain:
Let us use definitions (17–20) and solve the linear algebraic system of equations given by (16). In particular, we can obtain the expressions for the three variances y11, y22, and y33. For each control network, these expressions depend on the unknowns q, a, b, and c.
Using the data on the numbers of dividing and non-dividing cells for a given value of W, we can compute the numerical distributions of SCs, TACs, and DCs, and measure their means and variances. In this study we will focus on the case: W = 0.03 (most of the dividing cells are TACs).
Let us pick a control network, and also fix a q value; in our simulations we took q = 0.1, 0.2, 0.4, 0.5. For each q value, we have a system of equations
where the left hand sides are functions of coefficients (a, b, c) (under fixed control network and the q value), and the right hand sides are numerically measured values of the cell number variances (under the fixed value of W, the fraction of active SCs among all dividing cells). This linear system of three equations with three unknowns can be solved to find the unknown controls a, b, c, and only the networks that have real stable solutions for at least one q value will be considered. A Mathematica file is provided in the Supplement that accomplishes this task.
In conclusion, networks #6, 17, 20 do not give stable solutions, and therefore are eliminated. The other 8 listed in figure 4 give realistic stable solutions.
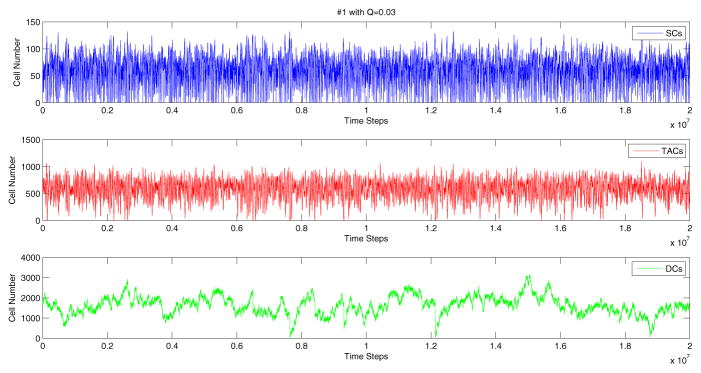
To confirm the theoretical results, for each network, we then run numerical simulations with the coefficients obtained as described above. Note that the analysis presented here is local, in the sense that only the derivatives of the control at the equilibrium can be determined. We do not have any information on the global shapes of the control functions L1(I1, I2, I3), L2(I1, I2, I3), etc. A numerical simulation requires further assumptions on the actual functional form for all the four control functions. The simplest way is to use linear functions, equations (17–20), for controls for all values of the arguments (cell numbers). This assumption works for many control networks, but sometimes it was observed that stochastic deviations of cell numbers from the mean forced the linear control function to take values outside the realistic range (e.g. a division rate may become negative). In such cases we used nonlinear functions which have the correct values of the derivatives at the equilibrium, but are defined in the biologically relevant range, see Appendix A. A typical simulation of the control dynamics for network #1 is presented in figure 5. The variance of the number of each cell type, is similar to the measured values reported in Bravo and Axelrod (2013).
Figure 5.
A typical simulation of network #1. Simulation starts at the experimentally measured means and finishes when the number of time steps reaches 2 · 107. Here we used q = 0.1 and W = 0.03; a set of control coefficients which produces means and variances similar to those measured in human crypts was determined by solving system (16). For the nonlinear control function see Appendix A.
Choose networks with appropriate dynamics of recovery from perturbation
Next, we perform the eigenvalue analysis of the networks to study the injury recovery dynamics. The recovery dynamics of the measured data are oscillatory, see e.g. Paulus et al. (1992). Theoretically, we study the eigenvalues of the linearized system around the equilibrium for each network. Using the deterministic equations (2)–(4), we can compute the Jacobian of each network (evaluating at the steady state) and its eigenvalues, thus obtain the condition of stability and oscillatory behavior, see Appendix B for details. Complex eigenvalues indicate robust oscillations. The results are listed as follows (see equations (17)–(20) for the notations):
system 1: The system is always stable, and it is oscillatory if .
system 2: The system is always stable, and it is oscillatory if .
system 8: The system is always stable but not oscillatory.
system 9: The system is always stable but not oscillatory.
system 12: The system is always stable but not oscillatory.
system 13: The system is always stable, and it is oscillatory if .
system 18: The system is stable if , and it is oscillatory if .
From this analysis we conclude that networks #8, 9 and 12 do not have appropriate oscillatory dynamics and are therefore eliminated.
Choose networks with observed intracrypt correlations of cell types
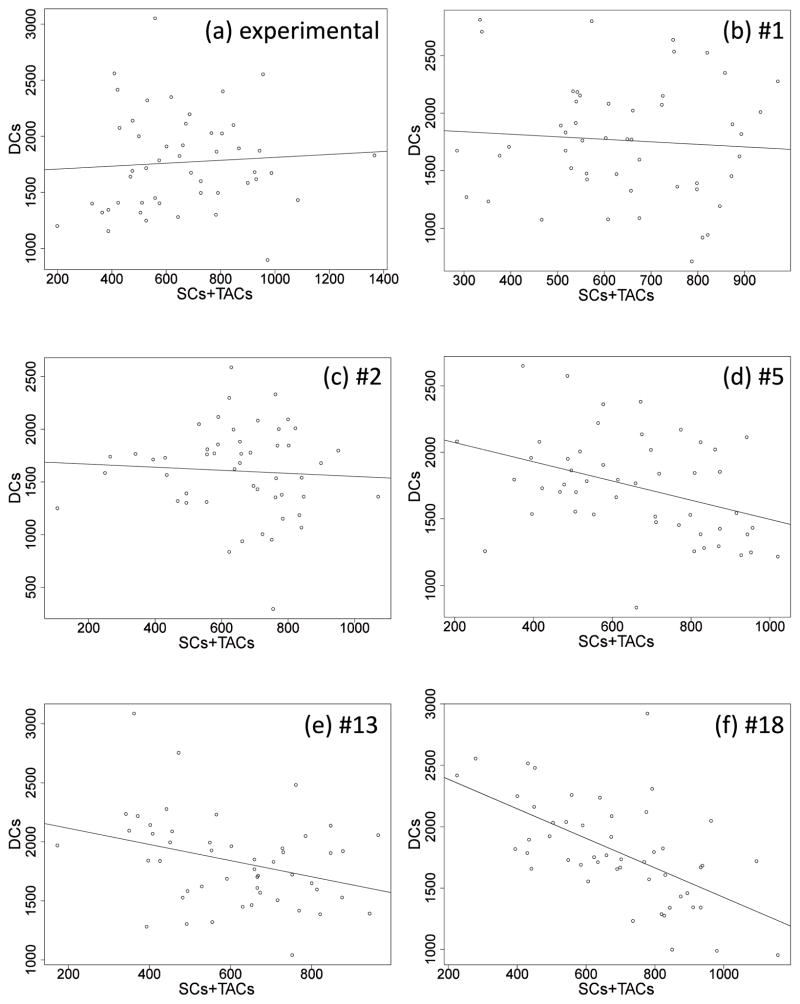
From the measurements, the sum of the number of SC’s (total stem cells) and TACs is not correlated with the number of DCs, see figure 6(a). For each candidate network, we evaluate the absence of this correlation. We do not need to investigate correlations between TACs and SCs, because these numbers are strongly correlated due to the assumption that a fraction W of dividing cells is SCs and (1 – W) is TACs. We use W = 0.03, from section 2.1.
Figure 6.
The plots of DCs vs. the sum of SCs + TACs. (a) is for the experimental data, and p-value = 0.64 (linear correlation coefficient); (b) is for network 1 when q = 0.1, and p-value = 0.598; (c) is for network 2 when q = 0.1, and p-value = 0.661; (d) is for network 5 when q = 0.1, and p-value = 0.006; (e) is for network 13 when q = 0.2, and p-value = 0.021; (f) is for network 18 when q = 0.3, and p-value = 4.89× 10⁻⁶. The straight lines indicate the fitted regression line for each. Please note that different values of q are used in the subfigures (b–f) because different networks describe the measured mean and variances for different subsets of the possible q values.
From the previous step, the remaining networks are: 1, 2, 5, 13, and 18. For each of these networks, we perform simulations of the dynamics in homeostatic conditions, figure 6(b–f). Each simulation starts at the experimentally measured mean and finishes when time steps reach 2 · 107. Each data point in figure 6 is collected every 4 · 105 time steps: the x-value is the sum of SC and TAC population numbers, and y-value is the DC population number (that is, for each panel in 6, we plotted 50 data points). Using the statistical package R, we can check the correlation for each network: we fit a linear regression model of the simulated DCs against the sum of simulated SCs and TACs. We then perform hypothesis testing on the linear relation: suppose the model is expressed as y = αx+β, then the null hypothesis is H0: α = 0, and the alternative hypothesis is Ha: α ≠ 0. P-values of α can be obtained from R. A p-value less than 0.05 indicates that a linear correlation was unlikely due to chance, and a p-value greater than 0.05 indicates that the correlation could have been due to chance. The result is presented in figure 6, and p-values are given in the caption of the figure.
From this part of the analysis we conclude that networks #5, 13, and 18 have significant correlations between the number of DCs and sum of SCs and DCs, unlike the observed data, and therefore are eliminated. However, for networks #1 and #2, the intra-crypt correlations are not significant, as are the observed data not significant, and they are retained.
Revisit injury recovery dynamics
Besides the eigenvalue analysis, we also look at the actual trajectories of the cell numbers following in injury. Injury recovery measurements are available in the literature, see e.g. Paulus et al. (1992), where the cell numbers in the mouse small intestine were measured following a perturbation of homeostasis of cell dynamics by a dose of radiation. Further, Hua et al. (2012) show very similar results, see Fig. 6(b) in their paper that depicts oscillations of DNA synthesizing cells in mouse intestinal crypts after irradiation.
We observe that oscillation trajectories in recovery dynamics feature a certain overshoot followed by diminishing oscillations around the mean number of the cells. In particular, Fig. 1(c) in Paulus et al. (1992) shows recovery oscillation of (clonogenic) stem cells, and Fig. 1(d) in the same paper shows the recovery of total cells per crypt. Even though direct measurements of oscillatory crypt recovery dynamics are only available for murine crypts, we expect that similar behavior will be observed in human crypts, see also simulations of the human colon crypt in Bravo and Axelrod (2013), where Fig. 5 shows oscillatory behavior similar to that of mouse crypts. Therefore, we argue that a reasonable control network should exhibit oscillatory behavior both in the numbers of stem cells and in the total number of cells.
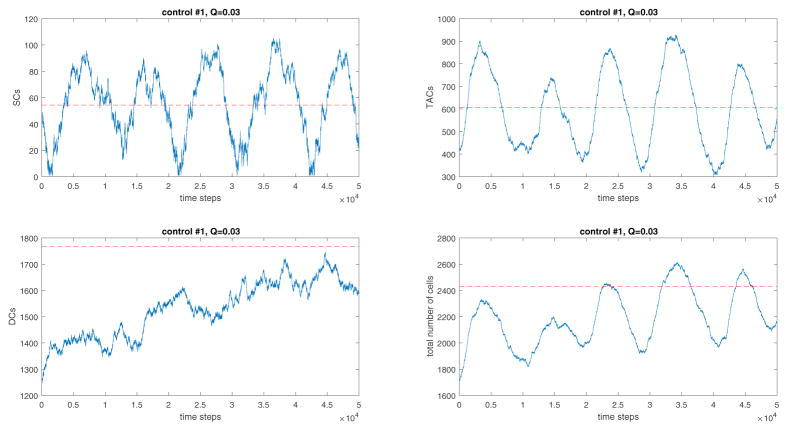
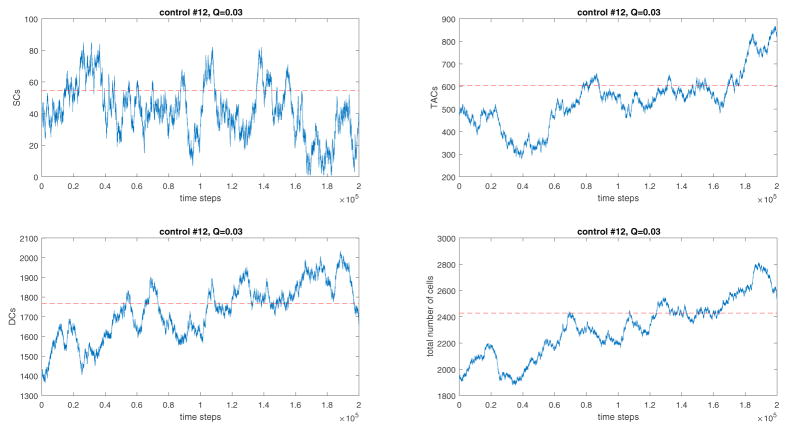
In the previous stage of the algorithm, we have used the eigenvalue analysis to study the oscillatory behavior of each candidate network, and now we check if each remaining network produces a recovery trajectory that is qualitatively similar to the measurements. For each network, we start a numerical simulation at the state of equilibrium. We reduce the total cell number to 0.8 of the unperturbed value, run the simulation when the time steps reach 2 × 10⁶, and then plot the number of cells over the time course. The numerical results for network #1 are presented in figure 7 (for network #2, the dynamics look very similar and are not shown). We observe that networks #1 and #2, each produce recovery dynamics of total cell numbers similar to the experimentally observed recovery dynamics reported in Paulus et al. (1992); Hua et al. (2012). In particular, both the number of SCs and the total number of cells are characterized by oscillatory recovery trajectories consistent with the experiments. In contrast with that, other (non-oscillatory) networks exhibit qualitatively different behavior, which is illustrated by the example of network #12, see figure 8.
Figure 7.
The simulated recovery trajectories of network #1 when W = 0.03 and q = 0.1. The red lines indicate the measured equilibrium values of cell numbers. The behavior of network 2 is qualitatively similar. The recovery kinetics are oscillatory.
Figure 8.
The simulated recovery trajectories of network #12 when W = 0.03 and q = 0.1. The red lines indicate the measured equilibrium values of cell numbers. The recovery kinetics are not oscillatory.
A note on the variance of SCs
The calculated mean number of SCs in the crypts was only slightly larger than the standard deviation. As long as parameter W (the fraction of dividing cells that are active SC) was not too much lower than its calculated mean, the system under the minimal controls studied here was able to maintain robust homeostasis. If we used W = 0, however, we observed that under the parameter values that produced the experimentally measured variance, the SCs were subject to relatively frequent extinction events. This observation allows several interpretations. (i) If we were to interpret the inter-crypt variation as an indicator of temporal intra-crypt variation, and assumed that W = 0, the minimal control networks studied here are not enough to explain the system behavior, and additional processes such as TAC de-differentiation activated by SCs falling below a certain level would have to be included. (ii) Alternatively, it is possible that the relatively high inter-crypt variance of the SC numbers is a consequence of inter-crypt parameter variation, and the actual temporal homeostatic variability of crypts in lower than this. (iii) The value of W does not fall much below the measured mean of W = 0.03, in which case no further model modifications are necessary.
Summary of findings
Of the 20 possible constant-death control networks (figure 2), only networks #1 and #2 have stable dynamics that reproduce the measured mean and variance of each cell type, exhibit the correct intra-crypt correlation patterns, and show realistic oscillatory recovery dynamics. Further, as demonstrated in Appendix C, out of the 12 additional, non-constant death control networks (figure 3), only network #27 satisfies the same criteria. The three networks, #1,#2, and#27, are shown in figure 9.
Figure 9.
The three minimal control networks selected by our algorithm as candidate networks for colonic crypt lineages.
4 Results and discussion
Investigating possible regulation of stem cell dynamics in colon and intestinal crypts has been a popular subject for computational and mathematical modeling (Van Leeuwen et al., 2006; Kershaw et al., 2013; De Matteis et al., 2013; Carulli et al., 2014). This is because crypts have a few distinguishable cell types organized in a hierarchy of fewer than 2500 cells that maintain homeostasis, and can recover after perturbation. It is the kind of dynamical system that lends itself to formulating possible regulatory models, and testing the model behaviors by comparing simulation results to experimental observations of real biological crypts.
In this study we investigated the 32 theoretically possible minimal control networks for a three-compartment system consisting of SCs, TACs, and DCs. We used the data obtained on 49 human colonic crypts, where the numbers of dividing and non-dividing cells were measured. From this information assuming that the fraction W of all dividing cells were active SCs, and fraction 1 – W were TACs, we obtained the distributions of the three cell types. Using this information as well as observations of crypt recovery from injury and intra-crypt correlations, we devised an algorithm which allowed us to test all 32 networks. All but three were excluded based on their inconsistency with the measured data. In particular we found that control networks #1, #2, and #27 are the best systems that describe the measured data, see figure 9.
A conceptually surprising outcome is that an argument about the interactions among the compartments of a stem cell lineage can be made based on only a very limited set of measurements, which does not contain any direct assessment of signaling mechanisms. The biological input consists of quantitative static measurements (the sample means and the variances of the cell numbers together with their correlations) and qualitative dynamic measurements (the existence of oscillations in tissue recovery process). Based on these pieces of evidence, and on our analysis of mathematically possible networks, we were able to restrict the number of possible regulatory networks to only three.
The resulting candidate networks #1 and #2 (figure 2) are among only three networks (among the 32 networks) that consist entirely of negative loops (network #6 is the third such network, and it was eliminated at the first step of the analysis because it failed to produce a stable root with the means and variances matching the observations, see figure 4). Network #27 is one of only two networks (among those where death of DCs is controlled, figure 3) that contain two negative control loops (non-local network #29 is the second one). In general, negative feedback controls are common in biological systems at many levels, from repressor protein effects on transcription of the lac operon in DNA to the effect of insulin on glucose in the blood. Negative controls have also been invoked to model other cell lineages (Lo et al., 2009; Mangel and Bonsall, 2008). Novák and Tyson (2008) emphasize the important role that negative signaling loops play in oscillatory behavior in a wide variety of biological systems.
We further notice that the candidate control networks identified by our algorithm are all very similar: out of three control loops, two occur in all the three networks. These are: (1) the negative regulation of SC division rate by the cells in the SC compartment, and (2) the negative regulation of SC differentiation probability by the TAC compartment. These control loops have a simple explanation through the mechanism of crowding: having too many SCs prevents them from further divisions, and too many TACs restricts differentiation divisions in favor of proliferation divisions. The DCs in the three candidate networks perform different tasks: they exhibit negative control of divisions (#1) and differentiations (#2) of TACs, and they regulate their own death (#27). Our current algorithm cannot distinguish between these three possibilities; further biological information may further narrow the set of candidate control networks.
Understanding the design principles of control networks is a fascinating research direction, to which this work can contribute. Given the results of our analysis, we hypothesize that perhaps the pattern of two negative control loops that occurs in all the three networks selected by our algorithm may be important for effective control of hierarchically organized tissues such as crypts.
This work should be considered more of a demonstration of principle than a final result. For example, we cannot conclude that one of the networks #1, #2 and #27 is definitely the one that acts in human colonic crypts. We have only tested the minimal (3-control) regulatory networks. It is still possible that a more complicated network with more than three essential control mechanisms is in place. All we can say is that we found the two simplest (in the sense of having the minimal number of loops) control networks that are compatible with (both dynamic and static) observations in colonic crypts. The same holds for additional cellular processes that were not included in the present model, such as cell de-differentiation. The methods proposed here however can be extended to such systems, see Sun et al. (2016). The process of de-differentiation can be especially relevant for the system in question, as the measured inter-crypt standard deviation of the SC numbers is not much smaller than their mean, and in certain regimes it may be necessary to include TAC de-differentiation to compensate for stochastic loss of SCs.
In principle, SCs are capable of three types of division: (1) asymmetric divisions, where one of the daughter cells retains the stemness property while the other is more differentiated; (2) symmetric proliferation, where both offspring are stem cells, and (3) symmetric differentiation, where both offspring have higher degree of differentiation compared to the dividing cell. A large number of studies has been devoted to understanding the symmetry of SC divisions, and it appears that in some organisms SCs divide mostly asymmetrically, and in others both division types happen, depending on the specific context. The prevalence of symmetric divisions depends on the tissue. For example, in the mouse epidermis, it has been reported that about 20% of SC divisions are symmetric in the ear and tail epidermis, while 40% of SC divisions are symmetric in the paw epidermis. In the epidermis it has been argued in the recent years that SCs divide predominantly asymmetrically (Lim et al., 2013; Mascré et al., 2012; Doupé et al., 2010; Clayton et al., 2007). In crypts, however, SC symmetrical divisions play an important role (Simons and Clevers, 2011; Lopez-Garcia et al., 2010; Snippert et al., 2010; Barker, 2014). Therefore, in the present paper we have used the model with symmetric divisions (types (2) and (3) above). Again, asymmetric divisions can be added by using the present methodology, see Yang et al. (2015a).
In this paper we used the measurements of Ki-67, where the positively stained cells were identified as dividing, and the non-stained cells as non-dividing, to study cellular control networks. Different cell types (such as SCs, TACs, DCs) control various cell fate decisions. In order to convert our measurements into information on the numbers of SCs, TACs, and DCs, we used the assumption that some stem cells are quiescent and others are active. Li and Clevers (2010) has reviewed evidence for this understanding of stem cells. They describe evidence for the co-existence of quiescent and active stem cell populations in the hair follicle, small intestine, and bone marrow. The model includes interconversion between the two types of stem cells, with quiescent stem cells replenishing damaged active stem cell population, and the possibility of active cells converting to quiescent stem cells. The number of quiescent cells are regulated by negative feedback from the active stem cells and/or their progeny. This model extends the previous models that have described each cell in the stem cell population as having a probability of not dividing, or dividing symmetrically to produce more stem cells or asymmetrically to produce a stem cell and a transient amplifying cell (Humphries and Wright, 2008).
Our model only includes spatial considerations in the most rudimentary sense. We exclude the networks with nonlocal control, bearing in mind the geometry of the crypts. A more detailed, spatial model can be designed to test if our conclusions still hold. A limitation of such numerical studies is that complex spatial models do not allow for analytical solutions, and a comprehensive parameter study of the kind presented in our algorithm cannot be implemented. The advantage of our approach is that we obtained analytical expressions for the means and the variances of numbers of each cell type, and this allowed us to recover the values for the controls, given the experimentally obtained cell population measurements.
In conclusion, we have compared the simulated behavior of several possible regulatory networks with the numbers of cell types measured in human biopsy specimens, and have determined that the most likely form of regulation is by local control of stem cells on their own division, transient amplifying cells on the differentiation of stem cells, and differentiated cells on the division and differentiation of transient amplifying cells.
Highlights.
Numbers of stem cells, TA, and differentiated cells are measured in human crypts.
Stochastic model of control yields 20 simplest possible control networks.
An algorithm is developed to choose the most likely control networks.
Acknowledgments
D.E.A. was supported by the Human Genetics Institute of New Jersey, the New Jersey Breast Cancer Research Fund, and the Rutgers Cancer Institute of New Jersey (PA30CA072720). He thanks Dr. Steven Schiff of the R-CINJ for provided biopsy specimens, and Dr. Michael de Frietas for informative discussions about modeling crypt cell dynamics. N.L.K gratefully acknowledges the support of NIH grant 1 U01 CA187956-01. We thank an anonymous reviewer for suggesting that we analyze networks with non-constant death.
A Nonlinear control functions
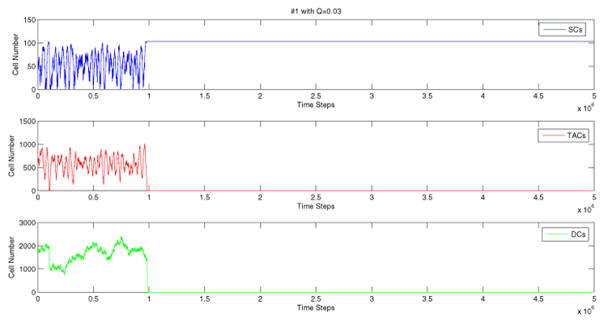
For some parameter values it was possible to assume that the controls are described by functions (17–20), as long as the probability values (functions P1 and P2) are within the interval [0, 1], and the rate functions (L1 and L2) are nonnegative. If in the course of stochastic dynamics the functions given by equations (17–20) fall outside these bounds, we implemented a rule where the functions were replaced by zeros or ones (that is, values inside the boundaries). For a set of parameters (specifically, for relatively small values of W), this rule resulted in a system failure, as depicted in figure 10 for network #1, W = 0.03. As observed, SCs stop dividing after around some time; that is L1 ≤ 0. In the following example we explore what happens. Using equation (17), one can see that the abnormal situation is due to the form of function L1. We have for control system #1:
| (22) |
| (23) |
| (24) |
where i1, i2 and i3 are given by equation (9). We observe that L1 drops below zero when the SC number is sufficiently large. In the case of this control system, the dynamics often drives the population of stem cells toward such values where L1 drops below zero. In other words, linear function L1 attains biologically unrealistic values within the range of normal fluctuations of x. Therefore, we need to replace the linear function L1 with a nonlinear function, which remains biologically relevant within the range of x that is attained regularly by the stochastic system. Notice that such alternative, nonlinear function should have the following properties:
Figure 10.
A simulation of network #1 when q = 0.1 and W = 0.03. The left figure is for linear function of L1 described by equation (17), and the right figure is for the nonlinear control of L1 (see appendix A), whereas we hold other control functions as linear in both cases.
depends only on i1, and it is decreasing;
and ;
.
One suitable choice of the nonlinear function can be an exponential decay function: . As we observed from figure 5, network #1 behaves as expected with the nonlinear control . For other networks, we perform a similar procedure whenever the assumption of linearity is violated.
B Eigenvalues Analysis
We first illustrate the eigenvalues analysis by computing eigenvalues on system 1. Using figure 2 and the notations in equations (17)–(20), system 1 can be characterized as:
The Jacobian of the system (evaluating at the steady state) can be obtained using the deterministic equations (2)–(4):
By solving the roots of the characteristic polynomial |J − λI|, we obtain the eigenvalues:
It follows that system 1 is always stable (all eigenvalues have negative real part), and it is oscillatory if L0bP1 − 4L0aL1 > 0 (complex eigenvalues indicate robust oscillations); that is, .
We then performed the same analysis for system 2, 8, 9, 12, 13 and 18. The results are summarized below:
-
system 2:
Eigenvalues are .
The system is always stable, and it is oscillatory if .
-
system 8:
Eigenvalues are .
The system is always stable but not oscillatory.
-
system 9:
Eigenvalues are .
The system is always stable but not oscillatory.
-
system 12:
Eigenvalues are .
The system is always stable but not oscillatory.
-
system 13:
Eigenvalues are .
The system is always stable, and it is oscillatory if .
-
system 18:
Eigenvalues are .
The system is stable if , and it is oscillatory if .
C Analysis of non-constant death rate minimal networks of figure 3
We followed the steps of the algorithm described in the main text to analyze the 12 minimal networks depicted in figure 3. The consecutive elimination steps are shown in figure 11. First, we eliminated the non-local networks, which excluded networks 29–31. Out of the remaining networks 21–28, all eight allow for control coefficients compatible with the measured means and variances. The stochastic analysis is based on the linearization of the control functions given by equations (17–20) and the equation for the death rate,
Figure 11.
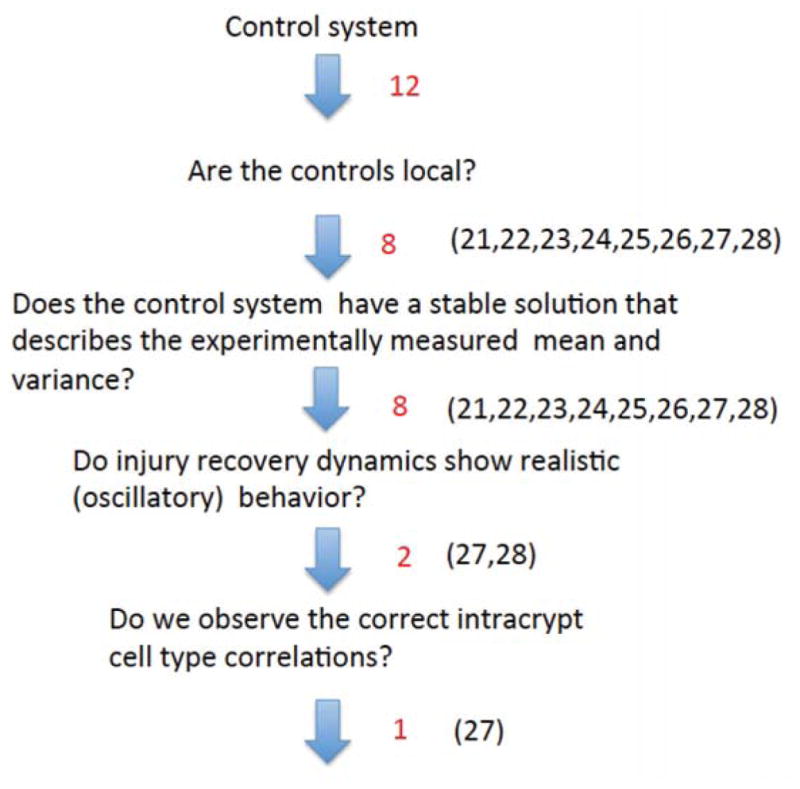
The outcome of the selection algorithm for the non-constant death networks of figure 3 with W = 0.03.
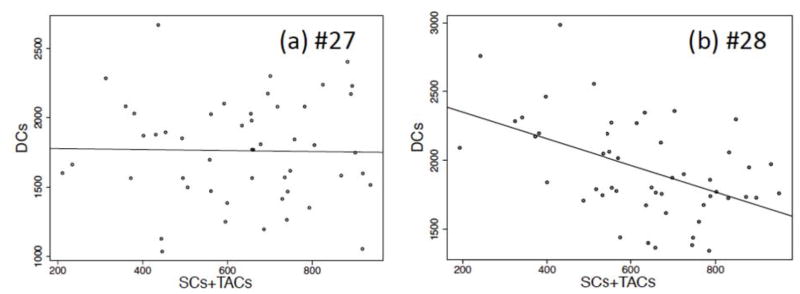
Analysis of eigenvalues shows that networks #21, #22, and #23 are non-oscillatory. Networks #24 and #25 have complex eigenvalues, but the solution for the stem cell component is non-oscillatory. Similarly, network #26 has oscillatory eigenvalues but the total number of cells is non-oscillatory. Finally, networks #27 and #28 both have complex eigenvalues, and both the stem cells and total numbers of cells have oscillatory recovery dynamics. Of these two remaining networks, #28 has statistically significant intra-crypt correlations, while #27 does not, see figure 12. Further, network #27 exhibits oscillatory recovery dynamics similar to that depicted in figure 7. Therefore, we conclude that the only remaining candidate network is #27.
Figure 12.
The plots of DCs vs. the sum of SCs + TACs for two non-constant death networks. (a) Network 27 when q = 0.2, and p-value = 0.9. (b) Network 28 when q = 0.2, and the p-value is 0.000328 (other values of q also produced p< 0.05, not shown).
Footnotes
The considerable variation in the number of quiescent stem cells has previously been noted (Table 1, Bravo and Axelrod (2013)). The method of measuring cell numbers and the measurement reliability has been described in detail in (Additional File 5, Bravo and Axelrod (2013)). The experimental error in the measurement of the number of stem cells was determined by 49 repeated measurements of one crypt, C.V. = 7.7%. Since the experimental error in repeated measurements of one crypt was much less than the measured variation between 49 adjacent crypts, C.V.= 102%, it is likely that the measured variation between adjacent crypts is really indicative of a large variation between crypts, and not just due to experimental error.
Publisher's Disclaimer: This is a PDF file of an unedited manuscript that has been accepted for publication. As a service to our customers we are providing this early version of the manuscript. The manuscript will undergo copyediting, typesetting, and review of the resulting proof before it is published in its final citable form. Please note that during the production process errors may be discovered which could affect the content, and all legal disclaimers that apply to the journal pertain.
References
- Arai F. Jpn J Clin Hem. 2016;57(10):1845. doi: 10.11406/rinketsu.57.1845. [DOI] [PubMed] [Google Scholar]
- Ashkenazi R, Gentry SN, Jackson TL. Neoplasia. 2008;10(11):1170. doi: 10.1593/neo.08572. [DOI] [PMC free article] [PubMed] [Google Scholar]
- Ashkenazi R, Jackson TL, Dontu G, Wicha MS. Stem Cell Rev. 2007;3(2):176. doi: 10.1007/s12015-007-0026-2. [DOI] [PubMed] [Google Scholar]
- Barker N. Nat Rev Mol Cell Bio. 2014;15(1):19. doi: 10.1038/nrm3721. [DOI] [PubMed] [Google Scholar]
- Barker N, van Es JH, Kuipers J, Kujala P, van den Born M, Cozijnsen M, Haegebarth A, Korving J, Begthel H, Peters PJ, et al. Nature. 2007;449(7165):1003. doi: 10.1038/nature06196. [DOI] [PubMed] [Google Scholar]
- Boman BM, Fields JZ, Cavanaugh KL, Guetter A, Runquist OA. Cancer Res. 2008;68:3304. doi: 10.1158/0008-5472.CAN-07-2061. [DOI] [PubMed] [Google Scholar]
- Bravo R, Axelrod DE. Theor Biol Med Mod. 2013;10(1):66. doi: 10.1186/1742-4682-10-66. [DOI] [PMC free article] [PubMed] [Google Scholar]
- Carulli AJ, Samuelson LC, Schnell S. Integrative Biology. 2014;6(3):243. doi: 10.1039/c3ib40163d. [DOI] [PMC free article] [PubMed] [Google Scholar]
- Clayton E, Doupé DP, Klein AM, Winton DJ, Simons BD, Jones PH. Nature. 2007;446(7132):185. doi: 10.1038/nature05574. [DOI] [PubMed] [Google Scholar]
- Crosnier C, Stamataki D, Lewis J. Nat Rev Genetics. 2006;7(5):349. doi: 10.1038/nrg1840. [DOI] [PubMed] [Google Scholar]
- De Matteis G, Graudenzi A, Antoniotti M. J Math Biol. 2013;66(7):1409. doi: 10.1007/s00285-012-0539-4. [DOI] [PubMed] [Google Scholar]
- Dingli D, Michor F. Stem Cells. 2006;24(12):2603. doi: 10.1634/stemcells.2006-0136. [DOI] [PubMed] [Google Scholar]
- Dingli D, Traulsen A, Pacheco JM. Cell Cycle. 2007;6(4):461. doi: 10.4161/cc.6.4.3853. [DOI] [PubMed] [Google Scholar]
- Doupé DP, Klein AM, Simons BD, Jones PH. Dev Cell. 2010;18(2):317. doi: 10.1016/j.devcel.2009.12.016. [DOI] [PubMed] [Google Scholar]
- Enderling H. Integrative Biology. 2015;7(1):14. doi: 10.1039/c4ib00191e. [DOI] [PubMed] [Google Scholar]
- Enderling H, Anderson AR, Chaplain MA, Beheshti A, Hlatky L, Hahnfeldt P. Cancer Res. 2009a;69(22):8814. doi: 10.1158/0008-5472.CAN-09-2115. [DOI] [PubMed] [Google Scholar]
- Enderling H, Chaplain MA, Anderson AR, Vaidya JS. J Theor Biol. 2007;246(2):245. doi: 10.1016/j.jtbi.2006.12.010. [DOI] [PubMed] [Google Scholar]
- Enderling H, Hahnfeldt P. Progr Biophy Mol Biol. 2011;106(2):391. doi: 10.1016/j.pbiomolbio.2011.03.007. [DOI] [PubMed] [Google Scholar]
- Enderling H, Hlatky L, Hahnfeldt P. British J Cancer. 2009b;100(12):1917. doi: 10.1038/sj.bjc.6605071. [DOI] [PMC free article] [PubMed] [Google Scholar]
- Enderling H, Park D, Hlatky L, Hahnfeldt P. Math Model Nat Phenom. 2009c;4(3):117. [Google Scholar]
- Foo J, Drummond MW, Clarkson B, Holyoake T, Michor F. PLoS Comput Biol. 2009;5(9):e1000503. doi: 10.1371/journal.pcbi.1000503. [DOI] [PMC free article] [PubMed] [Google Scholar]
- Fuertinger DH, Kappel F, Thijssen S, Levin NW, Kotanko P. Journal of mathematical biology. 2012:1–32. doi: 10.1007/s00285-012-0530-0. [DOI] [PubMed] [Google Scholar]
- Ganguly R, Puri I. Cell Prolif. 2006;39(1):3. doi: 10.1111/j.1365-2184.2006.00369.x. [DOI] [PMC free article] [PubMed] [Google Scholar]
- Ganguly R, Puri I. Cell Prolif. 2007;40(3):338. doi: 10.1111/j.1365-2184.2007.00434.x. [DOI] [PMC free article] [PubMed] [Google Scholar]
- Gardiner CW. Handbook of Stochastic Methods for Physics, Chemistry, and the Natural Sciences, Vol. 13 of Springer Series in Synergetics. Berlin: Springer; 2004. [Google Scholar]
- Glauche I, Cross M, Loeffler M, Roeder I. Stem Cells. 2007;25:1791. doi: 10.1634/stemcells.2007-0025. [DOI] [PubMed] [Google Scholar]
- Gregorieff A, Pinto D, Begthel H, Destrée O, Kielman M, Clevers H. Gastroenterology. 2005;129(2):626. doi: 10.1016/j.gastro.2005.06.007. [DOI] [PubMed] [Google Scholar]
- Hardy K, Stark J. Apoptosis. 2002;7:373. doi: 10.1023/a:1016183731694. [DOI] [PubMed] [Google Scholar]
- Hillen T, Enderling H, Hahnfeldt P. Bull Math Biol. 2013;75(1):161. doi: 10.1007/s11538-012-9798-x. [DOI] [PubMed] [Google Scholar]
- Hsieh J. Genes & Development. 2012;26(10):1010. doi: 10.1101/gad.187336.112. [DOI] [PMC free article] [PubMed] [Google Scholar]
- Hua G, Thin TH, Feldman R, Haimovitz-Friedman A, Clevers H, Fuks Z, Kolesnick R. Gastroenterology. 2012;143(5):1266. doi: 10.1053/j.gastro.2012.07.106. [DOI] [PMC free article] [PubMed] [Google Scholar]
- Humphries A, Wright NA. Nat Rev Cancer. 2008;8(6):415. doi: 10.1038/nrc2392. [DOI] [PubMed] [Google Scholar]
- Johnston MD, Edwards CM, Bodmer WF, Maini PK, Chapman SJ. Proc Natl Acad Sci USA. 2007;104:4008. doi: 10.1073/pnas.0611179104. [DOI] [PMC free article] [PubMed] [Google Scholar]
- Johnston MD, Maini PK, Chapman SJ, Edwards CM, Bodmer WF. J Theor Biol. 2010;266(4):708. doi: 10.1016/j.jtbi.2010.07.031. [DOI] [PubMed] [Google Scholar]
- Kershaw SK, Byrne HM, Gavaghan DJ, Osborne JM. IET Systems Biology. 2013;7(3):57. doi: 10.1049/iet-syb.2012.0019. [DOI] [PMC free article] [PubMed] [Google Scholar]
- Komarova NL. PloS One. 2013;8(9):e72847. doi: 10.1371/journal.pone.0072847. [DOI] [PMC free article] [PubMed] [Google Scholar]
- Konstorum A, Hillen T, Lowengrub J. Bull Math Biol. 2016;78(4):754. doi: 10.1007/s11538-016-0161-5. [DOI] [PMC free article] [PubMed] [Google Scholar]
- Kosinski C, Li VS, Chan AS, Zhang J, Ho C, Tsui WY, Chan TL, Mifflin RC, Powell DW, Yuen ST, et al. Proc Natl Acad Sci USA. 2007;104(39):15418. doi: 10.1073/pnas.0707210104. [DOI] [PMC free article] [PubMed] [Google Scholar]
- Kunche S, Yan H, Calof AL, Lowengrub JS, Lander AD. PLoS Comp Biol. 2016;12(3):e1004814. doi: 10.1371/journal.pcbi.1004814. [DOI] [PMC free article] [PubMed] [Google Scholar]
- Lander AD, Gokoffski KK, Wan FY, Nie Q, Calof AL. PLoS Biol. 2009;7:e15. doi: 10.1371/journal.pbio.1000015. [DOI] [PMC free article] [PubMed] [Google Scholar]
- Li L, Clevers H. Science. 2010;327(5965):542. doi: 10.1126/science.1180794. [DOI] [PMC free article] [PubMed] [Google Scholar]
- Lim X, Tan SH, Koh WLC, Chau RMW, Yan KS, Kuo CJ, van Amerongen R, Klein AM, Nusse R. Science. 2013;342(6163):1226. doi: 10.1126/science.1239730. [DOI] [PMC free article] [PubMed] [Google Scholar]
- Lo WC, Chou CS, Gokoffski KK, Wan FY, Lander AD, Calof AL, Nie Q. Math Biosci Eng. 2009;6:59. doi: 10.3934/mbe.2009.6.59. [DOI] [PMC free article] [PubMed] [Google Scholar]
- Lopez-Garcia C, Klein AM, Simons BD, Winton DJ. Science. 2010;330(6005):822. doi: 10.1126/science.1196236. [DOI] [PubMed] [Google Scholar]
- Mahaffy JM, Bélair J, Mackey MC. Journal of theoretical biology. 1998;190(2):135. doi: 10.1006/jtbi.1997.0537. [DOI] [PubMed] [Google Scholar]
- Mangel M, Bonsall MB. PLoS One. 2008;3:e1591. doi: 10.1371/journal.pone.0001591. [DOI] [PMC free article] [PubMed] [Google Scholar]
- Marciniak-Czochra A, Stiehl T, Ho AD, Jäger W, Wagner W. Stem Cells and Dev. 2009;18(3):377. doi: 10.1089/scd.2008.0143. [DOI] [PubMed] [Google Scholar]
- Mascré G, Dekoninck S, Drogat B, Youssef KK, Brohée S, Sotiropoulou PA, Simons BD, Blanpain C. Nature. 2012;489(7415):257. doi: 10.1038/nature11393. [DOI] [PubMed] [Google Scholar]
- Medema JP, Vermeulen L. Nature. 2011;474(7351):318. doi: 10.1038/nature10212. [DOI] [PubMed] [Google Scholar]
- Montgomery RK, Carlone DL, Richmond CA, Farilla L, Kranendonk ME, Henderson DE, Baffour-Awuah NY, Ambruzs DM, Fogli LK, Algra S, et al. Proc Natl Acad Sci USA. 2011;108(1):179. doi: 10.1073/pnas.1013004108. [DOI] [PMC free article] [PubMed] [Google Scholar]
- Muñoz J, Stange DE, Schepers AG, van de Wetering M, Koo BK, Itzkovitz S, Volckmann R, Kung KS, Koster J, Radulescu S, et al. The EMBO Journal. 2012;31(14):3079. doi: 10.1038/emboj.2012.166. [DOI] [PMC free article] [PubMed] [Google Scholar]
- Nakata Y, Getto P, Marciniak-Czochra A, Alarcón T. J Biol Dyn. 2012;6(sup1):2. doi: 10.1080/17513758.2011.558214. [DOI] [PubMed] [Google Scholar]
- Nishimura S, Wakabayashi N, Toyoda K, Kashima K, Mitsufuji S. Digestive Diseases and Sciences. 2003;48(8):1523. doi: 10.1023/a:1024763723240. [DOI] [PubMed] [Google Scholar]
- Novák B, Tyson JJ. Nat Rev Mol Cell Biol. 2008;9(12):981. doi: 10.1038/nrm2530. [DOI] [PMC free article] [PubMed] [Google Scholar]
- Nowak MA. Evolutionary dynamics. Cambridge MA: Harvard University Press; 2006. [Google Scholar]
- Paulus U, Potten CS, Loeffler M. Cell Prolif. 1992;25(6):559. doi: 10.1111/j.1365-2184.1992.tb01460.x. [DOI] [PubMed] [Google Scholar]
- Potten CS, Booth C, Tudor GL, Booth D, Brady G, Hurley P, Ashton G, Clarke R, Sakakibara S-i, Okano H. Differentiation. 2003;71(1):28. doi: 10.1046/j.1432-0436.2003.700603.x. [DOI] [PubMed] [Google Scholar]
- Powell AE, Wang Y, Li Y, Poulin EJ, Means AL, Washington MK, Higginbotham JN, Juchheim A, Prasad N, Levy SE, et al. Cell. 2012;149(1):146. doi: 10.1016/j.cell.2012.02.042. [DOI] [PMC free article] [PubMed] [Google Scholar]
- Schier AF, Needleman D. Nature. 2009;461(7263):480. doi: 10.1038/461480a. [DOI] [PubMed] [Google Scholar]
- Scott JG, Hjelmeland AB, Chinnaiyan P, Anderson AR, Basanta D. PLoS Comp Biol. 2014;10(1):e1003433. doi: 10.1371/journal.pcbi.1003433. [DOI] [PMC free article] [PubMed] [Google Scholar]
- Simons BD, Clevers H. Cell. 2011;145(6):851. doi: 10.1016/j.cell.2011.05.033. [DOI] [PubMed] [Google Scholar]
- Snippert HJ, van der Flier LG, Sato T, van Es JH, van den Born M, Kroon-Veenboer C, Barker N, Klein AM, van Rheenen J, Simons BD, et al. Cell. 2010;143(1):134. doi: 10.1016/j.cell.2010.09.016. [DOI] [PubMed] [Google Scholar]
- Stiehl T, Baran N, Ho AD, Marciniak-Czochra A. Journal of The Royal Society Interface. 2014a;11(94):20140079. doi: 10.1098/rsif.2014.0079. [DOI] [PMC free article] [PubMed] [Google Scholar]
- Stiehl T, Ho A, Marciniak-Czochra A. Bone marrow transplantation. 2014b;49(1):30. doi: 10.1038/bmt.2013.138. [DOI] [PubMed] [Google Scholar]
- Stiehl T, Marciniak-Czochra A. Math Comp Mod. 2011;53(7):1505. [Google Scholar]
- Stiehl T, Marciniak-Czochra A. Math Mod Nat Phenom. 2012;7(1):166. [Google Scholar]
- Sun Z, Plikus MV, Komarova NL. PLoS Comp Biol. 2016;12(7):e1004990. doi: 10.1371/journal.pcbi.1004990. [DOI] [PMC free article] [PubMed] [Google Scholar]
- Van Kampen NG. Stochastic processes in physics and chemistry. Amsterdam: Elsevier; 1992. [Google Scholar]
- Van Leeuwen I, Byrne H, Jensen O, King J. Cell Prolif. 2006;39(3):157. doi: 10.1111/j.1365-2184.2006.00378.x. [DOI] [PMC free article] [PubMed] [Google Scholar]
- Wagers A, Christensen J, Weissman I. Gene Therapy. 2002;9(10) doi: 10.1038/sj.gt.3301717. [DOI] [PubMed] [Google Scholar]
- Wallace E, Gillespie D, Sanft K, Petzold L. IET Systems Biology. 2012;6(4):102. doi: 10.1049/iet-syb.2011.0038. [DOI] [PubMed] [Google Scholar]
- Wodarz D, Komarova NL. Dynamics of cancer: mathematical foundations of oncology. Hachensack NJ: World Scientific; 2014. [Google Scholar]
- Yang J, Plikus MV, Komarova NL. PLoS Comp Biol. 2015a;11(12):e1004629. doi: 10.1371/journal.pcbi.1004629. [DOI] [PMC free article] [PubMed] [Google Scholar]
- Yang J, Sun Z, Komarova NL. Math Biosci. 2015b;266:93. doi: 10.1016/j.mbs.2015.06.001. [DOI] [PMC free article] [PubMed] [Google Scholar]
- Yatabe Y, Tavare S, Shibata D. Proc Natl Acad Sci USA. 2001;98:10839. doi: 10.1073/pnas.191225998. [DOI] [PMC free article] [PubMed] [Google Scholar]
- Youssefpour H, Li X, Lander A, Lowengrub J. J Theor Biol. 2012;304:39. doi: 10.1016/j.jtbi.2012.02.030. [DOI] [PMC free article] [PubMed] [Google Scholar]


