

Abstract
mTORC1 integrates signals from growth factors and nutrients to control biosynthetic processes, including protein, lipid and nucleic acid synthesis. We find that the mTORC1 pathway is responsive to changes in purine nucleotides in a manner analogous to its sensing of amino acids. Depletion of cellular purines, but not pyrimidines, inhibits mTORC1, and restoration of intracellular adenine nucleotides via addition of exogenous purine nucleobases or nucleosides acutely reactivates mTORC1. Adenylate sensing by mTORC1 is dependent on the tuberous sclerosis complex (TSC) protein complex and its regulation of Rheb upstream of mTORC1, but independent of energy stress and AMPK. While mTORC1 signaling is not acutely sensitive to changes in intracellular guanylates, long-term depletion of guanylates decreases Rheb protein levels. Our findings suggest that nucleotide sensing, like amino acid sensing, enables mTORC1 to tightly coordinate nutrient availability with the synthesis of macromolecules, such as protein and nucleic acids, produced from those nutrients.
eTOC Blurb
mTORC1 integrates signals from growth factors and nutrients to coordinately control macromolecular synthesis. Hoxhaj et al. identify intracellular purine nucleotides as an upstream regulatory input into the mTORC1 pathway. Acutely, mTORC1 senses adenylates in a manner dependent on the TSC complex, while prolonged guanylate depletion results in reduced Rheb levels.
Introduction
The metabolic state of mammalian cells is set by both nutrient availability and exogenous signals from growth factors, cytokines, and hormones. These signals are integrated to coordinately control nutrient consumption for either energy (catabolism) or macromolecular synthesis (anabolism). The highly conserved mechanistic (or mammalian) target of rapamycin complex 1 (mTORC1) is a principal integrator and effector of nutrient and growth signals in eukaryotic cells (Gonzalez and Hall, 2017; Saxton and Sabatini, 2017). mTORC1 activation promotes anabolic conversion of nutrients into macromolecules, including proteins, lipids, and nucleic acids, while suppressing the catabolic breakdown of these macromolecules through the inhibition of autophagy (Ben-Sahra and Manning, 2017). A key function of mTORC1 is the promotion of ribosome biogenesis, requiring the coordinated induction of ribosomal protein (rProtein) and ribosomal RNA (rRNA) synthesis, through which it can enhance global protein synthesis and cell growth. Importantly, mTORC1 has the capacity to sense the availability of intracellular nutrients and energy required for macromolecular synthesis. For instance, it is well established that mTORC1 activity is responsive to changes in intracellular amino acids, which are themselves essential for protein synthesis.
The activation state of mTORC1 is controlled by an upstream signaling network that propagates diverse signals from growth factors and nutrients (Saxton and Sabatini, 2017). Many of these signals regulate mTORC1 by controlling the function of two small GTPases, the Rag and Rheb proteins, which can interact directly with mTORC1 on the cytosolic surface of the lysosome and stimulate mTORC1 activation. Amino acids, most prominently leucine and arginine, are sensed by regulatory proteins that control the guanine nucleotide binding state of the Rag proteins. In the absence of amino acids, the Rag proteins are in a conformation that cannot bind to mTORC1, thereby preventing its activation. Sufficient intracellular amino acids promote engagement of the Rag proteins with mTORC1, recruiting mTORC1 to the cytosolic surface of the lysosome (Kim et al., 2008; Sancak et al., 2010; Sancak et al., 2008). Lysosomal translocation through the amino acid sensing pathway and the Rag proteins brings mTORC1 to its activator Rheb, which is essential for the stimulation of mTORC1 kinase activity. Only when Rheb is in its GTP-bound state does it activate mTORC1. A Rheb GTPase-activating protein (GAP) complex comprised of the tumor suppressors mutated in the tuberous sclerosis complex (TSC) disease, TSC1 and TSC2, and the protein TBC1D7 (collectively the TSC complex), serves to maintain Rheb in the GDP-bound state, unable to activate mTORC1 (Dibble et al., 2012). Therefore, the TSC complex serves as a key brake on mTORC1 activation, and many signals that regulate mTORC1 have been found to do so by promoting or inhibiting the ability of the TSC complex to regulate Rheb (Dibble and Manning, 2013). The best characterized of these mechanisms is growth factor signaling through the PI3K-Akt pathway, which promotes Rheb-GTP loading and mTORC1 activation via the Akt-mediated phosphorylation of TSC2, which leads to dissociation of the TSC complex from Rheb at the lysosomal surface (Menon et al., 2014).
mTORC1 signaling is also sensitive to changes in cellular energy status. A primary mechanism by which mTORC1 is suppressed by energy stress is through the action of the AMP-activated kinase (AMPK). AMPK is activated by a rise in the ratio of cellular AMP to ATP that accompanies excess ATP consumption or decreased ATP production through glycolysis or mitochondrial respiration (Hardie, 2014). AMPK suppresses mTORC1 signaling through both the TSC complex and through direct phosphorylation of the mTORC1 component Raptor (Gwinn et al., 2008; Inoki et al., 2006; Inoki et al., 2003). Another mechanism of mTORC1 inhibition by severe depletion of cellular ATP includes loss of function of the ATP-dependent TTT-RUVBL complex, which facilitates the stability of mTOR and mTORC1 (Kim et al., 2013).
In addition to protein synthesis, mTORC1 plays a key role in the production of nucleic acids. As part of its program to stimulate ribosome biogenesis, mTORC1 has been found to promote the action of both Pol I and Pol III, the RNA polymerases that transcribe rRNA (Iadevaia et al., 2014). Ribosomes comprise a substantial percentage of cellular dry mass, and cellular ribosome content increases greatly as cells grow (Lunt and Vander Heiden, 2011). Indeed, approximately 60% of ribosomal mass comes from rRNA, which accounts for 80 to 85% of all cellular RNA and is the primary destination for cellular nucleotide pools (Moore and Steitz, 2002; von der Haar, 2008). Thus, the mTORC1-stimulated production of ribosomes comes with a heavy demand for nucleotides. One important way that mTORC1 helps meet that demand was revealed in recent studies demonstrating that mTORC1 activation promotes the de novo synthesis of both pyrimidine and purine nucleotides (Ben-Sahra et al., 2013; Ben-Sahra et al., 2016; Robitaille et al., 2013).
Here, we demonstrate a mechanism that ensures that mTORC1 does not induce ribosome biogenesis when nucleotides are limiting. Analogous to amino acid sensing, where only a subset of amino acids strongly regulates mTORC1, we find that mTORC1 is inhibited upon depletion of purine nucleotides, but not pyrimidines, and is specifically sensitive to changes in adenylate nucleotides. The intracellular conversion of exogenous nucleobases and nucleosides to nucleotides can acutely reactivate mTORC1. The mechanism of adenylate sensing by mTORC1 is distinct from the energy stress response and amino acid sensing pathways and requires the TSC complex and its GAP activity toward Rheb. Furthermore, we find that prolonged depletion of intracellular purines, and guanylates in particular, leads to degradation of Rheb. Thus, our findings reveal that the mTORC1 signaling network senses nucleotides as part of its coordination of nutrient input with biosynthetic output.
Results
Depletion of purine nucleotides inhibits mTORC1 signaling
To determine whether intracellular nucleotide levels affect the activation state of mTORC1, small molecule inhibitors of different enzymes required for purine and pyrimidine synthesis were tested in dialyzed serum conditions, where free exogenous nucleobases and nucleosides are limited (Figure 1A and S1A). Inhibition of the de novo purine synthesis enzymes dihydrofolate reductase (DHFR), with methotrexate (MTX), and phosphoribosylglycinamide formyltransferase (GART), with lometrexol (LTX), or the purine salvage enzyme hypoxanthine-guanine phosphoribosyltransferase (HPRT1), with 6-mercaptopurine (6-MP), resulted in strong inhibition of mTORC1 signaling, as measured by phosphorylation of the direct targets of mTORC1 S6K1 (T389) and 4E-BP1 (via mobility shifting) (Figure 1B). The inhibition of mTORC1 signaling was concomitant with a drop in intracellular purine levels (Figure 1C and S1B). Furthermore, a recently developed small molecule inhibitor (MRT00252040) of the enzyme phosphoribosylaminoimidazole carboxylase and phosphoribosylaminoimidazolesuccinocarboxamide synthase (PAICS; Figure 1A), which catalyzes two steps in the de novo purine synthesis pathway, also depleted intracellular purine nucleotides and inhibited mTORC1 activity in a dose-dependent manner (Figure S1C).
Figure 1. Blocking purine synthesis leads to depletion of purine nucleotides and inhibition of mTORC1 signaling.

(A) Schematic of the de novo and salvage pathways of purine synthesis. Inhibitors of specific enzymes within these pathways are shown in red: methotrexate (MTX), lometrexol (LTX), MRT00252040 (MRT), mizoribine (Miz), and 6-mercaptopurine (6-MP).
(B) HeLa cells were treated for 16 hrs with MTX (2 µM), LTX (2 µM), 6-MP (100 µM), leflunomide (LEF, 10 µM), and 5-fluorouracil (5-FU, 1 µM).
(C) The abundance of purine nucleotides from HeLa cells treated with vehicle (Veh), MTX (2 µM), or LTX (2 µM) for 12 hrs are shown as peak areas measured by targeted LC-MS/MS and presented as mean ± SD of biological triplicates.
(D,E) HeLa cells (D) and MEFs (E) were treated for the indicated times with MTX (2 µM), LTX (2 µM) and 6-MP (100 µM).
(F) HeLa cells were transfected with control siRNAs (siCtl) or those targeting GART, DHODH, and TYMS for 48 hrs.
A time course of treatment revealed that mTORC1 signaling was attenuated in both HeLa cells and MEFs starting by 4 to 6 h of treatment with each of these inhibitors, with stronger inhibition at later time points (Figures 1D, 1E and S1D). However, inhibition of the pyrimidine synthesis enzymes dihydroorotate dehydrogenase (DHODH), with leflunomide (LEF), or thymidylate synthase (TYMS), with 5-fluorouracil (5-FU), which strongly depleted pyrimidines in a manner consistent with their target enzymes (Figure S1E), failed to block mTORC1 signalling, even after 24 h treatment (Figures 1B, S1F and S1G). The specific effects of these structurally distinct inhibitors were further validated through siRNA knockdowns of nucleotide synthesis enzymes, demonstrating that knockdown of the purine synthesis enzyme GART, but not the pyrimidine synthesis enzymes DHODH or TYMS, resulted in decreased mTORC1 signaling (Figure 1F).
We next sought to determine whether the addition of exogenous nucleobases or nucleosides could induce mTORC1 signaling following the depletion of intracellular nucleotides. We first tested the nucleoside inosine, as it can be used to make all purines (Figure 1A). Interestingly, following nucleotide depletion with either MTX, LTX, or MRT00252040, mTORC1 signaling was stimulated by exogenous inosine in as little as 15 minutes and was fully restored by 60 minutes of treatment (Figures 2A, S2A and S2B). Dose-response experiments showed that a 60-minute treatment with either 5 µM inosine (Figure 2B) or its nucleobase hypoxanthine (Figure S2C) was sufficient to fully reactivate mTORC1 following nucleotide depletion. This concentration is consistent with the abundance of hypoxanthine in culture serum (e.g., 10% HyClone™ Fetal Bovine Serum) and is in the physiological range of inosine and hypoxanthine in plasma (Psychogios et al., 2011; Traut, 1994). Consistent with mTORC1 responding to restoration of cellular purine nucleotides, 60-minute addition of exogenous inosine increased intracellular IMP, AMP, and GMP levels in both MTX and LTX-treated cells (Figure 2C). Inosine also completely restored mTORC1 signaling to cells depleted of nucleotides via siRNA-mediated knockdown of the purine synthesis enzymes phosphoribosyl pyrophosphate amidotransferase (PPAT) or GART (Figure 2D). In addition to hypoxanthine and inosine, mTORC1 could also be reactivated by exogenous adenosine or its nucleobase adenine, but not guanosine, guanine, or pyrimidines (uridine, cytidine, and thymidine), each provided at 5 µM for one hour (Figure 2E). Even excess guanine, up to 100 µM, failed to restore mTORC1 signaling to purine-depleted cells (Figure 2F). Exogenous addition of nucleosides and nucleobases did not influence mTORC1 signaling when endogenous nucleotide levels were intact (Figure S2D). Unlike the uniform effects on mTORC1 signaling, purine synthesis inhibitors and exogenous nucleobases and nucleosides had varying, more modest, effects on AKT and ERK activation in a manner indicating that adenylate sensing by mTORC1 is unlikely to involve these pathways (Figure 2E).
Figure 2. mTORC1 signaling is acutely restimulated by exogenous purines following purine depletion.

(A) HeLa cells were treated with MTX (2 µM) for 12 hrs, followed by inosine (5 µM) for the indicated times.
(B) HeLa cells were treated with MTX (2 µM) or LTX (2 µM) for 16 hrs, followed by inosine at the indicated concentrations for the final 1 hr.
(C) The abundance of purine nucleotides from HeLa cells treated with vehicle, MTX (2 µM), or LTX (2 µM) for 12 hrs, followed by the addition of inosine (5 µM) for the final 1 hr are shown as peak areas measured by targeted LC-MS/MS and presented as mean ± SD of biological triplicates.
(D) HeLa cells were transfected with control siRNAs (siCtl) or those targeting GART and PPAT for 48 hrs, followed by addition of inosine (5 µM) for 1 hr.
(E) HeLa cells were treated with MTX (2 µM) or LTX (2 µM) for 16 hrs, followed by addition of the indicated nucleosides and nucleobases (5 µM) for the final 1 hr.
(F) HeLa cells were treated with MTX (2 µM) for 16 hrs, followed by guanine and adenine addition at the indicated concentrations for the final 1 hr.
(G) Cancer cell lines of different origins, A375 (melanoma), ES2 (ovarian), HCT116 (colorectal), MDA-MD-453 (breast) and MCF-7 (breast), were treated with MTX (2 µM) or LTX (2 µM) for 16 hrs, followed by addition of inosine (5 µM) for the final 1 hr.
To determine how universal the inhibitory response of mTORC1 signaling to nucleotide depletion is, we tested a panel of six cancer cell lines of different origins. Importantly, as observed in HeLa cells and MEFs, depletion of purine nucleotides with MTX or LTX strongly inhibited mTORC1 signaling in all of these cell lines, and mTORC1 signaling was rapidly restored with 5 µM inosine, hypoxanthine, or adenosine, but not guanosine (Figures 2G and S2E). These collective data indicate that the activation state of mTORC1 is responsive to changes in the availability of purine nucleotides, or their derivatives.
The mTORC1 pathway specifically senses intracellular adenylates
To determine whether exogenous purine nucleosides and nucleobases need to be converted to nucleotides in order to reactivate mTORC1 in cells depleted of purines, we employed a mouse fibroblast cell line lacking the purine salvage pathway enzymes adenine phosphoribosyltransferase (APRT) and HPRT, which are necessary to convert adenine to AMP (APRT) and hypoxanthine or guanine to IMP or GMP (HPRT), respectively (Figure 1A). While purine depletion with MTX inhibited mTORC1 signaling in both Hprt+/+/Aprt+/+ and Hprt−/−/Aprt−/− cells, inosine, hypoxanthine, and adenine failed to reactivate mTORC1 in the double knockout cells, in contrast to their wild-type counterpart (Figure 3A), suggesting that these molecules must be converted to nucleotides to affect mTORC1. To test this pharmacologically, we used the HPRT inhibitor 6-MP to deplete purine levels (Figure S3A), thus strongly inhibiting mTORC1 signaling (Figure 3B). Unlike nucleotide depletion with MTX or LTX, which inhibit the de novo purine synthesis pathway, following 6-MP treatment, exogenous inosine or hypoxanthine failed to reactivate mTORC1 signaling (Figure 3B), consistent with the requirement for HPRT activity for conversion of these molecules into nucleotides. In contrast, adenine and adenosine are converted into nucleotides by APRT, and thus were able to reactivate mTORC1 following 6-MP treatment (Figure 3B). Like MTX and LTX, 6-MP did not inhibit Akt or ERK signaling, and actually increased their activation (Figure S3B), in contrast to the inhibitory effects on mTORC1.
Figure 3. The conversion of exogenous purines to adenylate, but not guanylate nucleotides is required to restimulate mTORC1 signaling following purine depletion.

(A) A9 mouse fibroblasts deficient for APRT and HPRT, or their wild-type counterparts were treated with MTX (2 µM) for 16 hrs, followed by the indicated molecules (5 µM) in the final 1 hr.
(B) HeLa cells were treated with 6-MP (100 µM) for 16 hrs, followed by the indicated molecules (5 µM) for the final 1 hr.
(C) HeLa cells were transfected with control siRNAs (siCtl) or those targeting GART, ADSS, and IMPDH1/2 for 48 hrs prior to 16 hrs treatment with MTX (2 µM) with addition of inosine (5 µM) or adenine (5 µM) for the final 1 hr.
(D) HeLa cells were treated with vehicle, MTX (2 µM) or Miz (25 µM) for 12 hrs. Graphs are the abundance of purine nucleotides from vehicle or Miz-treated cells shown as peak areas measured by targeted LC-MS/MS and presented as mean ± SD of biological triplicates.
(E) HeLa cells were treated with vehicle (Veh), MTX (2 µM), LTX (2 µM) or 6-MP (100 µM) for 12 hrs, followed by addition of adenine (5 µM) for indicated times.
As our data indicated that inosine, adenosine, or their nucleobases, but not guanosine or guanine could stimulate mTORC1 signaling following purine depletion, we next determined whether mTORC1 senses IMP or adenylate (AMP/ADP/ATP) nucleotides. We used siRNAs to knockdown expression of the de novo purine synthesis enzyme GART or either adenylosuccinate synthase (ADSS) or inosine monophosphate dehydrogenase (IMPDH1 and 2), the two branch-point enzymes from IMP to AMP and GMP, respectively (Figure 1A), and examined the response of mTORC1 to exogenous inosine following MTX treatment. Knockdown of either GART or ADSS, but not IMPDH1 and 2, attenuated mTORC1 signaling even in the absence of MTX (Figure 3C). While the effects of MTX on mTORC1 signaling could be rescued by both inosine and adenine in cells with GART knockdown, only adenine could fully rescue mTORC1 activity in cells with ADSS knockdown (Figure 3C). This result indicates that inosine and its nucleotide product IMP must be converted to AMP to reactivate mTORC1 and suggests that mTORC1 primarily senses adenylates or a derivative thereof.
The lack of an effect of IMPDH knockdown on mTORC1 signaling and its ability to sense purines (Figure 3C) is consistent with the inability of guanosine or guanine to reactivate mTORC1 upon purine depletion (Figures 2E, 2F, S2E, and 3A). To further investigate the role of guanylate molecules on mTORC1 signaling, we compared the effects of MTX treatment to the IMPDH-specific inhibitor mizoribine (MIZ) (Figure 1A). In contrast to MTX, a 12 h treatment with mizoribine failed to inhibit mTORC1 signaling (Figure 3D). Metabolite profiling confirmed the specific effects of mizoribine on IMPDH, resulting in a marked increase in its substrate IMP, a decrease in its product GMP, and no change in AMP. Thus, mTORC1 signaling does not appear to be influenced by either IMP or guanylates, but rather adenylates.
A time course of treatment with 5 µM exogenous adenine revealed that mTORC1 signaling was robustly reactivated within 15 minutes in cells exposed to any one of three purine synthesis inhibitors, MTX, LTX, and 6-MP (Figure 3E). Acute supplementation with adenine increases the endogenous levels of all purine nucleotide species in cells treated with MTX (Figure S3C). Importantly, the ability of adenine or inosine to rescue mTORC1 signaling in MTX-treated cells was unaffected by inhibition of guanylate synthesis with mizoribine, which itself partially rescued the effects of MTX, likely by allowing existing IMP to accumulate and be converted to AMP (Figure S3D). These collective findings indicate that mTORC1 activity is sensitive to intracellular levels of adenylates, but not IMP or guanylate derivatives.
Inhibition of purine synthesis does not affect cellular energy charge and the inhibitory effects on mTORC1 are independent of AMPK
Metabolic perturbations in ATP synthesis result in energy stress that is characterized by ATP depletion with a concomitant increase in AMP levels. Energy stress is known to inhibit mTORC1 signaling, at least in part through AMPK signaling, which is activated by an increase in the AMP/ATP ratio (Gowans et al., 2013; Hardie et al., 2012) (Figure 4A). In order to assess whether purine sensing by mTORC1 might involve a response to energy stress, the effects of purine synthesis inhibitors on ATP levels were measured. MTX, LTX, and 6-MP had similar effects on ATP levels in HeLa cells and MEFs, decreasing ATP in a time-dependent manner (Figure 4B). However, this decrease in ATP abundance was not accompanied by discernable induction of AMPK activity (Figure 4C and 4D). These purine synthesis inhibitors also did not have effects on ERK phosphorylation or markers of mTORC2 activity, such as phosphorylation of Akt and NDRG1 (Figures 2E, S3B, and S4A). Furthermore, no detectable decrease in global kinase activity was observed using a pan-phospho-serine immunoblot of lysates from cells before and after acute treatment with the phosphatase inhibitor Calyculin A (Figures S4B and S4C). Direct measurements of AMP, ADP, and ATP concentrations following 8h treatment with the three purine synthesis inhibitors demonstrated that these adenylate molecules are all depleted and are acutely restored following 1h addition of inosine (Figure 4E). These analyses allowed a calculation of the effects of purine depletion and addition on the adenylate energy charge, which is defined as ([ATP] + ½[ADP])/([ATP] + [ADP] + [AMP]). Because all three species of adenylates are depleted proportionally, there was no significant change in energy charge in response to purine synthesis inhibitors (Figure 4F). This is in stark contrast to classic energy stress-inducing compounds, such as phenformin, a biguanide inhibitor of complex I of the electron transport chain. Phenformin is a potent inhibitor of mTORC1 signaling (Figure S4D), but its depletion of cellular ATP is accompanied by a robust increase in ADP and AMP levels, thereby decreasing the adenylate energy charge (Figures 4G and 4H).
Figure 4. The inhibitory effects of purine depletion on mTORC1 signaling are distinct from energy stress and independent of AMPK.

(A) Schematic of the integrated regulation of mTORC1 at the lysosome.
(B) ATP levels per cell in HeLa and MEFs treated with MTX (2 µM), LTX (2 µM), or 6-MP (100 µM) for the indicated times are shown as the percent of vehicle-treated cells and presented as mean ± SD of biological triplicates.
(C) MEFs were treated with vehicle (Veh), MTX (3 µM), LTX (3 µM), 6-MP (100 µM) or phenformin (Phen, 2mM) for 12h.
(D) HeLa cells were treated with vehicle (Veh), MTX (2 µM), LTX (2 µM), or 6-MP (100 µM) for 8h, with inosine (Ino, 5 µM) for the final 1 hr.
(E–F) Concentration (µM per 106 cells) (E) and calculated energy charge (F) of AMP, ADP, and ATP measured by enzymatic assays on extracts from cells treated as in (D). Data are shown as mean ± SD of biological triplicates and are representative of at least two independent experiments.
(G–H) Concentration (G) and calculated energy charge (H) of AMP, ADP, and ATP were measured and presented as in (E,F) for cells treated with phenformin (Phen, 2mM) for 4h. Data are shown as mean ± SD of biological triplicates and are representative of at least two independent experiments. *p < 0.05 by two-tailed Student’s t test.
(I) Wild-type and AMPKα1,α2 double knockout (DKO) MEFs were treated for the indicated times with MTX (2 µM) or LTX (2 µM).
(J) ATP levels per cell in wild-type and AMPKα1/α2 DKO MEFs treated with vehicle (Veh), MTX (2 µM), or LTX (2 µM) for 8 hrs are shown relative to Veh and presented as mean ± SD of biological triplicates.
To genetically test the dependence of adenylate sensing by mTORC1 on AMPK, we utilized AMPKα1−/− α2−/− MEFs (AMPK DKO) which lack both catalytic subunits of AMPK (Toyama et al., 2016). Importantly, AMPK-deficient MEFs and their wild-type counterparts showed comparable time-dependent mTORC1 inhibition with LTX and MTX treatments (Figure 4I and S4E), as well as similar decrease in ATP levels (Figure 4J). These data indicate that mTORC1 inhibition in response to purine depletion is independent of AMPK activation.
The bulk of cellular ATP comes from mitochondrial respiration and exchange of cytosolic ADP for mitochondrial-charged ATP. To assess the involvement of mitochondria in mTORC1 inhibition after purine depletion, we employed a doxycycline-inducible dominant-negative form of POLG in HEK293 cells (DN-POLG cells), which genetically ablates mtDNA and leads to loss of mitochondrial function (Wanrooij et al., 2007; Reyes I et al., 2015). Indeed, doxycycline-induced expression in DN-POLG resulted in a loss of the mitochondrial-encoded complex I subunit MT-ND1 (Figure S4F). A time course of nucleotide depletion led to a similar decrease in mTORC1 signaling in the WT and DN-POLG cells (Figure S4F). However, treatment of these cells with 2-deoxyglucose, which blocks glycolysis, led to an immediate and complete inhibition of mTORC1 signaling specifically in the DN-POLG cells, consistent with their complete dependence on glycolysis for their energy, the depletion of which leads to mTORC1 inhibition. These data suggest that mTORC1 inhibition is not dependent on mitochondrial adenylate pools or mitochondrial metabolism.
Another mechanism of mTORC1 inhibition that involves changes in intracellular ATP levels is through effects on the ATP-dependent TTT-RUVBL1/2 complex (Kim et al., 2013). This chaperone complex is inhibited by severe energy stress, leading to a decrease in mTOR protein stability and mTORC1 assembly. However, even 12 hours of purine depletion with MTX treatment did not result in changes in mTOR protein levels or integrity of mTORC1, nor was the complex affected by stimulation with inosine (Figure S4G). Taken together, these data indicate that the inhibitory effects of purine depletion on mTORC1 signaling are distinct from known energy stress response pathways established to regulate mTORC1.
Upstream of mTORC1, purine sensing is dependent on the TSC-Rheb circuit, but not the Rag GTPases
Activation of mTORC1 in response to amino acids occurs through the coordinated action of the Rag and Rheb GTPases on the cytosolic face of the lysosome (Figure 4A). Depletion of purine nucleotides with MTX or LTX increased nearly all amino acids, including Arg and Leu, which are particularly important for the activation of mTORC1 (Figure S5A). This finding is consistent with the inhibitory effects of these compounds on mTORC1 signaling, and hence amino acid utilization for protein synthesis, and is similar to that observed with rapamycin treatment (Figure S5A). It also indicates that the effects of purine depletion on mTORC1 signaling are not through secondary effects on intracellular amino acids. siRNA-mediated knockdown or CRISPR–Cas9 knockout of the GATOR1 component DEPDC5, a critical negative regulator of the amino acid-sensing Rag pathway (Bar-Peled et al., 2013), did not substantially influence mTORC1 inhibition in response to MTX treatment (Figure 5A, S5B, and S5C), but did render cells partially resistant to amino acid deprivation (Figure S5D). Moreover, constitutively-active RagAGTP/GTP knock-in MEFs, which are resistant to both amino acid deprivation and glucose starvation (Efeyan et al., 2013), showed a decrease in mTORC1 signaling and stimulation with inosine following MTX treatment that was similar to their wild-type counterparts (Figure 5B). Consistent with these results, localization of mTOR to the lysosome was not reduced following MTX-induced purine depletion but was instead increased, perhaps due to the concomitant elevation of amino acids (Figures S5A, 5C and S5D). Together, these results demonstrate that regulation of mTORC1 activity by intracellular purines occurs independently of the established amino acid-sensing pathway.
Figure 5. TSC2 is required for the inhibition of mTORC1 upon nucleotide depletion.

(A) HeLa cells were transfected with control siRNAs (siCtl) or those targeting TSC2 or DEPDC5 for 48 hrs and treated with MTX (2 µM) for the indicated times. Short (SE) or long (LE) exposures of immunoblots are indicated.
(B) RagA+/+ and RagAGTP/GTP MEFs were deprived of amino acids (90 min) followed by readdition (AA, 20 min) (left panel) or treated with LTX (2 µM) for 16 h followed by addition inosine (5 µM) for the final 1 hr (right panel).
(C) Representative images of mTOR-Lamp2 colocalization in HeLa cells treated for 16 hrs with vehicle (Veh), MTX (2 µM), or MTX with inosine (5 µM) added for the final 1 hr. Percent colocalization are graphed as a mean ±SD.
(D) Tsc2+/+ and Tsc2−/− MEFs were treated with MTX (4 µM), LTX (4 µM), or 6-MP (100 µM) for the indicated times.
(E) Relative pS6K to S6K ratios were quantified from three independent experiments described in 5D and S5F. The values were normalized for each cell line and time course to their respective untreated samples (time zero) and are presented as mean ± SEM. *P < 0.05 for comparison of Tsc2−/− to Tsc2+/+ cells following the indicated 12 h treatments.
(F) Concentration (µM per 106 cells) of ATP from Tsc2+/+ and Tsc2−/− MEFs treated with vehicle (Veh), MTX (4 µM), LTX (4 µM) and 6-MP (100 µM) for the indicated times. Data are shown as mean ± SD of biological triplicates and are representative of at least two independent experiments.
(G) Tsc2−/− MEFs expressing empty vector or reconstituted with wild-type TSC2 or a GAP-dead TSC2 variant (N1643K) were treated with MTX (3 µM) for the indicated times.
(H) Representative images of TSC2-Lamp2 colocalization in HeLa cells treated with MTX (2 µM, 8 hrs), followed by addition of inosine (5 µM) for the final 1 hr. Percent colocalization are graphed as a mean ±SD.
We next examined whether the TSC-Rheb branch of mTORC1 regulation is involved in the sensing of changes in purine nucleotides by mTORC1. In contrast to DEPDC5, transient or stable knockdown of TSC2 significantly blunted the time-dependent decrease in mTORC1 signaling upon purine depletion in HeLa cells (Figures 5A). Treatment of littermate-derived Tsc2+/+ and Tsc2−/− MEFs with a time course of MTX, LTX, or 6-MP revealed, in each case, that mTORC1 signaling was more resistant to purine depletion in Tsc2−/− MEFs, with inosine or adenine rescuing the inhibition in the wild-type cells without substantial effects on Tsc2−/− cells (Figures 5D, 5E and S5F, S5G, S5H and S5I). ATP levels in Tsc2+/+ and Tsc2−/− MEFs decreased similarly following 8h or 16h treatment with purine synthesis inhibitors (Figure 5F), indicating that TSC2 status does not influence the effectiveness of these inhibitors at depleting intracellular adenylates. In an isogenic Tsc2 null kidney tumor-derived cell line (105K) stably expressing either empty vector or TSC2, mTORC1 signaling was resistant to purine depletion in the cells lacking TSC2 (Figure S5J). Finally, reconstitution of Tsc2−/− MEFs with wild-type TSC2, but not a GAP-dead mutant of TSC2 (N1643K), restored sensitivity of these cells to purine depletion (Figure 5G), indicating that the TSC complex must be able to inhibit Rheb for mTORC1 to properly sense purines. In accordance with this, constitutively active Rheb (Q64L) rendered HeLa cells resistant to purine depletion (Figure S5K). Since growth factor withdrawal inhibits mTORC1 via increased translocation of the TSC complex to Rheb at the lysosome (Menon et al., 2014), we investigated the effects of purine depletion and re-addition on TSC2 localization. However, we did not detect further accumulation of TSC2 at the lysosome following MTX treatment, nor was it influenced by inosine addition (Figure 5H and S5L). Purine nucleotide depletion and re-addition also had no effect on levels of the three TSC complex components or integrity of the TSC complex (Figure S5M).
In analyzing effects on Rheb downstream of the TSC complex, we observed a striking decrease in Rheb protein levels after purine depletion in both HeLa cells and MEFs (Figure 6A and 6B), without corresponding changes in Rheb transcript levels (Figure S6A). We confirmed the specificity of two independent Rheb antibodies with Rheb knockdown and treatment with a farnesyl-transferase inhibitor (FTI-277), which causes a mobility shift to the slower-migrating unfarnesylated form, without effects on Rheb levels (Figure 6A). The decrease in Rheb protein levels are not a secondary consequence of mTORC1 inhibition, as in contrast to purine synthesis inhibitors, neither direct mTORC1 inhibitors (rapamycin or Torin1) nor the energy stress-inducing agent phenformin induced Rheb depletion (Figure 6C). Purine depletion did not affect the levels of other small G proteins influencing the mTORC1 pathway, including RagA, RagB, and K-Ras (Figure 6D), demonstrating some degree of specificity for Rheb. Co-treatment of MTX with the proteasome inhibitor MG132, but not the lysosomal inhibitor Bafilomycin A, resulted in restoration of Rheb protein levels (Figure 6E), suggesting a proteasome-mediated degradation of Rheb upon purine depletion.
Figure 6. Rheb protein levels are diminished with prolonged depletion of purine nucleotides.

(A) HeLa cells were treated with vehicle (Veh), MTX (2 µM), LTX (2 µM), 6-MP (100 µM), MRT00252040 (2 µM) or FTI-277 (10 µM) for 16 hrs, or transfected with control siRNAs (Ctl) or those targeting Rheb1 and Rheb2 for 48 hrs (first two lanes). Rheb immunoblots with two independent antibodies are shown for validation. For the CST antibody, *indicates a prominent non-specific band, with an arrow indicating the Rheb-specific band depleted with Rheb siRNAs. The Abnova antibody was used in all other blots.
(B) MEFs were treated with vehicle (Veh), MTX (4 µM), LTX (4 µM), 6-MP (100 µM), or MRT00252040 (4 µM) for 16 hrs.
(C) HeLa cells were treated for 16 hrs with MTX (2 µM), LTX (2 µM), 6-MP (100 µM), Torin1 (250 nM), rapamycin (Rap, 20 nM), or phenformin (1 mM).
(D) HeLa cells were treated with vehicle or MTX (2 µM) for 16 hrs.
(E) HeLa cells were treated for 16 hrs with MTX (2 µM) in the presence or absence of MG132 (1 µM) or Bafilomycin (BAF, 1 µM).
(F) HeLa cells were treated with MTX (2 µM) for the indicated times.
(G) HeLa cells were treated with MTX (2 µM) for 12 hrs, followed by addition of inosine (5 µM) for the indicated times.
(H) Representative images of Rheb-Lamp1 colocalization in HeLa cells treated for 8 hrs with vehicle (Veh), MTX (2 µM), or MTX with addition of inosine (5 µM) for the final 1 hr, or treated for 16 hrs with vehicle (Veh), MTX (2 µM) or FTI-277 (10 µM). Percent colocalization is graphed as a mean ± SD.
(I) HeLa cells were treated with MTX (2 µM) for 16 hrs followed by addition of guanine or adenine at the indicated concentrations for the final 1 hr. The abundance of GMP and AMP from the same conditions as the Immunoblots are shown as peak areas measured by targeted LC-MS/MS and presented as mean ± SD of biological triplicates.
An analysis of the kinetics of the decrease in Rheb over time revealed that it does not start until after 8h of treatment with MTX, 6-MP, or the PAICS inhibitor, and is much stronger at 16 to 24h of purine depletion (Figures 6F, S6B, and S6C). Importantly, the decrease in Rheb lags behind the inhibition of mTORC1 signaling by several hours. Likewise, a time course of inosine addition to purine-depleted cells showed that Rheb levels begin to recover starting around 90 minutes with full recovery taking 4 hours or more, while mTORC1 stimulation is detectable at 15 minutes and peaks by 60 minutes (Figure 6G). These findings indicate a separation in timing between effects of purine nucleotides on Rheb levels and mTORC1 signaling.
Since Rheb activates mTORC1 at the lysosome, Rheb localization was analyzed following MTX-induced purine depletion. We found that co-localization of a sub-population of Rheb with the lysosomal marker LAMP1 was not altered at 8h, nor did it change with addition of inosine for 1 hour (Figure 6H), treatments that respectively inhibit and fully reactivate mTORC1 signaling. However, long-term purine depletion (16h) resulted in decreased Rheb immunofluorscence and lysosomal localization, whereas treatment with a farnesyltransferase inhibitor (FTI) decreased Rheb-LAMP1 co-localization without effects on Rheb protein levels (Figures 6H and 6A). Again, 1-hour treatment with 5 µM adenine fully reactivated mTORC1 signaling in purine-depleted cells, whereas even 40 µM guanine had no effect, despite a robust increase in intracellular guanylate levels (Figure 6I and S6D). Neither adenine nor guanine restored Rheb levels at 1 hour, further demonstrating a functional separation in the short-term sensing of adenylates by mTORC1 and the additional effects of long-term purine depletion on Rheb levels (Figure 6I).
Rheb protein levels are decreased upon long-term depletion of guanylates
Just prior to submission of this manuscript, a study by Emmanuel et al. (Emmanuel et al., 2017) showed that inhibition of the de novo purine synthesis pathway, with a compound that like LTX inhibits GART, also inhibits mTORC1 signaling. The authors conclude that mTORC1 activity is regulated by guanylate availability through a mechanism leading to decreased farnesylation of Rheb, whereas we find a dominant and acute role for adenylates. One reason for the discrepant conclusion regarding the involvement of guanylates in this regulation is that the early kinetics of the mTORC1 response to different purine bases and nucleosides was not examined in this other study, only overnight treatments. As shown in Figure 6A, we also do not detect changes in endogenous Rheb that are consistent with defects in farnesylation, rather the protein is degraded over time with purine depletion using any one of multiple different purine synthesis inhibitors. However, the findings of Emmanuel and colleagues (Emmanuel et al., 2017) prompted us to determine whether the effects of long-term purine depletion on Rheb degradation could be through changes in guanylates, even if they were unrelated to the acute sensing of adenylates by mTORC1.
To more closely compare the differences between the two studies, we used the two lung cancer cell lines (A549 and A427) and IMPDH inhibitor (AVN-944) primarily used in the Emmanuel et al. study (Emmanuel et al., 2017), and examined time-dependent effects on mTORC1 signaling and Rheb. Interestingly, 16-hour treatment with AVN-944 depleted guanylates but not adenylates and lead to decreased Rheb protein levels in A549 cells, which were rescued with excess exogenous guanine, partially at 1 hour and fully when co-treated for the 16-hours with AVN-944 (Figure 7A, 7B, and S7A), the paradigm used by Emmanuel et al. (Emmanuel et al., 2017). However, our laboratory stock of A549 cells exhibited complete resistance to this compound for effects on mTORC1 signaling, even at doses 10-fold higher than that which leads to Rheb depletion, further demonstrating a separation of the Rheb effects from those on mTORC1 (Figure 7C). mTORC1 signaling in these cells was modestly sensitive to prolonged treatment with a second IMPDH inhibitor, mycophenolic acid (MPA), which again had pronounced effects on Rheb protein levels. As with all of the cell lines examined in our study, mTORC1 signaling and Rheb levels were sensitive to MTX treatment in A549 cells, and mTORC1 signaling, but not Rheb, could be rescued with 1-hour addition of physiological concentrations of adenine, whereas guanine failed to rescue even at supraphysiological concentrations (Figure 7D). Unlike 1-hour purine readdition, long duration co-treatment of MTX with guanine or adenine was sufficient to restore Rheb levels, and while short or long-term adenine treatment could fully rescue mTORC1 signaling, only a modest rescue of mTORC1 was detected with prolonged supplementation with excess guanine (Figure 7E). The differential and temporal effects of guanine and adenine addition track well with changes in intracellular guanylates and adenylates in this experiment (Figure 7F and S7B).
Figure 7. Guanylate availability influences Rheb protein levels.

(A) A549 cells were treated with AVN-944 (0.5 µM) for 16h, in the presence of absence of excess guanine (40 µM) for the duration of treatment or for the final hour.
(B) The abundance of purine nucleotides from A549 cells treated as in (A) are shown as peak areas measured by targeted LC-MS/MS and presented as mean ± SD of biological triplicates.
(C) A549 cells were treated overnight with the indicated concentrations of AVN-944 and MPA.
(D) A549 cells were treated with MTX (2 µM) for 16 hrs, followed by guanine and adenine addition at the indicated concentrations for the final 1 hr.
(E) A549 cells were treated with MTX (2 µM) for 16h, in the presence of absence of excess guanine (40 µM) or adenine (40 µM) for the duration of treatment or for the final hour.
(F) The abundance of purine nucleotides from A549 cells treated as in (E) are shown as peak areas measured by targeted LC-MS/MS and presented as mean ± SD of biological triplicates.
(G) A427 cells were treated with AVN-944 (0.5 µM) or MTX (2 µM) for 16h, in the presence of absence of guanine (40 µM) or adenine (40 µM) for the duration of treatment or for the final hour.
(H) HeLa cells were treated with AVN-944 (0.5 µM), MPA (1 µM), Miz (25 µM), MTX (2 µM) or 6MP (100 µM) for 14h, in the presence of absence of guanine (40 µM) or adenine (40 µM) for the duration of treatment.
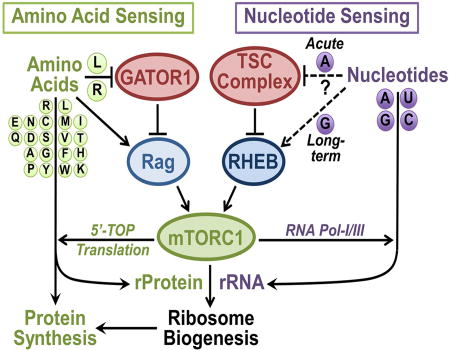
(I) Working model suggesting that purine nucleotide levels are monitored by mTORC1 through the TSC-Rheb axis, with acute effects from adenylates through the TSC complex, and more long-term effects on Rheb protein level by guanylates, acting in parallel to the GATOR1-Rag amino acid sensing pathway.
MTX also inhibited mTORC1 signaling in A427 cells, and again, this could be rescued by short-term treatment with adenine, but neither short- nor long-term treatment with guanine (Figure 7G). Both MTX and AVN-944 treatment decreased Rheb protein levels in this cell line, and the pronounced decrease in Rheb induced by AVN-944 was accompanied by partial inhibition of mTORC1 signaling. Interestingly, prolonged treatment with either guanine or adenine could restore Rheb levels to MTX treated cells, but only guanine could restore Rheb following AVN-944 treatment (Figure 7G). A similar effect was seen in HeLa cells, where treatment with three different IMPDH inhibitors, AVN-944, MPA, and, to a lesser degree, mizorbine led to a decrease in Rheb protein levels that were partially rescued with guanine but not adenine (Figure 7H). Guanine could also partially rescue Rheb in MTX treated cells, but not those treated with 6-MP, an inhibitor of the salvage enzyme HPRT required to convert exogenous guanine into GMP (Figure 1A). Adenine could rescue Rheb in MTX or 6-MP-treated cells, along with fully reactivating mTORC1 signaling, but could not restore Rheb levels to cells treated with IMPDH inhibitors (Figure 7H), in accordance with the need for IMPDH for adenine to be converted into guanylates.
These collective data are fully consistent with the prolonged effects of purine depletion on Rheb degradation being driven primarily by a decrease in intracellular guanylates. Changes in Rheb mobility consistent with loss of farnesylation were not detected in our experiments. While Rheb levels were decreased to varying degrees with all of the purine synthesis inhibitors used in this study, Rheb was never fully depleted and thus, maintained the capacity to acutely reactivate mTORC1 signaling upon restoration of adenylates. Taken together, our findings suggest that there are two subsequent modes of inhibition of mTORC1 upon depletion of cellular purine nucleotides: a short-term effect under the influence of adenylate levels that requires the TSC complex and its GAP activity toward Rheb and a more prolonged effect leading to Rheb degradation that is sensitive to changes in guanylate levels (Figure 7I).
Discussion
This study indicates that the mTORC1 signaling network can sense changes in intracellular nucleotide levels in a manner dependent on the TSC-Rheb branch of upstream regulation, in parallel to its sensing of amino acids through the GATOR1-Rag branch. Analogous to amino acid sensing by mTORC1, which is particularly sensitive to a subset of amino acids, including Leu and Arg (Hara et al., 1998), we find that mTORC1 activity is predominantly and acutely dependent upon adenylate levels, with lesser contribution from guanylates mediated via long-term effects on Rheb protein levels (Figure 7I). No effects on mTORC1 signaling were observed with specific depletion or addition of pyrimidines. Another parallel to be drawn to amino acid sensing is that, like protein synthesis from amino acids, mTORC1 drives rRNA synthesis from nucleotides. Thus, the ability of mTORC1 to independently sense changes in the availability of both amino acid and nucleotide pools assures that downstream signals promoting protein and RNA synthesis, and ribosome production, are only sent when these precursors are sufficiently abundant.
While our genetic evidence demonstrates dependence on the TSC-Rheb circuit for the response of mTORC1 to acute changes in intracellular purine levels, both the precise metabolite being sensed and the identity of the sensor remain unknown. We find that exogenous purine nucleobases and nucleosides must be converted to adenylate nucleotides in order to restore mTORC1 signaling to purine-depleted cells. Adenylates function not only as constituents of RNA and DNA but are also robustly consumed for other cellular processes, serving as an energy source, a precursor for essential cofactors, such as NAD and FAD, and a substrate for numerous protein and metabolic kinases (Lane and Fan, 2015). Importantly, adenylates are required for the synthesis of both guanylates and pyrimidines. Our identification of adenylates as the primary nucleotide being sensed acutely by the mTORC1 pathway suggests that intracellular adenylate levels might serve as a proxy for total nucleotide abundance in cells. It remains possible that ATP is the primary molecule sensed, likely upstream of the TSC-Rheb circuit, to regulate mTORC1, but our findings are not consistent with adenylate nucleotide depletion inhibiting mTORC1 through established energy stress response mechanisms, including AMPK and TTT-RUVBL (Gwinn et al., 2008; Inoki et al., 2003; Kim et al., 2013). Importantly, one of the first studies demonstrating that energy stress inhibits mTOR signaling suggested that mTOR itself was an ATP sensor (Dennis et al., 2001). The study predated the identification of mTORC1 and mTORC2, and a recent study suggested that such a mechanism was influencing mTORC2 (Chen et al., 2013). However, we did not detect changes in mTORC2-dependent phosphorylation events that would implicate a direct sensing mechanism on mTOR to explain the effects of purine depletion on mTORC1 signaling. Our findings that TSC2-deficient cells fail to inhibit mTORC1 signaling in response to purine depletion, despite exhibiting a similar decrease in ATP levels to TSC2-expressing cells, suggest that the sensing mechanism is upstream of, or parallel to, the TSC complex rather than on mTOR itself. Which adenylate derivative is being sensed and how awaits further study.
The best characterized upstream input into mTORC1 regulation through the TSC complex is growth factor signaling, which via AKT-mediated phosphorylation of TSC2 stimulates acute release of the TSC complex from Rheb at the lysosome, allowing Rheb-GTP to accumulate and activate mTORC1 (Menon et al., 2014). However, acute stimulation of mTORC1 signaling in purine-depleted cells with exogenous inosine does not have detectable effects on TSC complex localization, indicating a distinct mechanism of regulation. We found that the GAP activity of TSC2 is required for mTORC1 inhibition in response to purine depletion, but future studies are needed to determine whether the GAP activity of the intact TSC complex towards Rheb or the GTP-binding status of endogenous Rheb is altered upon acute nucleotide depletion. These analyses must be done with endogenous proteins, which has been historically difficult. Interestingly, we found that prolonged inhibition of purine synthesis results in decreased Rheb protein levels in a proteasome-dependent manner, indicative of protein degradation. We found that specific depletion of guanylates results in diminished Rheb protein abundance, with Rheb levels being restored by long term, but not acute, addition of excess levels of exogenous guanine. Importantly, the kinetics of both the degradation and restoration of Rheb by purine depletion and addition, respectively, indicate that these effects on Rheb levels are not primarily responsible for the more acute effects on mTORC1 signaling observed but could contribute to the long-term regulation of mTORC1. The diminished levels of Rheb remaining are sufficient to fully restimulate mTORC1 signaling within minutes of supplementation with exogenous inosine or adenine, but not guanine, with Rheb protein levels not being fully restored until hours later. This effect suggests that Rheb protein levels are not a major limiting factor for mTORC1 activation and is consistent with a global quantitative proteomic study that measured Rheb levels to be in roughly 100-fold excess of both mTOR and Raptor levels in HeLa cells (Nagaraj et al., 2011). How intracellular guanylates affect Rheb abundance is not currently known.
The study by Emmanuel et al. (Emmanuel et al., 2017) also demonstrated that mTORC1 signaling is sensitive to purine nucleotides. However, the authors conclude that mTORC1 activity is inhibited by guanylate depletion through effects on Rheb-GTP binding and farnesylation leading to loss of Rheb lysosomal localization. Looking exclusively at endogenous Rheb, we did not detect changes in Rheb electrophoretic mobility that would be consistent with effects on farnesylation with any of our treatments. Instead, through the use of seven structurally distinct compounds targeting different enzymes of either the de novo or salvage pathways of purine synthesis, we observed a decrease in Rheb protein abundance, which can be rescued over time by exogenous guanine, indicating a role for guanylates in maintaining Rheb levels. We find in multiple cell lines that guanylate abundance has minor and varying effects on mTORC1 signaling, despite uniform changes in Rheb protein levels upon guanylate depletion. While it is difficult to explain the discrepant findings on Rheb farnesylation and degradation between the Emmanuel et al. study (Emmanuel et al., 2017) and that presented here, the different conclusions regarding the relative contributions of adenylates and guanylates largely stems from timing of the experiments. In their study, Emmanuel et al. employ overnight treatments with either a GART or IMPDH inhibitor plus supplementation with exogenous nucleobases to examine effects on mTORC1 signaling. Our use of time course experiments for both the purine synthesis inhibitor treatments and readdition of physiological concentrations of nucleosides and nucleobases revealed the more acute temporal nature of this regulation and its strict dependence on adenylates. These experiments also demonstrated a clear separation between the effects of purine depletion and addition on mTORC1 signaling, mediated by adenylates, and on Rheb protein levels, mediated by guanylates.
Collectively, our study and that of Emmanuel et al. (Emmanuel et al., 2017) provide insights into the molecular effects of purine synthesis inhibitors on a major growth-regulating signaling pathway in cells. The degree to which different inhibitors of purine synthesis block mTORC1 signaling will certainly vary between cell types due, in large part, to whether the cells are predominantly using the de novo or salvage pathways to produce their intracellular pools of adenylates. Purine synthesis inhibitors blocking either de novo synthesis (e.g., MTX) or the salvage pathway (e.g., 6-MP) were among the first agents used as chemotherapeutics for the treatment of cancer and, like rapamycin, are also used as immunosuppressant drugs (Chabner and Roberts, 2005). Therefore, it will be interesting to determine whether some of the anti-neoplastic and immunomodulatory effects of this class of compounds are due to mTORC1 inhibition secondary to adenylate depletion. In light of this discovery, rational combinations of purine-depleting drugs with compounds targeting additional oncogenic pathways could lead to improved cancer therapies.
Experimental Procedures
Cell Culture
ES-2, MDA-MB-453, MCF7, A549 and A427 were maintained in RPMI containing 10% fetal bovine serum (FBS). All other cell lines were maintained in DMEM containing 10% FBS. For nucleotide depletion experiments, cells were cultured in DMEM or RPMI with 10% dialyzed FBS (dFBS) or, where indicated, 10% FBS. Subconfluent cells were treated with 2 µM methotrexate (MTX), 2 µM lometrexol (LTX), 100 µM 6-mercaptopurine (6-MP), 2 µM MRT00252040 (LifeArc, London, UK), 10 µM leflunomide (LEF), 1 µM 5-Fluorouracil (5-FU), or 25 µM Mizoribine (MIZ), unless otherwise indicated, for the indicated durations. Exogenous nucleobases and nucleosides (Sigma) were added at 5 µM concentrations for 1 hr, unless otherwise indicated. For detailed information, see Supplemental Experimental Procedures.
Cell lysis, immunoprecipitation, immunoblotting and antibodies
Protein extracts were prepared as previously described (Ben-Sahra et al., 2016). All immunoblot experiments were repeated in multiple independent experiments, with representative results presented. For detailed information, see Supplemental Experimental Procedures.
Immunofluorescence Microscopy
Immunofluorescence experiments were performed as described previously (Menon et al., 2014). For detailed information, see Supplemental Experimental Procedures.
Adenine nucleotide and metabolite measurements
Cellular concentrations of AMP, ADP, and AMP were measured as previously described (Meng et al., 2015). To determine the relative levels of intracellular nucleotides and amino acids, extracts were prepared and analyzed by LC-MS/MS as previously described (Ben-Sahra et al., 2016). For detailed information, see Supplemental Experimental Procedures.
mRNA expression
For quantification of mRNA levels, total cellular RNA was isolated from cells, reverse-transcribed, and cDNAs quantified by real-time PCR. For detailed information, see Supplemental Experimental Procedures.
Statistical Analysis
For pairwise comparisons, two-tailed Student’s t tests were used. All experimental data shown are representative of at least two independent experiments, with that in Figures 3C, 4I, 5D, 6A, and 6E being representative of three or more independent experiments. Error bars are presented as mean ± SD or mean ± SEM, as indicated in the figure legends.
Supplemental Information
Supplemental information includes Supplemental Experimental Procedures and seven supplemental figures and legends.
Supplementary Material
Highlights.
Depletion of purine but not pyrimidine nucleotides inhibits mTORC1 signaling.
The mTORC1 pathway acutely senses changes in intracellular adenylates.
Adenylate sensing is dependent on the TSC complex but not AMPK or the Rag GTPases.
Long-term guanylate depletion decreases Rheb protein levels.
Acknowledgments
We thank Alexander Valvezan for helpful discussions, insights, and cell lines, David Kwiatkowski, Elizabeth Henske, Reuben Shaw, Navdeep Chandel, and David Sabatini for cell lines, and Kevin Buchan and Debbie Taylor from LifeArc for providing the PAICS inhibitor. This work was supported by a postdoctoral fellowship (G.H.) and a Rothberg Courage Award (B.D.M.) from the Tuberous Sclerosis Alliance and NIH/NCI grants R00CA194192 (I.B.S.), P01-CA120964 (B.D.M. and J.A.), and R35-CA197459 (B.D.M.). B.D.M. is a shareholder and scientific advisory board member of Navitor Pharmaceuticals and LAM Therapeutics.
Footnotes
Publisher's Disclaimer: This is a PDF file of an unedited manuscript that has been accepted for publication. As a service to our customers we are providing this early version of the manuscript. The manuscript will undergo copyediting, typesetting, and review of the resulting proof before it is published in its final citable form. Please note that during the production process errors may be discovered which could affect the content, and all legal disclaimers that apply to the journal pertain.
Author Contributions
G.H., I.B.S., and J.H.H. guided and performed most experiments, with assistance from R.C.T.. M.Y. and J.M.A. measured metabolites via LC-MS. E.I. provided technical assistance. G.H., I.B.S, J.H.H., and B.D.M. conceived and designed the project, which was supervised by B.D.M.
References
- Bar-Peled L, Chantranupong L, Cherniack AD, Chen WW, Ottina KA, Grabiner BC, Spear ED, Carter SL, Meyerson M, Sabatini DM. A Tumor suppressor complex with GAP activity for the Rag GTPases that signal amino acid sufficiency to mTORC1. Science. 2013;340:1100–1106. doi: 10.1126/science.1232044. [DOI] [PMC free article] [PubMed] [Google Scholar]
- Ben-Sahra I, Howell JJ, Asara JM, Manning BD. Stimulation of de novo pyrimidine synthesis by growth signaling through mTOR and S6K1. Science. 2013;339:1323–1328. doi: 10.1126/science.1228792. [DOI] [PMC free article] [PubMed] [Google Scholar]
- Ben-Sahra I, Hoxhaj G, Ricoult SJ, Asara JM, Manning BD. mTORC1 induces purine synthesis through control of the mitochondrial tetrahydrofolate cycle. Science. 2016;351:728–733. doi: 10.1126/science.aad0489. [DOI] [PMC free article] [PubMed] [Google Scholar]
- Ben-Sahra I, Manning BD. mTORC1 signaling and the metabolic control of cell growth. Curr Opin Cell Biol. 2017;45:72–82. doi: 10.1016/j.ceb.2017.02.012. [DOI] [PMC free article] [PubMed] [Google Scholar]
- Chabner BA, Roberts TG., Jr Timeline: Chemotherapy and the war on cancer. Nat Rev Cancer. 2005;5:65–72. doi: 10.1038/nrc1529. [DOI] [PubMed] [Google Scholar]
- Chen CH, Kiyan V, Zhylkibayev AA, Kazyken D, Bulgakova O, Page KE, Bersimbaev RI, Spooner E, Sarbassov dos D. Autoregulation of the mechanistic target of rapamycin (mTOR) complex 2 integrity is controlled by an ATP-dependent mechanism. J Biol Chem. 2013;288:27019–27030. doi: 10.1074/jbc.M113.498055. [DOI] [PMC free article] [PubMed] [Google Scholar]
- Dennis PB, Jaeschke A, Saitoh M, Fowler B, Kozma SC, Thomas G. Mammalian TOR: a homeostatic ATP sensor. Science. 2001;294:1102–1105. doi: 10.1126/science.1063518. [DOI] [PubMed] [Google Scholar]
- Dibble CC, Elis W, Menon S, Qin W, Klekota J, Asara JM, Finan PM, Kwiatkowski DJ, Murphy LO, Manning BD. TBC1D7 is a third subunit of the TSC1–TSC2 complex upstream of mTORC1. Mol Cell. 2012;47:535–546. doi: 10.1016/j.molcel.2012.06.009. [DOI] [PMC free article] [PubMed] [Google Scholar]
- Dibble CC, Manning BD. Signal integration by mTORC1 coordinates nutrient input with biosynthetic output. Nat Cell Biol. 2013;15:555–564. doi: 10.1038/ncb2763. [DOI] [PMC free article] [PubMed] [Google Scholar]
- Efeyan A, Zoncu R, Chang S, Gumper I, Snitkin H, Wolfson RL, Kirak O, Sabatini DD, Sabatini DM. Regulation of mTORC1 by the Rag GTPases is necessary for neonatal autophagy and survival. Nature. 2013;493:679–683. doi: 10.1038/nature11745. [DOI] [PMC free article] [PubMed] [Google Scholar]
- Emmanuel N, Ragunathan S, Shan Q, Wang F, Giannakou A, Huser N, Jin G, Myers J, Abraham RT, Unsal-Kacmaz K. Purine Nucleotide Availability Regulates mTORC1 Activity through the Rheb GTPase. Cell Rep. 2017;19:2665–2680. doi: 10.1016/j.celrep.2017.05.043. [DOI] [PubMed] [Google Scholar]
- Gonzalez A, Hall MN. Nutrient sensing and TOR signaling in yeast and mammals. EMBO J. 2017;36:397–408. doi: 10.15252/embj.201696010. [DOI] [PMC free article] [PubMed] [Google Scholar]
- Gowans GJ, Hawley SA, Ross FA, Hardie DG. AMP is a true physiological regulator of AMP-activated protein kinase by both allosteric activation and enhancing net phosphorylation. Cell Metab. 2013;18:556–566. doi: 10.1016/j.cmet.2013.08.019. [DOI] [PMC free article] [PubMed] [Google Scholar]
- Gwinn DM, Shackelford DB, Egan DF, Mihaylova MM, Mery A, Vasquez DS, Turk BE, Shaw RJ. AMPK phosphorylation of raptor mediates a metabolic checkpoint. Mol Cell. 2008;30:214–226. doi: 10.1016/j.molcel.2008.03.003. [DOI] [PMC free article] [PubMed] [Google Scholar]
- Hara K, Yonezawa K, Weng QP, Kozlowski MT, Belham C, Avruch J. Amino acid sufficiency and mTOR regulate p70 S6 kinase and eIF-4E BP1 through a common effector mechanism. J Biol Chem. 1998;273:14484–14494. doi: 10.1074/jbc.273.23.14484. [DOI] [PubMed] [Google Scholar]
- Hardie DG. AMPK--sensing energy while talking to other signaling pathways. Cell Metab. 2014;20:939–952. doi: 10.1016/j.cmet.2014.09.013. [DOI] [PMC free article] [PubMed] [Google Scholar]
- Hardie DG, Ross FA, Hawley SA. AMPK: a nutrient and energy sensor that maintains energy homeostasis. Nat Rev Mol Cell Biol. 2012;13:251–262. doi: 10.1038/nrm3311. [DOI] [PMC free article] [PubMed] [Google Scholar]
- Iadevaia V, Liu R, Proud CG. mTORC1 signaling controls multiple steps in ribosome biogenesis. Semin Cell Dev Biol. 2014;36:113–120. doi: 10.1016/j.semcdb.2014.08.004. [DOI] [PubMed] [Google Scholar]
- Inoki K, Zhu T, Guan KL. TSC2 mediates cellular energy response to control cell growth and survival. Cell. 2003;115:577–590. doi: 10.1016/s0092-8674(03)00929-2. [DOI] [PubMed] [Google Scholar]
- Kim E, Goraksha-Hicks P, Li L, Neufeld TP, Guan KL. Regulation of TORC1 by Rag GTPases in nutrient response. Nat Cell Biol. 2008;10:935–945. doi: 10.1038/ncb1753. [DOI] [PMC free article] [PubMed] [Google Scholar]
- Kim SG, Hoffman GR, Poulogiannis G, Buel GR, Jang YJ, Lee KW, Kim BY, Erikson RL, Cantley LC, Choo AY, et al. Metabolic stress controls mTORC1 lysosomal localization and dimerization by regulating the TTT-RUVBL1/2 complex. Mol Cell. 2013;49:172–185. doi: 10.1016/j.molcel.2012.10.003. [DOI] [PMC free article] [PubMed] [Google Scholar]
- Lane AN, Fan TW. Regulation of mammalian nucleotide metabolism and biosynthesis. Nucleic Acids Res. 2015;43:2466–2485. doi: 10.1093/nar/gkv047. [DOI] [PMC free article] [PubMed] [Google Scholar]
- Lunt SY, Vander Heiden MG. Aerobic glycolysis: meeting the metabolic requirements of cell proliferation. Annu Rev Cell Dev Biol. 2011;27:441–464. doi: 10.1146/annurev-cellbio-092910-154237. [DOI] [PubMed] [Google Scholar]
- Meng S, Cao J, He Q, Xiong L, Chang E, Radovick S, Wondisford FE, He L. Metformin activates AMP-activated protein kinase by promoting formation of the alphabetagamma heterotrimeric complex. J Biol Chem. 2015;290:3793–3802. doi: 10.1074/jbc.M114.604421. [DOI] [PMC free article] [PubMed] [Google Scholar]
- Menon S, Dibble CC, Talbott G, Hoxhaj G, Valvezan AJ, Takahashi H, Cantley LC, Manning BD. Spatial Control of the TSC Complex Integrates Insulin and Nutrient Regulation of mTORC1 at the Lysosome. Cell. 2014;156:771–785. doi: 10.1016/j.cell.2013.11.049. [DOI] [PMC free article] [PubMed] [Google Scholar]
- Moore PB, Steitz TA. The involvement of RNA in ribosome function. Nature. 2002;418:229–235. doi: 10.1038/418229a. [DOI] [PubMed] [Google Scholar]
- Nagaraj N, Wisniewski JR, Geiger T, Cox J, Kircher M, Kelso J, Paabo S, Mann M. Deep proteome and transcriptome mapping of a human cancer cell line. Mol Syst Biol. 2011;7:548. doi: 10.1038/msb.2011.81. [DOI] [PMC free article] [PubMed] [Google Scholar]
- Psychogios N, Hau DD, Peng J, Guo AC, Mandal R, Bouatra S, Sinelnikov I, Krishnamurthy R, Eisner R, Gautam B, et al. The human serum metabolome. PLoS One. 2011;6:e16957. doi: 10.1371/journal.pone.0016957. [DOI] [PMC free article] [PubMed] [Google Scholar]
- Robitaille AM, Christen S, Shimobayashi M, Cornu M, Fava LL, Moes S, Prescianotto-Baschong C, Sauer U, Jenoe P, Hall MN. Quantitative phosphoproteomics reveal mTORC1 activates de novo pyrimidine synthesis. Science. 2013;339:1320–1323. doi: 10.1126/science.1228771. [DOI] [PubMed] [Google Scholar]
- Sancak Y, Bar-Peled L, Zoncu R, Markhard AL, Nada S, Sabatini DM. Ragulator-Rag complex targets mTORC1 to the lysosomal surface and is necessary for its activation by amino acids. Cell. 2010;141:290–303. doi: 10.1016/j.cell.2010.02.024. [DOI] [PMC free article] [PubMed] [Google Scholar]
- Sancak Y, Peterson TR, Shaul YD, Lindquist RA, Thoreen CC, Bar-Peled L, Sabatini DM. The Rag GTPases bind raptor and mediate amino acid signaling to mTORC1. Science. 2008;320:1496–1501. doi: 10.1126/science.1157535. [DOI] [PMC free article] [PubMed] [Google Scholar]
- Saxton RA, Sabatini DM. mTOR Signaling in Growth, Metabolism, and Disease. Cell. 2017;168:960–976. doi: 10.1016/j.cell.2017.02.004. [DOI] [PMC free article] [PubMed] [Google Scholar]
- Toyama EQ, Herzig S, Courchet J, Lewis TL, Jr, Loson OC, Hellberg K, Young NP, Chen H, Polleux F, Chan DC, et al. Metabolism. AMP-activated protein kinase mediates mitochondrial fission in response to energy stress. Science. 2016;351:275–281. doi: 10.1126/science.aab4138. [DOI] [PMC free article] [PubMed] [Google Scholar]
- Traut TW. Physiological concentrations of purines and pyrimidines. Mol Cell Biochem. 1994;140:1–22. doi: 10.1007/BF00928361. [DOI] [PubMed] [Google Scholar]
- von der Haar T. A quantitative estimation of the global translational activity in logarithmically growing yeast cells. BMC Syst Biol. 2008;2:87. doi: 10.1186/1752-0509-2-87. [DOI] [PMC free article] [PubMed] [Google Scholar]
Associated Data
This section collects any data citations, data availability statements, or supplementary materials included in this article.