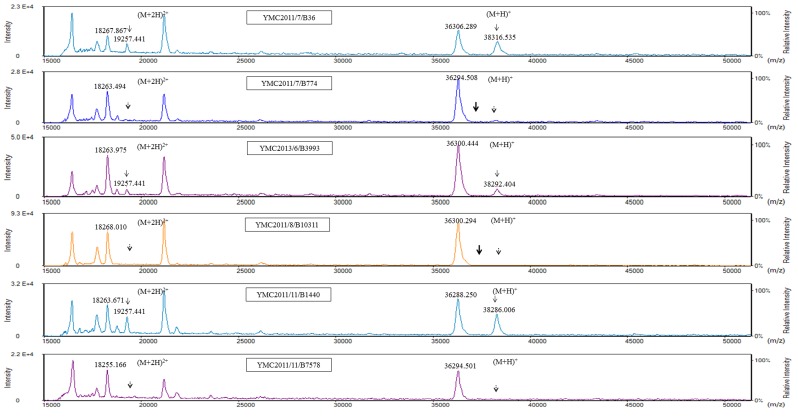
Figure 4. MALDI-TOF MS analysis of panel strains of K. pneumoniae using a Tinkerbell LT mass spectrometer.
The x-axis represents the mass per charge in Daltons (m/z) and the y-axis represents the relative intensity. The 38 kDa peak and its corresponding (M+2H)2+ peak at 19 kDa, indicated by solid black arrows, represent OmpK36. The dotted arrows indicate the loss of OmpK36. The absence of the 37 kDa peak is indicated by the bold arrow in isolates YMC2011/7/B774 and YMC2011/8/B10311. Although these isolates carry the OmpK35 gene, the corresponding peak for the OmpK35 protein was not observed.

