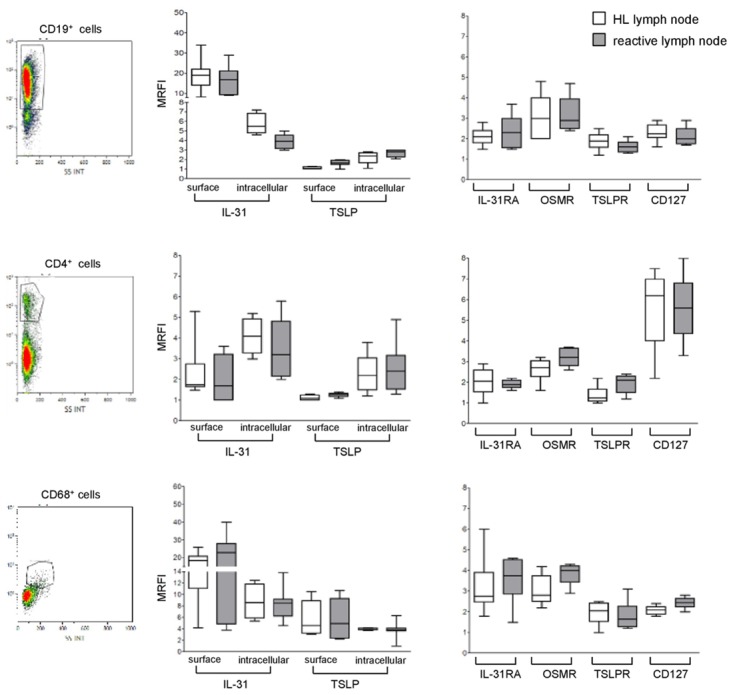
Figure 2. Expression of IL-31, TSLP and their receptors in lymphoid cells populating HL and reactive lymph node microenvironment.

Left panels. A representative gating strategy for B cells (CD19+), T cells (CD4+), and macrophages (CD68+). Middle panels. IL-31/TSLP expression was analyzed by flow cytometry at surface and intracellular levels on CD19+, CD4+, and CD68+ cells for both HL and reactive lymph nodes. Results are shown in box plot as median MRFI, first and third quartiles, maximum and minimum values, from 7 different HL and 7 reactive lymph node cell suspensions. Right panels. IL-31RA/OSMR and TSLPR/CD127 chain receptor expression was analyzed by flow cytometry on CD19+, CD4+ and CD68+ cells for both HL and reactive lymph nodes. Results are shown in box plot as median MRFI, first and third quartiles, maximum and minimum values, from 7 different HL and 7 reactive lymph node cell suspensions.
