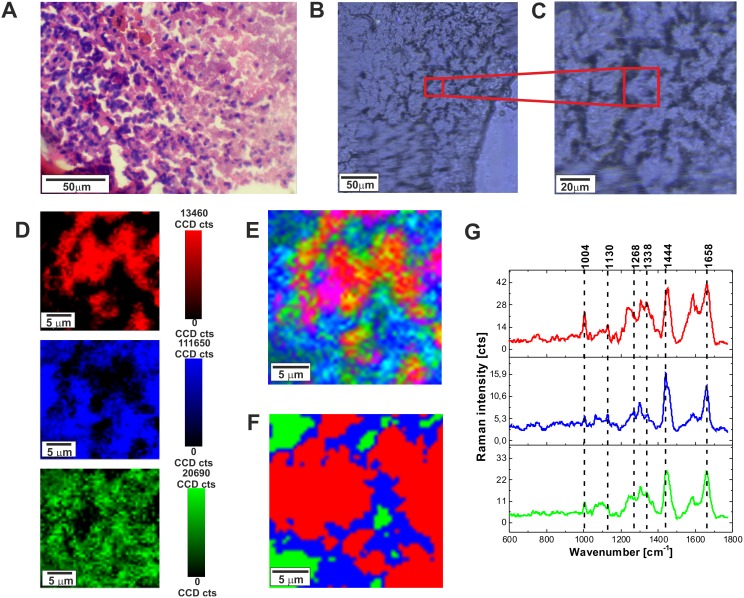
Figure 2.
H&E-stained histological image (A), stitching microscopy image (250 μm x 270 μm) (B), microscopy image (C), distribution of compounds in three spectral ranges (D) Raman images (25 μm x 25 μm) obtained from basis analysis (E) and cluster analysis (F), as well as the characteristic vibrational Raman spectra (G) in the low frequency region of the normal brain tissue from the negative safety margin (right) (P17), integration time for Raman images 1 s, resolution step: 0.5 μm, laser excitation power: 10 mW. The line colors of the spectra correspond to the colors of the Raman maps.

