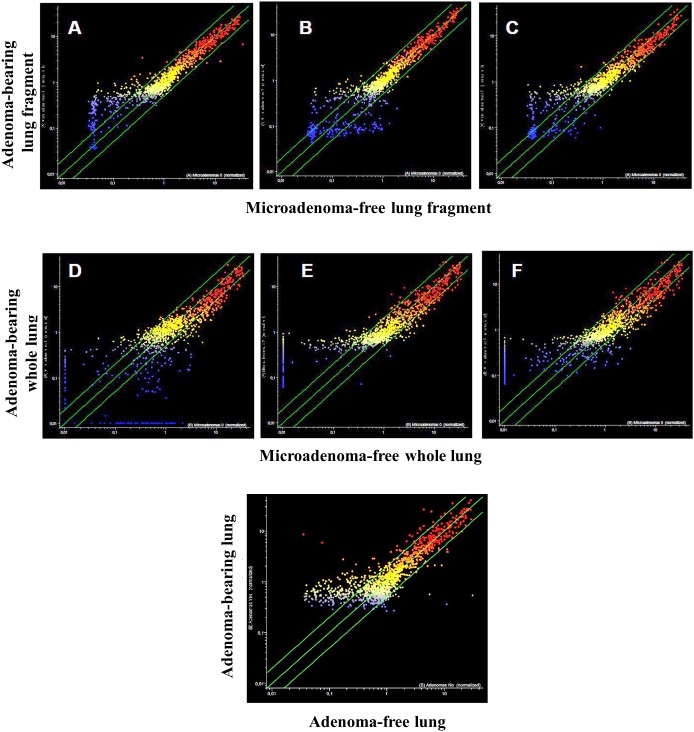
Figure 8. Scatter-plots analyzing the expression of 1135 miRNAs either in the lung fragments used for miRNA analysis (upper panels) or in the whole lungs (middle panels) of 7.5-month old Swiss H mice of both genders exposed to MCS during the first 4 months of life and treated with naproxen after weaning.
miRNAs were compared in mice without microadenomas (x-axis) vs. those containing either 1-10 (A, D), 11-20 (B, E) or >20 microadenomas (C, F) (y-axis). The bottom panel refers to the comparison of miRNA expression in the whole lungs, either adenoma-free (x-axis) or bearing adenomas (y-axis).

