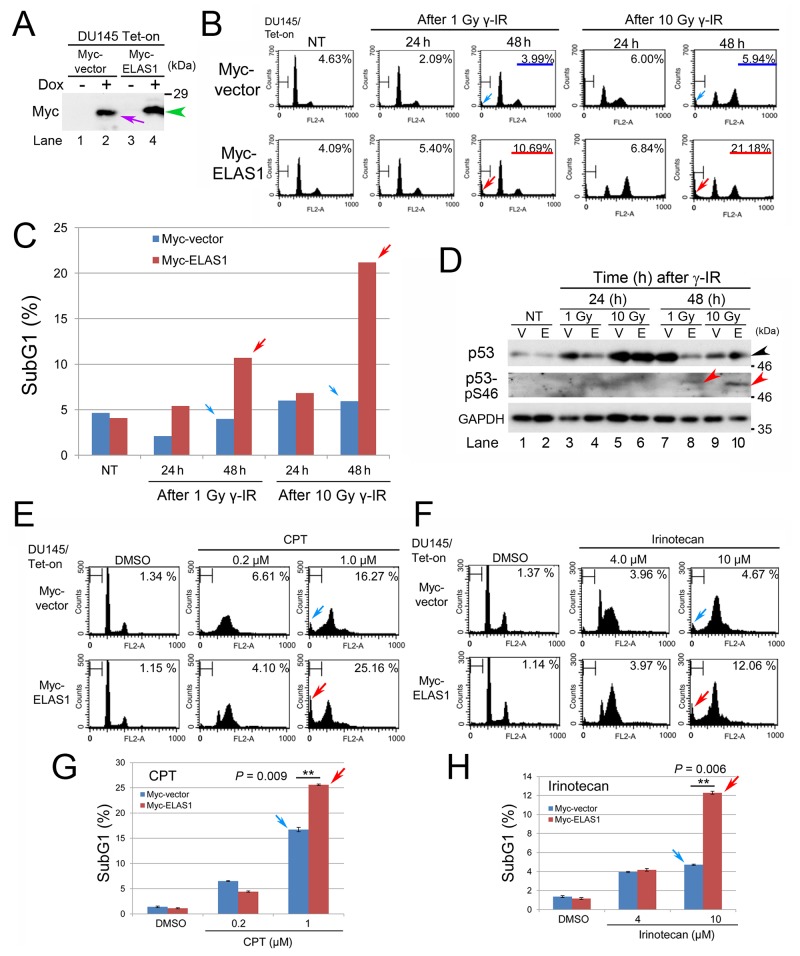
Figure 1. Exogenous expression of ELAS1 causes apoptotic death of DU145 cells after dsDNA insults.
(A) Wb was conducted to show the successful establishment of DU145/Tet-On cells expressing Myc-vector or Myc-ELAS1 in the absence (-) or presence (+) of Dox. The purple arrow and green arrowhead indicate Dox-inducible bands for Myc protein and Myc-ELAS1 protein, respectively. (B) FC analysis. DU145/Tet-On cells stably expressing Myc-vector alone or Myc-ELAS1 were treated with 1 or 10 Gy γ-IR for the indicated duration (h) in the presence of Dox. Cells were stained with propidium iodide (PI) and the cell cycle profiles were determined by FC. The percentages correspond to the sub-G1 population of cells. (C) The bar graphs show the percentages of subG1 cells as determined by FC. DU145/Tet-On cells expressing Myc-vector or Myc-ELAS1 following Dox-mediated induction were treated with 1 or 10 Gy γ-IR, cultured for 24 or 72 h, and subjected to FC. Data represent the means and standard deviations (SD) of three independent experiments. Red and blue arrows correspond to the subG1 peak of FC data shown in Figure 1B. (D) DU145/Tet-On cells expressing Myc-vector (V) or Myc-ELAS1 (E) following Dox-mediated induction were cultured for 24 h and subsequently cultured for the indicated duration (h) in the absence (NT) or presence of 1 or 10 Gy γ-IR treatment. Then, the cell extracts were subjected to Wb with anti-p53, anti-phospho-p53-S46, and anti-GAPDH (loading control) antibodies. The black and red arrowheads indicate the p53 and p53-S46 bands, respectively. (E, F) FC analysis of DU145/Tet-On cells expressing Myc-vector or Myc-ELAS1 following Dox-mediated induction in the presence of CPT (E) or irinotecan (F). SubG1 peaks are indicated by blue and red arrows. (G, H) The bar graphs show the percentages of subG1 cells as determined by FC. Red and blue arrows correspond to the subG1 peaks of FC data shown in Figure 1E and Figure 1F.

