

Abstract
Human induced pluripotent stem cells (iPSCs) can be differentiated into vascular endothelial (iEC) and smooth muscle (iSMC) cells. However, because iECs and iSMCs are not derived from an intact blood vessel, they represent an immature phenotype. Hemodynamics and heterotypic cell:cell communication play important roles in vascular cell phenotypic modulation. Here we tested the hypothesis that hemodynamic exposure of iECs in coculture with iSMCs induces an in vivo‐like phenotype. iECs and iSMCs were cocultured under vascular region‐specific blood flow hemodynamics, and compared to hemodynamic cocultures of blood vessel‐derived endothelial (pEC) and smooth muscle (pSMC) cells. Hemodynamic flow‐induced gene expression positively correlated between pECs and iECs as well as pSMCs and iSMCs. While endothelial nitric oxide synthase 3 protein was lower in iECs than pECs, iECs were functionally mature as seen by acetylated‐low‐density lipoprotein (LDL) uptake. SMC contractile protein markers were also positively correlated between pSMCs and iSMCs. Exposure of iECs and pECs to atheroprone hemodynamics with oxidized‐LDL induced an inflammatory response in both. Dysfunction of the transforming growth factor β (TGFβ) pathway is seen in several vascular diseases, and iECs and iSMCs exhibited a transcriptomic prolife similar to pECs and pSMCs, respectively, in their responses to LY2109761‐mediated transforming growth factor β receptor I/II (TGFβRI/II) inhibition. Although there are differences between ECs and SMCs derived from iPSCs versus blood vessels, hemodynamic coculture restores a high degree of similarity in their responses to pathological stimuli associated with vascular diseases. Thus, iPSC‐derived vascular cells exposed to hemodynamics may provide a viable system for modeling rare vascular diseases and testing new therapeutic approaches. Stem Cells Translational Medicine 2017;6:1673–1683
Keywords: Induced pluripotent stem cells, Endothelial cells, Smooth muscle cells, Hemodynamics, Vascular
Significance Statement.
Human induced pluripotent stem cells (iPSCs) can be differentiated into vascular endothelial and smooth muscle cells. Hemodynamic exposure of these differentiated cells cocultured together restores normal and pathological biological responses. Thus, we demonstrate that iPSC‐derived vascular cells exposed to hemodynamics may provide a viable system for modeling rare vascular diseases and testing new therapeutic approaches.
Introduction
Vascular diseases of genetic origin are often difficult to study in the human tissue given limitations in human sample availability and accurate modeling of the disease of interest. However, recent advances in human stem cell biology are paving the way for availability of new resources to create powerful model systems of human diseases.
Induced pluripotent stem cells (iPSCs) have the potential to differentiate into various adult human cell types and tissues. iPSCs are derived from reprogrammed human somatic cells and exhibit an embryonic stem cell (ESC)‐like phenotype. iPSCs hold great potential as promising tools in developmental biology and regenerative medicine, in particular for applications for reproducible differentiation into human tissues for various human clinical applications 1. Furthermore, iPSC lines produced from patients with genetic diseases offer the ability to investigate specific genetic alterations of interest and their effect in disease onset and progression 2.
Although many studies have demonstrated differentiation of iPSCs into various cell types, the demonstration of the cells’ functional mimicry to their modeled tissue and subsequent disease application remains poor 3. Thus, we sought to characterize the fidelity and functionality of iPSCs differentiated into vascular endothelial (iEC) and smooth muscle (iSMC) cells for vascular tissue modeling and disease characterization. Herein, we assessed human iECs and iSMCs cocultured under vascular region‐specific blood flow hemodynamics to determine if they display similar transcriptomic and functional responses to cocultures of primary human endothelial (pEC) and smooth muscle (pSMC) cells exposed to the same hemodynamics. We have previously demonstrated that this human vascular surrogate system utilizing cocultures of pEC:pSMC exposed to relevant hemodynamics mimics the in vivo endothelial and smooth muscle architecture, biology and physiology of the blood vessel wall, and is highly responsive to changes in hemodynamics, inflammatory milieu, and drug treatments 4, 5, 6. Our results indicate that iPSC‐derived vascular cells exhibit an immature phenotype and that hemodynamic coculture of iEC:iSMC restores a high degree of similarity to that of pEC:pSMC. Application of the hemodynamic coculture model could provide a viable system for modeling rare vascular diseases using patient‐derived iPSCs to develop and test new therapeutic approaches.
Materials and Methods
Cell Isolation and Culture
Primary endothelial cells (pECs) and smooth muscles cells (pSMCs) of human aortic origin were purchased from Lonza, USA, lonza.com, and maintained in EGM‐2 BulletKit (Lonza CC‐3162) and SmGM‐2 BulletKit (Lonza CC‐3182) media, respectively. iPSC‐derived human vascular endothelial cells (iECs; iCell Endothelial Cells) were purchased from Cellular Dynamics International, WI, cellulardynamics.com (ECC‐100–010‐001) and thawed and maintained according to manufacturer's instructions using “iEC Growth Media” (VascuLife VEGF Endothelial Medium from LifeLine Cell Technology, MD, llifelinecelltech.com (LL‐0003) and iCell Endothelial Cells Medium Supplement from Cellular Dynamics (ECM‐100‐030‐001)). iPSC neural crest‐derived human smooth muscle cells (iSMCs) were produced at the University of Cambridge. Human iPSCs were first induced to form neuroectoderm under chemically defined conditions as previously described 7. Cells were then passaged up to 12 times to generate neural crest‐like cells (Serrano et al., manuscript in preparation) and induced to iSMCs using PDGF‐BB and TGFβ1 [7]. iSMCs were then switched to iSMC media (DMEM/F12 with 10% FBS, 2.5 mM glutamine, and 100 U/ml penicillin/streptomycin) which was used for further maintenance and culture.
Transwell Coculture Plating Conditions and Hemodynamic Exposure
The transwell coculture plating and hemodynamic flow device setup is explained in detail in 4 and Figure 1A. In brief, a porous polycarbonate 75‐mm transwell membrane (Corning Inc., NY, corning.com) was coated with 0.1% gelatin on the top and bottom surface of the membrane. Human pSMCs or iSMCs were plated on the bottom transwell surface in their respective maintenance medium. After 2 days, human pECs or iECs were plated on the top transwell surface in flow media (see below) or iEC growth media, respectively, and incubated overnight. Transwells plated with cells were placed in flow media containing reduced serum (M199 supplemented with 2% FBS, 2 mM l‐glutamine, and 100 U/ml penicillin‐streptomycin) for flow experiments.
Figure 1.

Application of iPSC‐derived or primary endothelial cells (ECs) and smooth muscle cells (SMCs) to the human vascular surrogate system. (A): Normal vascular wall shear stress profiles were applied to the human vascular surrogate system using a cone‐and‐plate viscometer incorporated into a transwell coculture model of ECs (green cells) and SMCs (red cells). Rotation of the cone (orange triangle) imparts downward directional shear stress onto the ECs. Media is continually perfused to recapitulate interstitial flow, as indicated by the inflow and outflow ports. (B): Blood velocity profiles were obtained by magnetic resonance imaging from the human CCA and the ICS regions. (C): Representative photomicrographs of iECs and iSMCs exposed to hemodynamics from the common carotid arterial region are shown. Green = phalloidin; blue = TO‐PRO‐3. Scale bar = 100 μm. (D): RNA was collected from pECs and pSMCs as well as iECs and iSMCs cocultured, respectively, in static conditions or exposed to CCA hemodynamics. Transcriptomic data was then plotted along two principal component axes to determine overall similarities and differences between samples. Abbreviations: CCA, common carotid artery; ECA, external carotid artery; ICS, internal carotid sinus; iECs, iPSC‐derived ECs; iSMCs, iPSC‐derived SMCs; pECs, primary ECs; pSMCs, primary SMCs.
The cocultured ECs and SMCs were then exposed to physiologically relevant hemodynamics utilizing a direct drive cone‐and‐plate viscometer described in 4. Briefly, this system contains a base that securely holds the 75‐mm transwell containing cells and a cone that fits into the transwell compartment. Hemodynamic flow was imparted by the rotating cone to the EC layer of the EC‐SMC coculture transwell setup. The velocity waveforms imparted by the cone are generated by a drive system using a microstepper motor (Axis New England, MA, axisne.com) controlled by software that allows programmable specified hemodynamics (Motion Planner, Parker Compumoter). Human hemodynamic shear stress profiles and blood velocity profiles were derived from the human common carotid artery (CCA) and internal carotid sinus (ICS), areas of atheroprotective/healthy regions or areas prone to atherosclerosis (atheroprone; Fig. 1B) and calculated as previously described in 8, 9. In‐flow and out‐flow tubing accessing the inner and outer chambers of the transwell allow for continual perfusion of media to both the EC and SMC layers. Flow media was prepared with dextran to obtain the desired viscosity necessary for transmitting physiological human waveform shear forces from motor/cone assembly to the cells.
Normal and Pathological Hemodynamic Conditions and Drug Treatments
In the first set of experiments, human primary and iPSC‐derived vascular cells were exposed to atheroprotective (CCA) or atheroprone (ICS) hemodynamics or kept in static culture for 48 hours.
In a second set of experiments, after human primary and iPSC‐derived vascular cells were exposed to atheroprone hemodynamics for 18 hours, cells were exposed to native low‐density lipoprotein (nLDL, 50 μg/ml) or oxidized‐LDL (oxLDL, 50 μg/ml) plus human recombinant tumor necrosis factor‐α (TNFα; 0.05 ng/ml; R&D Systems, MN, rndsystems.com, 210‐TA‐010) in the atheroprone condition for an additional 30 hours. The addition of nLDL to atheroprone hemodynamics mimics baseline atheroprone conditions while oxLDL and TNFα in the atheroprone state mimics advanced inflammatory conditions (AIC) in the context of cardiovascular disease. Human nLDL was purchased from Kalen Biomedical, MD, kalenbiomed.com (770200). nLDL was oxidized via the following protocol: nLDL was dialyzed overnight in PBS to remove EDTA. Next, nLDL was dialyzed in PBS containing 13.8 μM CuSO4 for three days to oxidize the LDL. Following completion of oxidation, LDL was dialyzed in PBS containing 50 μM EDTA to remove excess Cu. Electrophoretic migration of oxLDL versus nLDL provides a measure of the oxidative state of LDL.
In the final set of experiments, cells exposed to baseline atheroprone hemodynamics were treated with vehicle control (dimethyl sulfoxide [DMSO]) or the TGFβ inhibitor, LY2109761, at the 24‐hour time point for an additional 24 hours. LY2109761 was prepared in DMSO and diluted 1:1,000 in the experiment to achieve a final experimental concentration of 15μM.
RNA Preparation and RNA Deep Sequencing
EC and SMC cell pellets were collected and RNA isolated using the Invitrogen Purelink RNA Mini kit (12183018A) according to manufacturer's instructions (CA, thermofisher.com). RNA concentration was determined with the Nanodrop and RNA integrity was determined using the Agilent 2100 Bioanalyzer and the Agilent RNA 6000 kit (5067‐1511) according to manufacturer's instructions (CA, agilent.com). Samples with a minimum RNA Integrity Number 7.0 were used for further transcriptomics processing. 250 ng RNA per sample was submitted to Expression Analysis, Inc., A Quintiles Company, NC, q2labsolutions.com, for Illumina‐based RNA deep sequencing. Approximately 20 million 50 base paired‐end reads were generated per sample. For each treatment, the following samples were processed for RNA Seq: n = 3 for iEC and iSMC samples (all same donor) and n = 4 for pEC and pSMC samples (each different donor).
Data Analysis and Statistics
Following RNA deep sequencing, reads were aligned to a standard hg19 human transcriptome. Alignment was done using Bowtie 0.12.9 with the final gene counts calculated using eXpress v1.5.1 10, 11. Three RNA deep sequencing quality control measurements were performed to detect outliers and batch effects associated with the data set: (a) false color heatmaps of distance between samples, (b) principal component analyses, and (c) overlapping density estimates. After evaluating these quality control outputs, outliers were excluded and batch effects, which consisted of donor variability, removed.
The RNA deep sequencing data set counts was then analyzed to determine differentially expressed genes (DEGs). Methods for DEG determination were implemented using the open source R/BioConductor software (http://www.bioconductor.org) and the edgeR package 12, with only genes that passed our threshold (more than 2 counts per million in at least 3 human samples, the minimum number of biological replicates) being used for further analysis. A gene was determined to be a DEG by passing an FDR threshold of 10% (using the Benjamini and Hochberg FDR correction 13). Select genes of relevant biological processes were chosen to build response heatmaps that depict changes in gene expression based on a log2fold scale of −2 to 2: blue = downregulation, red = upregulation, white = no change; the intensity of the color reflects the magnitude of change; a white dot indicates a statistically significant change in the expression of the corresponding gene (FDR < 10%). Limma‐calculated fold‐changes (log base 2 transformed), raw null hypothesis testing p values, and Benjamini‐Hochberg adjusted false discovery rates (FDR) were used as input for downstream pathway analyses with ingenuity pathway analysis (IPA), signaling pathway impact analysis (SPIA), top gene ontology (topGO), and gene set enrichment analysis (GSEA) pathway enrichment algorithms, which included known pathway gene lists from KEGG, Reactome, Biocarta, and Gene Ontology databases 14, 15, 16, 17, 18, 19, 20, 21. Pathways found enriched for responses with a FDR significance of 20% or better are kept for consideration; redundant pathway enrichments are identified and merged based on strongly connected pathway‐to‐pathway gene overlaps, using the Louvain method55 for graph‐based community clustering 22.
When comparing two conditions with each other, we calculated the response similarity index (RSI). The RSI was calculated for each gene and determines the degree to which the two conditions alter gene expression in the same (RSI > 0.5, purple dots) or opposite (RSI < −0.5, green dots) manner. If two conditions stimulate identical responses, all the data would fall on the identity line of a gene‐by‐gene scatterplot.
As described in 23, a global protein–protein interaction (PPI) network, derived from publicly available high‐confidence interactions defined by the STRING database was used for overlaying our transcriptomic data 24. The goal of the protein‐gene network is to identify centers of dysregulation in response to drug treatment. Connections between nodes were determined by evidence of functional protein‐protein interactions (as defined by STRING). Edges were weighted by the probability that their incident nodes were differentially expressed. Connections with low weight were filtered, substantially reducing the number of proteins in the network; the resulting network of interactions reflects the strongest evidence of regulation. The size of any given node is proportional to its weighted connectivity and the weighted connectivity of its neighbors, thus, node size is an indicator of the relative importance of each node. Protein communities, comprised of more densely connected nodes, likely represent coordinated biological activities that contribute to similar signaling pathways.
Confocal Microscopy
ECs and SMCs plated on transwells and exposed to hemodynamics were fixed in 4% paraformaldehyde for 10 minutes, permeabilized in 0.2% triton X‐100 in PBS for 5 minutes, and incubated with primary antibody for 2 hours at room temperature. After three washes in PBS, they were incubated with secondary antibodies for 1 hour at room temperature. Anti‐human primary antibodies against eNOS (BD Biosciences, CA, bdbiosciences.com, 610297), calponin 1 (Sigma C2887), smooth muscle alpha actin (Sigma, USA, sigmaaldrich.com, C6198), and SM22 (Abcam, MA, abcam.com, ab14106) were used. Goat anti‐mouse or goat anti‐rabbit conjugated to Alexa Fluor 488 or 546 (Life Technologies, CA, thermofisher.com: A11001, A11003, A11008, A11010) were used as secondary antibodies. Actin was stained with Alexa 488‐phalloidin (Life technologies, A12379). Nuclei were stained with TO‐PRO‐3 (Life Technologies T3605) or DRAQ 5 (Cell Signaling Technology, MA, cellsignal.com, 4084L). ECs were also stained with the lectin, Ulex europeaus agglutinin (UEA‐1; Vector Lab, CA, vectorlabs.com, FL‐1061). Uptake of acetylated‐LDL (AcLDL) was performed by incubating ECs in 10 μg/ml fluorescent Dil‐acetylated‐LDL (Kalen 770231–9) for 4 hours at 37°C and subsequently fixed as described above. Fluorescence images of immunofluorescent‐labeled cells were acquired with a Nikon 20X, 0.5 numerical aperture objective lens on a Nikon C1 confocal microscope with EZ‐C1 v3.9 software.
Results
Phenotypic Characterization of iEC:iSMC Coculture in Healthy Hemodynamics
The human vascular surrogate system applies human‐derived blood shear stress patterns to a transwell vascular coculture of endothelial and smooth muscle cells (Fig. 1A). Applied blood velocity profiles were previously obtained by magnetic resonance imaging from the human CCA and the ICS regions, where it is clear that the latter profile exhibits a lower time‐averaged shear stress and reduced magnitude of pulsatility (Fig. 1B) 8. These measurements correlate with vascular regions that exhibit atheroprotective and atheroprone phenotypes, respectively 9. Atherosclerotic lesions develop primarily at these atheroprone regions of disturbed blood flow characterized by low time‐averaged and oscillatory wall shear stress, often in bifurcated areas or regions of high curvature 25. The wall shear stress profiles are then applied to the human vascular system by way of a cone‐and‐plate viscometer that is incorporated into the endothelial and smooth muscle cell transwell coculture setup (Fig. 1A) 4, 5. Cocultures of vascular endothelial (iEC) and smooth muscle (iSMC) cells differentiated from human iPSCs (see Materials and Methods for cell derivation) were compared to cocultures of primary human endothelial (pEC) and smooth muscle cells (pSMC) in this human vascular surrogate system 4, 5. We have shown previously that pECs align with atheroprotective (CCA) flow direction and pSMCs align perpendicularly to this flow, similar to that observed in in vivo vessel organization 4. iECs and iSMCs retained this phenotypic alignment to atheroprotective (CCA) hemodynamics (Fig. 1C).
Following a 48‐hour exposure to CCA hemodynamics or static conditions, cells were collected for RNA sequencing analysis of global transcriptomics. Principal component analysis revealed a clear separation of EC and SMC transcriptomic signal, as expected (Fig. 1D). Interestingly, iECs separated from pECs and iSMCs separated from pSMCs, indicating that global gene expression in iPSC‐derived vascular cells differ from primary vascular cells (Fig. 1D). Within each cell type, cells in hemodynamic coculture clustered together. However, the impact of the cell type was greater than the impact of applied hemodynamics (Fig. 1D).
More detailed analysis of similarities in gene expression fold‐change and directionality was performed for ECs and SMCs of primary and iPSC origin. First, a scatterplot representation of DEGs in endothelial cells comparing pECs to iECs in hemodynamic coculture with pSMCs or iSMCs, respectively, is depicted (Fig. 2A). Each point represents a log2fold‐change of a DEG for each cell type in hemodynamic versus static control cocultures. A DEG with the same directionality in fold‐change for both cell types is represented in purple, while a DEG exhibiting opposite directionality is represented in green. The color intensity increases with statistical significance. The RSI value is a single numerical value that incorporates the fold‐change and significance for each DEG in both cell types. Most of the EC DEGs changed in the same direction (RSI > 0); the ratio of DEGS with an RSI > 0 (syn DEGs with similar response) to DEGs with an RSI < 0 (anti DEGs with opposing response) was 5:1 (Fig. 2A, Supporting Information Fig. 1). To further investigate biological pathways associated with DEGs regulated in hemodynamic‐ or static‐cocultured pECs and iECs, a pathway‐weighting approach was applied and several biological themes emerged from the RSI analysis (see Materials and Methods). Similarly‐regulated biological themes include extracellular matrix (ECM) organization and cell migration signaling, while oppositely regulated biological themes include apoptosis signaling and calcium homeostasis (Fig. 2B).
Figure 2.
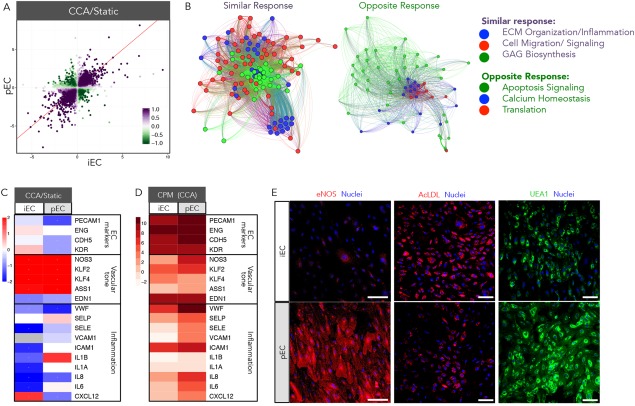
Phenotypic characterization of iECs and pECs in hemodynamic cocultures. iECs and pECs were cocultured with iSMCs and pSMCs, respectively, and exposed to CCA hemodynamics or static conditions. (A): Scatterplot representation of DEGs in pECs and iECs. Each point represents DEG log2fold‐change for each cell type in hemodynamic coculture versus cell‐type‐matched static control coculture. A purple DEG exhibits the same directionality in fold‐change for both cell types, while a green DEG exhibits opposite directionality; color intensity increases with statistical significance. The response similarity index (RSI) value is a single numerical value that incorporates the fold‐change and significance for each DEG in both cell types. (B): A pathway‐weighting approach identified several biological themes that emerged from the RSI analysis. DEGs with similar and opposite responses are weighted to determine membership of each DEG into predominant biological themes that are color‐coded (green, blue, or red); corresponding color‐coded DEGs are grouped to show membership to that theme. (C): Gene expression for pECs and iECs of key endothelial and inflammatory markers are represented as log2fold‐change of CCA hemodynamics versus static (red = upregulation, blue = downregulation). (D): Transcriptomic data for pECs and iECs exposed to CCA hemodynamics of key endothelial and inflammatory markers are represented as total CPM for each gene. (E): Representative photomicrographs of iECs and pECs exposed to CCA hemodynamics: eNOS (red—left panels), acetylated‐LDL (AcLDL; red—mid panels), Ulex europeaus agglutinin (UEA1; green—right panels), and TO‐PRO‐3 for nuclei (blue—all panels). Scale bar = 100 μm. Abbreviations: AcLDL, acetylated‐low‐density lipoprotein; CCA, common carotid artery; CPM, counts per million; DEGs, differentially expressed genes; ECM, extracellular matrix; eNOS, endothelial nitric oxide synthase 3; iECs, iPSC‐derived ECs; pECs, primary ECs; UEA1, Ulex europeaus agglutinin.
We further characterized hemodynamic effects known to be imparted on human vascular endothelial cells. A panel of endothelial cell shear stress response genes was assessed in the presence or absence of hemodynamic flow. Established endothelial cell markers, such as platelet/endothelial cell adhesion molecule 1 (PECAM1), endoglin (ENG), vascular endothelial cadherin (CDH5), and kinase insert domain receptor (KDR) 26, 27, 28, 29, remained unchanged in iECs but were downregulated in pEC hemodynamic compared to static cocultures (Fig. 2C). Genes important in promoting vascular endothelial tone, such as endothelial nitric oxide synthase 3 (eNOS encoded by NOS3), kruppel‐like factor 2 (KLF2), kruppel‐like factor 4 (KLF4), and argininosuccinate synthase 1 (ASS1), were upregulated by hemodynamics in both iECs and pECs (Fig. 2C). eNOS generates nitric oxide (NO), which is a potent vasodilator with strong inhibitory effects of platelet and monocyte activation and sustains vascular health by promoting anti‐thrombotic and anti‐inflammatory effects. The KLF2 and KLF4 transcription factors can positively regulate eNOS expression 30, 31. Notably the vasoconstrictor, endothelin 1 (EDN1), was downregulated in both cell types by hemodynamics (Fig. 2C). However, levels of gene expression markers for vascular tone were lower in iECs (Fig. 2D), which may impact vascular health and intercellular EC and SMC communication 32, 33, 34. This transcriptomic data was corroborated by real‐time polymerase chain reaction (RT‐PCR) of select EC genes, such as NOS3 and KLF2 (Supporting Information Fig. 2A). Finally, inflammatory genes were downregulated in iECs by hemodynamics, which also had lower baseline of expression than primary cells (Fig. 2C, 2D) 35.
Consistent with gene expression, eNOS protein levels were lower in iECs than pECs by immunofluorescence imaging (Fig. 2E). Functional endothelial cells are characterized by their ability to scavenge acetylated‐low‐density lipoprotein (AcLDL) and bind the lectin, Ulex europaeus agglutinin‐1 (UEA‐1) 36, 37. Both iECs and pECs exposed to hemodynamics exhibited similar uptake of AcLDL, while greater UEA‐1 binding occurred in pECs (Fig. 2E). Overall, analysis of shear stress activation of endothelial gene markers exhibited similar, but not identical, responses in iECs and pECs.
As above, we performed similar assessments of DEGs comparing pSMCs to iSMCs in hemodynamic versus static cocultured with pECs or iECs. RSI analysis revealed that most of the SMC DEGs changed in the same direction (RSI > 0); the ratio of syn:anti DEGs was 5:1 (Fig. 3A, Supporting Information Fig. 1). Furthermore, several biological themes emerged from the RSI analysis. Similarly‐regulated biological themes include inflammation and hypoxia signaling (via HIF1α), while oppositely regulated themes include SMC contraction and ECM (Fig. 3A).
Figure 3.

Phenotypic characterization of iSMCs and pSMCs in hemodynamic cocultures. iECs and pECs were cocultured with iSMCs and pSMCs, respectively, and exposed to CCA hemodynamics or static conditions. (A): Scatterplot representation of differentially expressed genes (DEGs) in pSMCs and iSMCs. Each point represents log2fold‐change of a DEG for each cell type in hemodynamic coculture versus cell‐type‐matched static control coculture. A purple DEG exhibits the same directionality in fold‐change for both cell types, while a green DEG exhibits opposite directionality; color intensity increases with statistical significance. The response similarity index (RSI) value is a single numerical value that incorporates the fold‐change and significance for each DEG in both cell types. A pathway‐weighting approach also identified several biological themes that emerged from the RSI analysis. (B): Gene expression for pSMCs and iSMCs of contractile SMC markers are represented as log2fold‐change of CCA hemodynamics versus static (red = upregulation, blue = downregulation). (C): Transcriptomic data for pSMCs and iSMCs exposed to CCA hemodynamics of contractile SMC markers are also represented as total CPM for each gene. (D): Representative photomicrographs of iSMCs and pSMCs exposed to CCA hemodynamics and stained with F‐actin (green—left panels), smooth muscle alpha actin (SMAA; red—left panels), calponin (green – mid panels), transgelin (SM22; red—left panels), and TO‐PRO‐3 for nuclei (blue—all panels). Scale bar = 100 μm. Abbreviations: CCA, common carotid artery; CPM, counts per million; iSMCs, iPSC‐derived SMCs; pSMCs, primary SMCs; SMAA, smooth muscle alpha actin.
The quiescent, contractile phenotype of SMCs is characteristic of a healthy vascular wall and exhibits expression of key SMC‐specific markers 38, 39. Hemodynamic coculture exhibited significant upregulation of SMC markers only in pSMCs (Fig. 3B), a result confirmed by RT‐PCR of the SMC marker, ACTA2 (Supporting Information Fig. 2A). This differing response confirms the oppositely regulated biological pathway detected for SMC contraction (Fig. 3A). This lack of response to hemodynamics may be a consequence of low iEC expression of key flow‐regulated molecules, such as eNOS, which is important for EC‐SMC communication (Fig. 2C, 2D) 34. Nevertheless, the iSMCs overall expressed similar levels of SMC contractile markers as pSMCs, suggesting the iSMCs are phenotypically mature (Fig. 3C, Supporting Information Fig. 2A). Interestingly, iSMCs express greater levels of the myocardin (MYOCD) gene than pSMCs; MYOCD is a master regulator of the SMC contractile phenotype as it drives expression of many key SMC contractile markers 40. Furthermore, iSMCs exhibit upregulation and increased levels of myosin heavy chain 11 (MYH11), a highly specific marker of the SMC contractile phenotype and late stage SMC differentiation 38. Immunofluorescence imaging of SMC contractile markers, calponin and transgelin (SM22), provided confirmation of protein expression of key SMC markers and overall similarity in expression levels between iSMCs and pSMCs (Fig. 3D).
Phenotypic Characterization of iEC:iSMC Coculture in Disease‐Promoting Hemodynamics
We have previously demonstrated that exposure of atheroprone hemodynamics to the endothelium of our EC:SMC coculture leads to cellular phenotypic modulation, promoting reduced EC and SMC differentiation and an inflamed endothelium 4, 6. We compared cocultures of iEC:iSMC to pEC:pSMC to determine if cells of iPSC origin maintain this atheroprone‐mediated response. Focusing on the endothelium response of atheroprone (ICS) compared to atheroprotective (CCA), RSI analysis revealed that most of the iEC and pEC DEGs changed in the same direction (RSI > 0); the ratio of syn:anti DEGs was 8:1 (Fig. 4A, Supporting Information Fig. 1). Analysis of these DEGs revealed similarly‐regulated pathways, such as inflammation, while oppositely‐regulated pathways include endothelial development (Fig. 4A).
Figure 4.
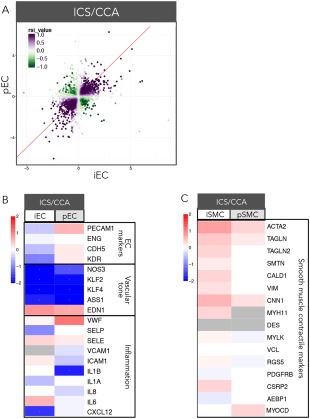
Phenotypic characterization of iPSC‐derived and primary ECs and SMCs in cocultures exposed to atheroprone hemodynamics. iECs and pECs were cocultured with iSMCs and pSMCs, respectively, and exposed to atheroprone (ICS) or atheroprotective (CCA) hemodynamics. (A): Scatterplot representation of differentially expressed genes (DEGs) in pECs and iECs. Each point represents log2fold‐change of a DEG for each cell type in CCA versus ICS hemodynamic coculture. A purple DEG exhibits the same directionality in fold‐change for both cell types, while a green DEG exhibits opposite directionality; color intensity increases with statistical significance. The RSI value is a single numerical value that incorporates the fold‐change and significance for each DEG in both cell types. A pathway‐weighting approach also identified several biological themes that emerged from the RSI analysis. (B): Gene expression for pECs and iECs of key endothelial and inflammatory markers are represented as log2fold‐change of CCA versus ICS hemodynamics (red = upregulation, blue = downregulation). (C): Gene expression for pSMCs and iSMCs of contractile SMC markers are represented as log2fold‐change of CCA versus ICS hemodynamics (red = upregulation, blue = downregulation). Abbreviations: CCA, common carotid artery; iECs, iPSC‐derived ECs; ICS, internal carotid sinus; iSMCs, iPSC‐derived SMCs; pSMCs, primary SMCs; pECs, primary ECs; RSI, response similarity index.
Consistent with previous observations in pECs, iECs exhibited a reduced expression of vascular tone‐specific endothelial markers, such as NOS3, KLF2, ASS1, and increased expression of EDN1 (Fig. 4B). This transcriptomic data was corroborated by RT‐PCR of select EC genes, such as NOS3 and KLF2 (Supporting Information Fig. 2A). However, other key endothelial markers, such as PECAM1, CDH5, and KDR were only decreased in iECs (Fig. 4B). Furthermore, iSMCs, but not pSMCs, exhibited a trend for enhanced expression of SMC contractile markers (e.g., smooth muscle alpha actin 2 (ACTA2), transgelin (TAGLN), TAGLN2, caldesmon 1 (CALD1), calponin 1 (CNN1), MYH11, cysteine and glycine‐rich protein 2 (CSRP2)) when exposed to atheroprone hemodynamics (Fig. 4C, Supporting Information Fig. 2A).
Modeling Advanced‐Inflammatory Conditions in the iEC:iSMC Hemodynamic Coculture
Exposure of the endothelium to atheroprone hemodynamics promotes inflammation, monocyte transmigration and differentiation, and ensuing atherosclerosis 26, 41. Key components of this inflammatory milieu that predispose this region to develop atherosclerosis include oxLDL and TNFα. We have previously shown that addition of oxLDL and TNFα to pEC:pEMC cocultures exposed to atheroprone hemodynamics mimics the AIC of atherogenesis 6. We exposed iEC:iSMC cocultures to AIC (ICS hemodynamics plus oxLDL and TNFα) to determine if vascular cells of iPSC origin respond similarly to primary cells. RSI analysis of pEC versus iEC and pSMC verus pSMC cocultures in AIC compared to baseline atheroprone (ICS hemodynamics plus native LDL [nLDL]) revealed very similar DEG responses that fell within inflammation‐specific biological pathways (Fig. 5A, 5B; syn:anti DEGs ratio was 15:1 for ECs and 14:1 for SMCs, Supporting Information Fig. 1). We further characterized specific gene responses that make up the Cytokine‐Cytokine Receptor Interaction KEGG pathway to assess induction of inflammation (Fig. 5C). We observed that all cell types exhibited an overall induction of these genes in this panel (Fig. 5C). While the overall response is highly similar, the magnitude of response differed. pECs exhibited a greater pro‐inflammatory response than iECs, while iSMCs exhibited a greater pro‐inflammatory response than pSMCs (Fig. 5C). This transcriptomic data for inflammation was corroborated in ECs and SMCs by RT‐PCR of select pro‐inflammatory genes, such as IL8 and CCL2 (Supporting Information Fig. 2B). Oxidative stress is an important determinant in the initiation and progression of atherosclerosis 42. Thus, analysis of the gene response for the NRF2‐Mediated Oxidative Stress IPA pathway revealed that most genes in this pathway are upregulated in response to AIC and are regulated quite similarly in all cell types (Fig. 5D).
Figure 5.

Modeling AIC in iEC:iSMC hemodynamic cocultures. iECs and pECs were cocultured with iSMCs and pSMCs, respectively, and exposed to atheroprone (ICS) hemodynamics in the presence of 50 μg/ml human‐derived oxLDL + 0.05 ng/ml TNFα to mimic AIC or in the presence of 50 μg/ml human‐derived nLDL to mimic baseline atheroprone conditions. (A, B): Scatterplot representation of differentially expressed genes (DEGs) in pECs and iECs or pSMCs and iSMCs. Each point represents log2fold‐change of a DEG for each cell type in AIC versus baseline atheroprone hemodynamic coculture. A purple DEG exhibits the same directionality in fold‐change for both cell types, while a green DEG exhibits opposite directionality; color intensity increases with statistical significance. The response similarity index (RSI) value is a single numerical value that incorporates the fold‐change and significance for each DEG in both cell types. A pathway‐weighting approach also identified several biological themes that emerged from the RSI analysis. (C): Heatmap representing the expression profile of genes for the Cytokine‐Cytokine Receptor Interaction KEGG pathway is represented for ECs and SMCs as log2fold‐change of AIC versus baseline atheroprone (red = upregulation, blue = downregulation). (D): Heatmap representing the expression profile of genes for the NRF2‐Mediated Oxidative Stress IPA pathway is represented for ECs and SMCs as log2fold‐change of AIC versus baseline atheroprone (red = upregulation, blue = downregulation). Abbreviations: AIC, advanced inflammatory conditions; iECs, iPSC‐derived ECs; iSMCs, iPSC‐derived SMCs; pECs, primary ECs; pSMCs, primary SMCs; TNFα, tumor necrosis factor‐α.
Modeling Dysregulation of the TGFβ Pathway in iEC:iSMC Hemodynamic Coculture
iPSCs represent a way to test genetic variants in a more physiological system. One such biology relates to the TGFβ pathway, which is involved in many diseases such as cancer, heart disease, Marfan syndrome, Loeys‐Deitz syndrome, and others 43. Thus we wanted to test the robustness of iEC:iSMC cocultures to respond similarly to pEC:pSMC cocultures in the context of a disease state. iEC:iSMC and pEC:pSMC cocultures exposed to baseline atheroprone hemodynamics (ICS hemodynamics plus nLDL) were treated with either vehicle control or the TGFβ inhibitor, LY2109761, at 15 μM. pEC versus iEC and pSMC versus pSMC were highly similar in their response, with few opposing changes in gene expression (Fig. 6A, 6B; syn:anti DEGs ratio was 11:1 for both ECs and SMCs, Supporting Information Fig. 1). Furthermore, protein‐protein interaction networks determined from gene overlay expression data revealed several large hubs of biological communities in the SMCs (Fig. 6C; see Materials and Methods). These communities include biological pathways for TGFβ signaling, ECM remodeling, and inflammation, indicating that the TGFβ inhibitor, LY2109761, achieved on‐target effects (Fig. 6C). Gene expression analysis of the TGFβ Signaling Reactome/NCI pathway revealed an overall suppression of genes of this pathway in all cell types by LY2109761 (Fig. 6D). Specifically, LY2109761 inhibited both TGFβR1‐(ACVRL1/ALK1 and TGFBR1/ALK5) and TGFβRII‐mediated signaling pathways in all cell types as evidenced by downregulation of most genes in this signaling cascade (Fig. 6E) 44. This transcriptomic data for TGFβ signaling was corroborated in SMCs and ECs by RT‐PCR of select pro‐inflammatory genes, such as FN1 and COL1A1 (Supporting Information Fig. 2C).
Figure 6.
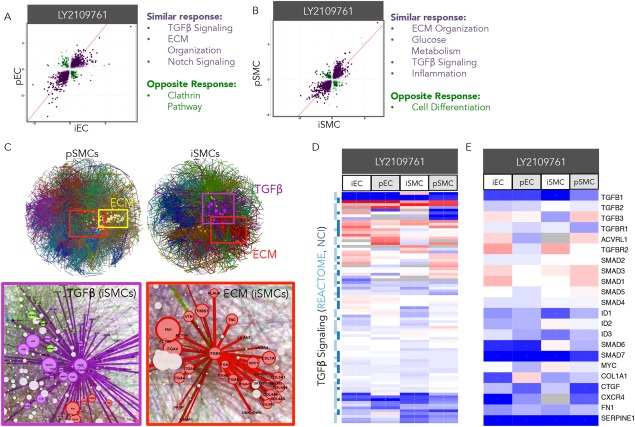
Modeling dysregulation of the TGFβ pathway in iEC:iSMC hemodynamic cocultures. iECs and pECs were cocultured with iSMCs and pSMCs, respectively, and exposed to atheroprone (ICS) hemodynamics in the presence of 50 μg/ml human‐derived nLDL and treated with vehicle control (DMSO) or the TGFβ inhibitor, LY2109761, at 15 μM. (A, B): Scatterplot representation of differentially expressed genes (DEGs) in pECs and iECs or pSMCs and iSMCs. Each point represents log2fold‐change of a DEG for each cell type in LY2109761 versus baseline atheroprone hemodynamic coculture. A purple DEG exhibits the same directionality in fold‐change for both cell types, while a green DEG exhibits opposite directionality; color intensity increases with statistical significance. The response similarity index (RSI) value is a single numerical value that incorporates the fold‐change and significance for each DEG in both cell types. A pathway‐weighting approach also identified several biological themes that emerged from the RSI analysis. (C): Gene expression data for pSMCs and iSMCS was overlayed onto protein‐protein interaction networks to reveal hubs of potentially regulated biological communities. Specific communities relevant to TGFβ signaling, including ECM organization, are highlighted by boxes. These communities for iSMCs are magnified to reveal inclusion of specific DEGs. (D, E): Heatmaps representing the expression profile of all genes for the TGFβ Signaling Reactome/NCI pathway (D) and select genes of this pathway (E) are represented for ECs and SMCs as log2fold‐change of LY2109761 versus baseline atheroprone (red = upregulation, blue = downregulation). Abbreviations: ECM, extracellular matrix; iECs, iPSC‐derived ECs; iSMCs, iPSC‐derived SMCs; pECs, primary ECs; pSMCs, primary SMCs.
Discussion
While many studies demonstrate the utility of iECs and iSMCs for vascular applications 45, 46, 47, 48, 49, 50, 51, 52, 53, 54, 55, 56, 57, 58, no studies to date provide a direct comparison of primary to iPSC‐derived ECs and SMCs nor do they recapitulate the in vivo cellular architecture and environment of the vascular tissue characteristic of heterotypic cell‐cell interactions. The only study to date that evaluates iEC phenotypic response to flow does so without direct comparison to its primary cell counterpart 45. Herein, we demonstrate that exposure of iEC:iSMC cocultures in a human vascular surrogate system recapitulates many aspects of the phenotypic response observed in pEC:pSMC hemodynamic cocultures. iECs maintained endothelial‐specific functional responses, such as AcLDL uptake and UEA‐1 binding, while iSMCs exhibited expression of key SMC contractile markers. Even more so, these iEC:iSMC hemodynamic cocultures respond very strongly and similarly to primary cells in this system when exposed to AIC and drug treatments. Thus, while iEC:iSMC hemodynamic cocultures exhibit some differences in response to normal physiological hemodynamics, these cells respond very well to pathological stimuli and thus may be used to model atherosclerosis or other diseases where no primary cells exist or are challenging to resource, such as Marfan syndrome or GACI (generalized arterial calcification in infants) 59, 60.
As mentioned, some differences in phenotypic responses were observed between iPSCs and the corresponding primary cells when cocultured and exposed to normal physiological hemodynamics. Baseline differences in EC and SMC marker expression may account for phenotypic responses by atheroprotective flow. While EC markers decreased with flow in pECs and SMC markers increased with flow in pSMCs with minimal changes in the iPSC‐derived cells (Figs. 2 and 3), the total expression counts for these genes in both the primary and iPSC‐derived cells were similar. Furthermore, baseline expression of inflammatory genes in iECs was lower than in pECs exposed to flow (Fig. 2C, 2D). Since primary cells exhibit a greater modulation of gene expression upon hemodynamic exposure to restore their normal differentiated phenotype, it can only be speculated that primary cells passaged in static culture exhibit greater loss of its regional phenotype compared to using iPSC‐derived cells.
To account for differences in primary versus iPSC‐derived cells, anti‐gene responses and their associated biological pathways were assessed and revealed key differences in an unbiased manner. For example, apoptosis signaling and calcium homeostasis pathways exhibit opposing signaling in pECs and iECs (Fig. 2B). An increase in apoptosis in pECs or iECs warrants attention as this may indicate a higher degree of unwanted cell stress. Furthermore, calcium signaling is important for various endothelial cell functions, such as NO signaling 33. Indeed, we observed that iECs exhibit lower levels of the NO‐producing gene, NOS3, and its protein, eNOS (Fig. 2), which could account for differences in calcium signaling and intercellular communication between ECs and SMCs 32, 33, 34. In fact, loss of NO signaling can increase calcium signaling in SMCs and promote loss of the contractile SMC phenotype. Indeed, intracellular calcium signaling is a critical mediator of SMC phenotypic modulation 61, 62. Thus, low eNOS levels in iECs may account for lack of induction of SMC marker expression by atheroprotective flow in iSMCs.
Baseline epigenetic variation in iPSC‐derived versus primary cells may be attributable to embryological origin of the primary cells. It has been suggested that embryonic lineage of SMCs may affect disease onset and progression 39, 63. In this study, we utilized primary vascular cells of aortic origin, a region that is highly susceptible to atherosclerosis and aortic aneurysms 64. Thus, primary cells of this origin may be predisposed to a disease‐like phenotype. The use of iPSC‐derived vascular cells may circumvent this problem by emulating a virgin vascular cell that has not been preconditioned to external pathological stimuli.
We also demonstrated that iPSC‐derived ECs and SMCs can be used to model diseases and responses to drug treatments. Marfan syndrome is a rare autosomal dominant disorder caused by mutations in fibrillin‐1 (FBN1), resulting in pleiotropic manifestations including connective tissue remodeling and the development of aortic aneurysms. The molecular basis for disease in this condition is still debated but abnormalities in TGFβ signaling have been observed as a consequence of FBN1 mutations. We have recently shown roles for both deregulation of TGFβ signaling and abnormal mechano‐sensing in disease development in Marfan syndrome using patient‐derived iPSC‐SMCs 65. Blockade of different components of TGFβ signaling partially rescued some aspects of the disease phenotype in iSMCs although more complex cocultures were not studied. Our present findings show that treatment of iEC:iSMC and pEC:pSMC cocultures exposed to disease hemodynamics with the TGFβR1/II inhibitor, LY2109761, was able to inhibit TGFβ signaling similarly in all cells, and validate this more physiological coculture system for further investigations of the Marfan iPSC‐based disease model.
The seminal finding that adult somatic cells can be reprogrammed by the ectopic expression of a distinct repertoire of factors and then differentiated into a variety of somatic cell types paved the way for new advances in disease modeling, drug screening, and cell‐based therapies 1, 66. This has enormous implications as adult stem cells of increasing donor age or primary cells have limited proliferation and differentiation capabilities. Furthermore, the use of iPSC versus embryonic stem cells (ESCs) circumvents ethical issues surrounding ESCs. In fact, studies have demonstrated that iPSCs exhibit minimal transcriptome variance to ESCs, increasing the likelihood of successful disease modeling with iPSC sources 58. Finally, as we have recently demonstrated, the generation of patient‐specific iPSCs creates a powerful model where both the disease‐causing mutation and the permissive genetic background for that disease phenotype can be captured and harnessed for further studies 65. If these patient‐derived iPSC‐based assays could lend themselves to high throughput screens, then this can enable personalization of new drug development and drug toxicity testing as vascular toxicity is a significant impediment to drug development.
Conclusion
We demonstrate that cocultures of iPSC‐derived ECs and SMCs display a high degree of similarity in response to hemodynamics as observed with primary EC:SMC cocultures. This finding opens up new possibilities for modeling rare diseases with patient‐derived iPSCs, screening new drugs, and developing personalized cell‐based therapies.
Author Contributions
M.S.C.: conception and design, collection and/or assembly of data, data analysis and interpretation, final approval of manuscript; B.K.C.: data analysis and interpretation, manuscript writing; R.A.F., D.M., M.B.S., and S.H.: data analysis and interpretation; M.L.: collection and/or assembly of data, data analysis and interpretation; F.S.: provision of study material or patients; B.R.B. and B.R.W.: conception and design, data analysis and interpretation, final approval of manuscript; S.S.: provision of study material or patients, final approval of manuscript.
Disclosure of Potential Conflicts of Interest
M.S.C., B.K.C., R.A.F., M.L., D.M., M.B.S., S.H., B.R.B., and B.R.W. are employed by and own stock in HemoShear Therapeutics. The other authors indicated no potential conflicts of interest.
Supporting information
Supporting Information
Acknowledgments
We thank Andrew W. Pryor, Nathan Day, Diana J. Berry, Sandi Walton, and Joshua Thomas for their experimental assistance. This work was supported by a grant from the British Heart Foundation (FS/13/29/30024) (to F.S. and S.S.). All other authors were supported by the SBIR Grant NCATS R43TR001206.
References
- 1. Singh VK, Kalsan M, Kumar N et al. Induced pluripotent stem cells: Applications in regenerative medicine, disease modeling, and drug discovery. Front Cell Dev Biol 2015;3:2. [DOI] [PMC free article] [PubMed] [Google Scholar]
- 2. Spitalieri P, Talarico VR, Murdocca M et al. Human induced pluripotent stem cells for monogenic disease modelling and therapy. World J Stem Cells 2016;8:118–135. [DOI] [PMC free article] [PubMed] [Google Scholar]
- 3. Soldner F, Jaenisch R. Medicine. iPSC disease modeling. Science 2012;338:1155–1156. [DOI] [PubMed] [Google Scholar]
- 4. Hastings NE, Simmers MB, McDonald OG et al. Atherosclerosis‐prone hemodynamics differentially regulates endothelial and smooth muscle cell phenotypes and promotes pro‐inflammatory priming. Am J Physiol Cell Physiol 2007;293:C1824–1833. [DOI] [PubMed] [Google Scholar]
- 5. Hastings NE, Feaver RE, Lee MY et al. Human IL‐8 regulates smooth muscle cell VCAM‐1 expression in response to endothelial cells exposed to atheroprone flow. Arterioscler Thromb Vasc Biol 2009;29:725–731. [DOI] [PMC free article] [PubMed] [Google Scholar]
- 6. Cole BK, Simmers MB, Feaver R et al. An in vitro cynomolgus vascular surrogate system for preclinical drug assessment and human translation. Arterioscler Thromb Vasc Biol 2015;35:2185–2195. [DOI] [PubMed] [Google Scholar]
- 7. Cheung C, Bernardo AS, Pedersen RA et al. Directed differentiation of embryonic origin‐specific vascular smooth muscle subtypes from human pluripotent stem cells. Nat Protoc 2014;9:929–938. [DOI] [PubMed] [Google Scholar]
- 8. Gelfand BD, Epstein FH, Blackman BR. Spatial and spectral heterogeneity of time‐varying shear stress profiles in the carotid bifurcation by phase‐contrast MRI. J Magn Reson Imaging 2006;24:1386–1392. [DOI] [PubMed] [Google Scholar]
- 9. Feaver RE, Gelfand BD, Blackman BR. Human haemodynamic frequency harmonics regulate the inflammatory phenotype of vascular endothelial cells. Nat Commun 2013;4:1525. [DOI] [PMC free article] [PubMed] [Google Scholar]
- 10. Langmead B, Salzberg SL. Fast gapped‐read alignment with Bowtie 2. Nat Methods 2012;9:357–359. [DOI] [PMC free article] [PubMed] [Google Scholar]
- 11. Roberts A, Pachter L. Streaming fragment assignment for real‐time analysis of sequencing experiments. Nat Methods 2013;10:71–73. [DOI] [PMC free article] [PubMed] [Google Scholar]
- 12. Robinson MD, McCarthy DJ, Smyth GK. edgeR: A Bioconductor package for differential expression analysis of digital gene expression data. Bioinformatics 2010;26:139–140. [DOI] [PMC free article] [PubMed] [Google Scholar]
- 13. Benjamini Y, Hochberg Y. Controlling the false discovery rate: A practical and powerful approach to multiple testing. J R Stat Soc Series B 1995;57:289–300. [Google Scholar]
- 14. Ashburner M, Ball CA, Blake JA et al. Gene ontology: Tool for the unification of biology. The gene ontology consortium. Nat Genet 2000;25:25–29. [DOI] [PMC free article] [PubMed] [Google Scholar]
- 15. Croft D, Mundo AF, Haw R et al. The Reactome pathway knowledgebase. Nucleic Acids Res 2014;42:D472–477. [DOI] [PMC free article] [PubMed] [Google Scholar]
- 16. Kanehisa M, Goto S. KEGG: Kyoto encyclopedia of genes and genomes. Nucleic Acids Res 2000;28:27–30. [DOI] [PMC free article] [PubMed] [Google Scholar]
- 17. Nishimura D. BioCarta. Biotech software & internet report 2004;2:117–120. [Google Scholar]
- 18. Ritchie ME, Phipson B, Wu D et al. limma powers differential expression analyses for RNA‐sequencing and microarray studies. Nucleic Acids Res 2015;43:e47. [DOI] [PMC free article] [PubMed] [Google Scholar]
- 19. Schaefer CF, Anthony K, Krupa S et al. PID: The Pathway interaction database. Nucleic Acids Res 2009;37:D674–679. [DOI] [PMC free article] [PubMed] [Google Scholar]
- 20. Subramanian A, Tamayo P, Mootha VK et al. Gene set enrichment analysis: A knowledge‐based approach for interpreting genome‐wide expression profiles. Proc Natl Acad Sci USA 2005;102:15545–15550. [DOI] [PMC free article] [PubMed] [Google Scholar]
- 21. Tarca AL, Draghici S, Khatri P et al. A novel signaling pathway impact analysis. Bioinformatics 2009;25:75–82. [DOI] [PMC free article] [PubMed] [Google Scholar]
- 22. Blondel V, Guillaume J‐L, Lambiotte R et al. Fast unfolding of communities in large networks. J Stat Mech 2008;10008. [Google Scholar]
- 23. Terelius Y, Figler RA, Marukian S et al. Transcriptional profiling suggests that Nevirapine and Ritonavir cause drug induced liver injury through distinct mechanisms in primary human hepatocytes. Chem Biol Interact 2016;255:31–44. [DOI] [PMC free article] [PubMed] [Google Scholar]
- 24. Jensen LJ, Kuhn M, Stark M et al. STRING 8–a global view on proteins and their functional interactions in 630 organisms. Nucleic Acids Res 2009;37:D412–D416. [DOI] [PMC free article] [PubMed] [Google Scholar]
- 25. DeBakey ME, Lawrie GM, Glaeser DH. Patterns of atherosclerosis and their surgical significance. Ann Surg 1985;201:115–131. [DOI] [PMC free article] [PubMed] [Google Scholar]
- 26. Baldwin HS, Shen HM, Yan HC et al. Platelet endothelial cell adhesion molecule‐1 (PECAM‐1/CD31): Alternatively spliced, functionally distinct isoforms expressed during mammalian cardiovascular development. Development 1994;120:2539–2553. [DOI] [PubMed] [Google Scholar]
- 27. Banerjee S, Dhara SK, Bacanamwo M. Endoglin is a novel endothelial cell specification gene. Stem Cell Res 2012;8:85–96. [DOI] [PMC free article] [PubMed] [Google Scholar]
- 28. Breier G, Breviario F, Caveda L et al. Molecular cloning and expression of murine vascular endothelial‐cadherin in early stage development of cardiovascular system. Blood 1996;87:630–641. [PubMed] [Google Scholar]
- 29. Dumont DJ, Fong GH, Puri MC et al. Vascularization of the mouse embryo: A study of flk‐1, tek, tie, and vascular endothelial growth factor expression during development. Dev Dyn 1995;203:80–92. [DOI] [PubMed] [Google Scholar]
- 30. Hamik A, Lin Z, Kumar A et al. Kruppel‐like factor 4 regulates endothelial inflammation. J Biol Chem 2007;282:13769–13779. [DOI] [PubMed] [Google Scholar]
- 31. SenBanerjee S, Lin Z, Atkins GB et al. KLF2 Is a novel transcriptional regulator of endothelial proinflammatory activation. J Exp Med 2004;199:1305–1315. [DOI] [PMC free article] [PubMed] [Google Scholar]
- 32. Kane NM, Xiao Q, Baker AH et al. Pluripotent stem cell differentiation into vascular cells: A novel technology with promises for vascular re(generation). Pharmacol Ther 2011;129:29–49. [DOI] [PubMed] [Google Scholar]
- 33. Tran QK, Ohashi K, Watanabe H. Calcium signalling in endothelial cells. Cardiovasc Res 2000;48:13–22. [DOI] [PubMed] [Google Scholar]
- 34. Qiu J, Zheng Y, Hu J et al. Biomechanical regulation of vascular smooth muscle cell functions: From in vitro to in vivo understanding. J R Soc Interface 2014;11:20130852. [DOI] [PMC free article] [PubMed] [Google Scholar]
- 35. van Hinsbergh VW. Endothelium–role in regulation of coagulation and inflammation. Semin Immunopathol 2012;34:93–106. [DOI] [PMC free article] [PubMed] [Google Scholar]
- 36. Holthofer H, Virtanen I, Kariniemi AL et al. Ulex europaeus I lectin as a marker for vascular endothelium in human tissues. Lab Invest 1982;47:60–66. [PubMed] [Google Scholar]
- 37. Voyta JC, Via DP, Butterfield CE et al. Identification and isolation of endothelial cells based on their increased uptake of acetylated‐low density lipoprotein. J Cell Biol 1984;99:2034–2040. [DOI] [PMC free article] [PubMed] [Google Scholar]
- 38. Owens GK, Kumar MS, Wamhoff BR. Molecular regulation of vascular smooth muscle cell differentiation in development and disease. Physiol Rev 2004;84:767–801. [DOI] [PubMed] [Google Scholar]
- 39. Sinha S, Iyer D, Granata A. Embryonic origins of human vascular smooth muscle cells: Implications for in vitro modeling and clinical application. Cell Mol Life Sci 2014;71:2271–2288. [DOI] [PMC free article] [PubMed] [Google Scholar]
- 40. Parmacek MS. Myocardin: Dominant driver of the smooth muscle cell contractile phenotype. Arterioscler Thromb Vasc Biol 2008;28:1416–1417. [DOI] [PMC free article] [PubMed] [Google Scholar]
- 41. Orr AW, Hastings NE, Blackman BR et al. Complex regulation and function of the inflammatory smooth muscle cell phenotype in atherosclerosis. J Vasc Res 2010;47:168–180. [DOI] [PMC free article] [PubMed] [Google Scholar]
- 42. Bonomini F, Tengattini S, Fabiano A et al. Atherosclerosis and oxidative stress. Histol Histopathol 2008;23:381–390. [DOI] [PubMed] [Google Scholar]
- 43. Gordon KJ, Blobe GC. Role of transforming growth factor‐beta superfamily signaling pathways in human disease. Biochim Biophys Acta 2008;1782:197–228. [DOI] [PubMed] [Google Scholar]
- 44. Derynck R, Zhang YE. Smad‐dependent and Smad‐independent pathways in TGF‐beta family signalling. Nature 2003;425:577–584. [DOI] [PubMed] [Google Scholar]
- 45. Adams WJ, Zhang Y, Cloutier J et al. Functional vascular endothelium derived from human induced pluripotent stem cells. Stem Cell Reports 2013;1:105–113. [DOI] [PMC free article] [PubMed] [Google Scholar]
- 46. Cheung C, Bernardo AS, Trotter MW et al. Generation of human vascular smooth muscle subtypes provides insight into embryological origin‐dependent disease susceptibility. Nat Biotechnol 2012;30:165–173. [DOI] [PMC free article] [PubMed] [Google Scholar]
- 47. Choi KD, Yu J, Smuga‐Otto K et al. Hematopoietic and endothelial differentiation of human induced pluripotent stem cells. Stem Cells 2009;27:559–567. [DOI] [PMC free article] [PubMed] [Google Scholar]
- 48. Dash BC, Jiang Z, Suh C et al. Induced pluripotent stem cell‐derived vascular smooth muscle cells: Methods and application. Biochem J 2015. ; 465:185–194. [DOI] [PMC free article] [PubMed] [Google Scholar]
- 49. Ge X, Ren Y, Bartulos O et al. Modeling supravalvular aortic stenosis syndrome with human induced pluripotent stem cells. Circulation 2012;126:1695–1704. [DOI] [PMC free article] [PubMed] [Google Scholar]
- 50. Homma K, Sone M, Taura D et al. Sirt1 plays an important role in mediating greater functionality of human ES/iPS‐derived vascular endothelial cells. Atherosclerosis 2010:212:42–47. [DOI] [PubMed] [Google Scholar]
- 51. Karamariti E, Margariti A, Winkler B et al. Smooth muscle cells differentiated from reprogrammed embryonic lung fibroblasts through DKK3 signaling are potent for tissue engineering of vascular grafts. Circ Res 2013;112:1433–1443. [DOI] [PubMed] [Google Scholar]
- 52. Li Z, Hu S, Ghosh Z et al. Functional characterization and expression profiling of human induced pluripotent stem cell‐ and embryonic stem cell‐derived endothelial cells. Stem Cells Dev 2011;20:1701–1710. [DOI] [PMC free article] [PubMed] [Google Scholar]
- 53. Park SW, Jun Koh Y, Jeon J et al. Efficient differentiation of human pluripotent stem cells into functional CD34+ progenitor cells by combined modulation of the MEK/ERK and BMP4 signaling pathways. Blood 2010;116:5762–5772. [DOI] [PubMed] [Google Scholar]
- 54. Rufaihah AJ, Huang NF, Jame S et al. Endothelial cells derived from human iPSCS increase capillary density and improve perfusion in a mouse model of peripheral arterial disease. Arterioscler Thromb Vasc Biol 2011;31:e72–79. [DOI] [PMC free article] [PubMed] [Google Scholar]
- 55. Taura D, Sone M, Homma K et al. Induction and isolation of vascular cells from human induced pluripotent stem cells–brief report. Arterioscler Thromb Vasc Biol 2009;29:1100–1103. [DOI] [PubMed] [Google Scholar]
- 56. Wang Y, Hu J, Jiao J et al. Engineering vascular tissue with functional smooth muscle cells derived from human iPS cells and nanofibrous scaffolds. Biomaterials 2014;35:8960–8969. [DOI] [PMC free article] [PubMed] [Google Scholar]
- 57. Wanjare M, Kuo F, Gerecht S. Derivation and maturation of synthetic and contractile vascular smooth muscle cells from human pluripotent stem cells. Cardiovasc Res 2013;97:321–330. [DOI] [PMC free article] [PubMed] [Google Scholar]
- 58. White MP, Rufaihah AJ, Liu L et al. Limited gene expression variation in human embryonic stem cell and induced pluripotent stem cell‐derived endothelial cells. Stem Cells 2013;31:92–103. [DOI] [PMC free article] [PubMed] [Google Scholar]
- 59. Ferreira C, Ziegler S, Gahl W. Generalized arterial calcification of infancy In: Pagon RA, Adam MP, Ardinger HH. et al. eds. GeneReviews(R) [Internet], Seattle, WA: University of Washington, Seattle; 1993. [PubMed] [Google Scholar]
- 60. Yuan SM, Jing H. Marfan's syndrome: An overview. Sao Paulo Med J 2010;128:360–366. [DOI] [PMC free article] [PubMed] [Google Scholar]
- 61. Wamhoff BR, Bowles DK, McDonald OG et al. L‐type voltage‐gated Ca2+ channels modulate expression of smooth muscle differentiation marker genes via a rho kinase/myocardin/SRF‐dependent mechanism. Circ Res 2004;95:406–414. [DOI] [PubMed] [Google Scholar]
- 62. Wamhoff BR, Bowles DK, Owens GK. Excitation‐transcription coupling in arterial smooth muscle. Circ Res 2006;98:868–878. [DOI] [PubMed] [Google Scholar]
- 63. Hirschi KK, Majesky MW. Smooth muscle stem cells. Anat Rec A Discov Mol Cell Evol Biol 2004;276:22–33. [DOI] [PubMed] [Google Scholar]
- 64. Norman PE, Powell JT. Site specificity of aneurysmal disease. Circulation 2010;121:560–568. [DOI] [PubMed] [Google Scholar]
- 65. Granata A, Serrano F, Bernard WG et al. An iPSC‐derived vascular model of Marfan syndrome identifies key mediators of smooth muscle cell death. Nature Genet. 2017:49:97–109. [DOI] [PubMed] [Google Scholar]
- 66. Takahashi K, Yamanaka S. Induction of pluripotent stem cells from mouse embryonic and adult fibroblast cultures by defined factors. Cell 2006;126:663–676. [DOI] [PubMed] [Google Scholar]
Associated Data
This section collects any data citations, data availability statements, or supplementary materials included in this article.
Supplementary Materials
Supporting Information