Abstract.
An ultra-high resolution (UHR) mode, with a detector pixel size of relative to isocenter, has been implemented on a whole body research photon-counting detector (PCD) computed tomography (CT) system. Twenty synthetic lung nodules were scanned using UHR and conventional resolution (macro) modes and reconstructed with medium and very sharp kernels. Linear regression was used to compare measured nodule volumes from CT images to reference volumes. The full-width-at-half-maximum of the calculated curvature histogram for each nodule was used as a shape index, and receiver operating characteristic analysis was performed to differentiate sphere- and star-shaped nodules. Results showed a strong linear relationship between measured nodule volumes and reference volumes for both modes. The overall volume estimation was more accurate using UHR mode and the very sharp kernel, having 4.8% error compared with 10.5% to 12.6% error in the macro mode. The improvement in volume measurements using the UHR mode was more evident for small nodule sizes or star-shaped nodules. Images from the UHR mode with the very sharp kernel consistently demonstrated the best performance [] for separating star- from sphere-shaped nodules, showing advantages of UHR mode on a PCD CT scanner for lung nodule characterization.
Keywords: computed tomography, photon-counting detector, lung nodule, volume, shape index, shape differentiation
1. Introduction
Lung cancer is the main cause of death among all cancer types for both men and women in the United States, resulting in deaths every year.1,2 Late diagnosis is the major reason for treatment failure; meanwhile, 5-year survival rate at early stage of lung cancer is higher than 70%.3–5 Recent studies have demonstrated that morphological properties of lung nodules—such as size, shape, and their respective changes over time—are related to the likelihood of malignancy.6–8 Volumetric computed tomography (CT) has been shown to be an effective imaging tool for the monitor, diagnosis, and staging of lung cancer by providing quantitative information regarding lung nodule size and shape.
A photon-counting detector (PCD)-based CT system is able to count individual incident photons, which opens up new possibilities for CT applications.9–15 A research PCD CT system available at our institution offers notable benefits, including improved spatial resolution, contrast-to-noise ratio, and dose efficiency compared with traditional energy-integrating detector (EID) CT systems.16–21 Conventional EIDs use indirect conversion of x-rays into electrical signals. Because the x-ray energy is first converted into visible light, septa are required between detector pixels to limit cross-talk and maintain spatial resolution. The existence of these septa reduces the detector’s fill factor and geometric dose efficiency. PCDs directly convert x-ray energy into electrical signals. The semiconductor detector material is not diced into individual detectors; rather, the detector pixels are created at the anode of the detector. Therefore, no reflective septa are required. This allows for a smaller detector pixel without decreasing the fill factor or geometric dose efficiency. For the PCD system investigated, a native detector pixel size of can be achieved. In the regular configuration (macro mode), a matrix of subpixels is grouped together, yielding an effective detector pixel size of at the detector and at the isocenter.16 An ultra-high resolution (UHR) configuration, referred to as the UHR mode, was recently implemented by grouping subpixels (instead of ), yielding an effective detector pixel size of on the detector, corresponding to pixel size at the isocenter.18 The use of a subpixel read-out unit, instead of the native subpixel, was due to data transfer rate limitations.18 This improvement in detector spatial resolution of the PCD CT system has the potential for improved accuracy in volumetric CT, which serves as a quantitative imaging biomarker for lung nodule growth.8
The aim of this study was to evaluate the performance of the UHR mode on a PCD CT scanner in phantom studies for the task of volume quantification and shape differentiation for lung nodules. The influence of nodule properties (size, shape, and radio density) and reconstruction kernel was assessed and the performance of the UHR mode was compared to that of the macro mode.
2. Methods
2.1. PCD CT Scanner and Imaging Protocols
A whole-body research PCD CT scanner (Somatom CounT, Siemens Healthcare, Forchheim, Germany) based on the second-generation dual-source CT scanner (Definition Flash, Siemens Healthcare) was used in this study. Scans were performed using two acquisition modes: the UHR mode with collimation and the macro mode with collimation. Spiral scans were performed with the following parameters, which were identical for both modes: 140 kV, energy thresholds of 25 and 75 keV, 1.0 s rotation time, pitch of 0.6, 36 effective mAs, and corresponding volume CT dose index () of 4.37 mGy. Energy thresholds were chosen to approximately achieve an equal amount of photons in each of the two energy bins. Images corresponding to the low-energy threshold (25 to 140 keV) were reconstructed with a matrix size of with a very sharp kernel (S80f) for volume quantification and shape discrimination.18 A medium sharp kernel (B46f) was also used to match what is currently used clinically on an EID scanner for lung nodule quantification. The reconstruction field-of-view (FoV) was and the thinnest available image thickness was used for each mode (0.25 mm for UHR and 0.5 mm for macro).
2.2. Phantoms
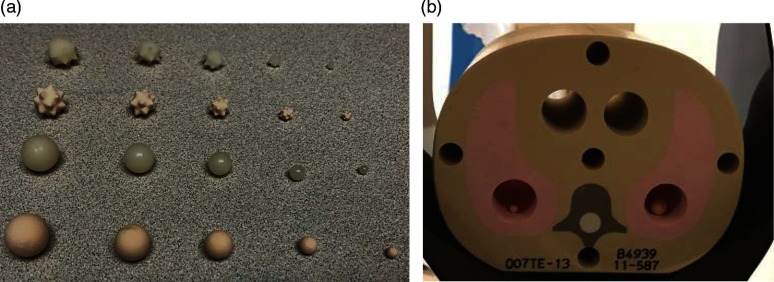
A set of synthetic nodules [Kyoto Kagaku Co., Ltd., Kyoto, Japan, Fig. 1(a)] were embedded into a tissue equivalent pediatric thorax phantom (, CIRS, Norfolk, Virginia). A total of 20 nodules were included in this study: two shapes (sphere and star), five sizes (3, 5, 8, 10, 12 mm in diameter), and two radio densities (quantified in terms of CT number, and ). All nodules were placed inside the phantom within the 27.5 cm FoV of the PCD CT system.
Fig. 1.
(a) Photograph of the different types of synthetic nodules and (b) CIRS tissue-equivalent thoracic phantom used in this study.
The reference volumes of the lung nodules were obtained from images acquired with a micro CT scanner (North Star Imaging, Inc., Minnesota) using a voxel size, as has been previously reported.22 The measured volumes ranged from 14.3 to for the nodules used in this study.
2.3. Volume Measurement from PCD CT Images
Volume measurements from PCD CT images were performed using MATLAB-based software (Version R2013b, MathWorks, Massachusetts) developed in our lab. Nodule volumes were quantified in a semiautomatic manner. After loading the DICOM images into the software, the user first manually identified all the possible nodules by clicking on the center of the nodule, after which a three-dimensional (3-D) segmentation of each nodule was automatically performed. Volume estimation was calculated by multiplying the number of voxels contained in each nodule by the voxel size.
2.4. Shape Differentiation
The same segmentation process was used as that described in the previous section on volume measurement. After segmentation, surface meshes were generated for each of the nodules. For each nodule, curvature of each vertex on the surface mesh, defined as the reciprocal of local circle radius, was calculated. It has been demonstrated that a complicated surface has a wider range of curvatures than a smooth surface.23 The full-width-at-half-maximum of the curvature histogram was used as the shape index for each nodule to represent the complexity of the surface. The shape index was then used for nodule shape differentiation between sphere- and star-shaped nodules.
2.5. Statistical Analysis
Linear regression analysis was performed to compare the PCD-CT measured volume to the reference values. Slope and intercept values with their 95% confidence intervals (CIs) were calculated, together with and root-mean-square-error (RMSE) to evaluate the goodness-of-fit and accuracy of volume estimation. Receiver operating characteristic (ROC) analysis was performed and area under the ROC curve (AUC) was used as a figure of merit for the differentiation of nodule shapes (sphere versus star). Mean AUC values and 95% CIs were calculated using bootstrapping and 200 samples. A two-tailed, paired -test with Bonferroni correction was used to compare the volume measurements and AUC values between acquisition modes and reconstruction kernels. A two-tailed -test was used to compare the shape index differences between sphere and star nodules. For all tests, was considered to be statistically significant.
3. Results
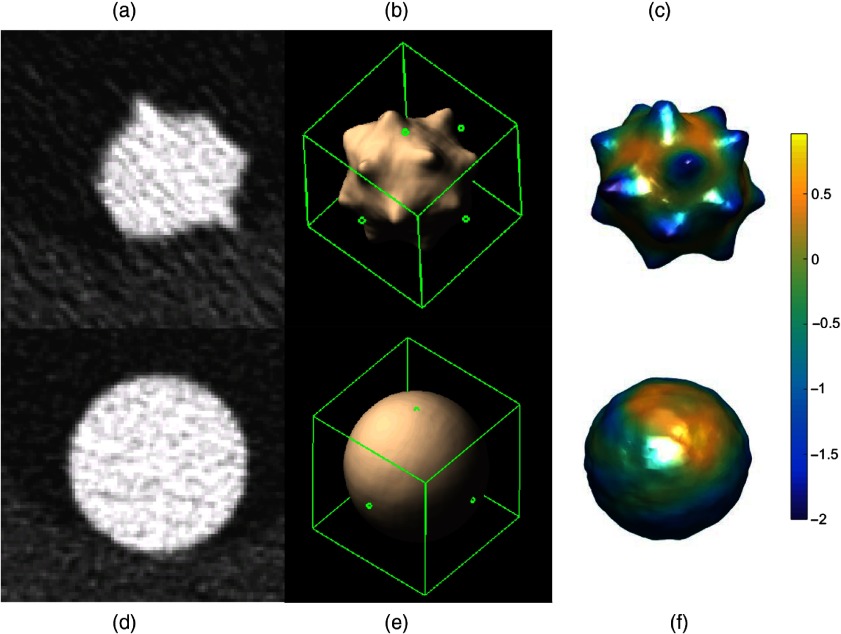
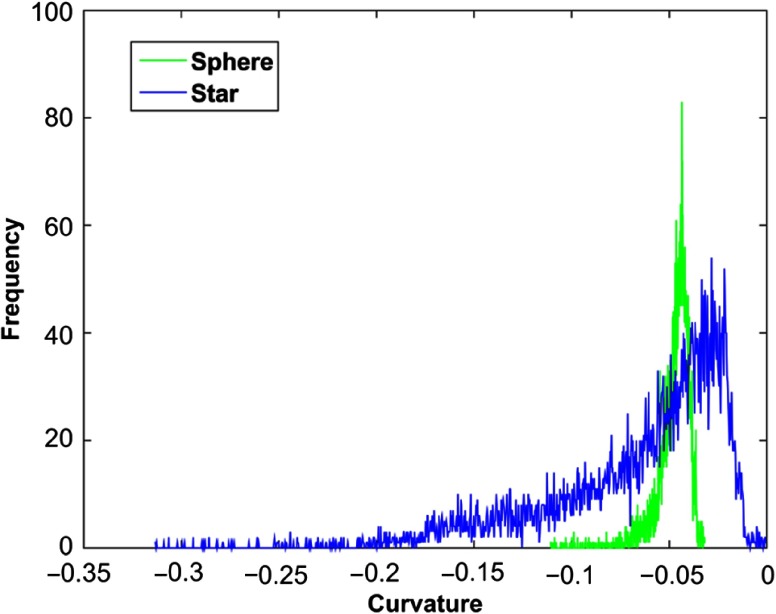
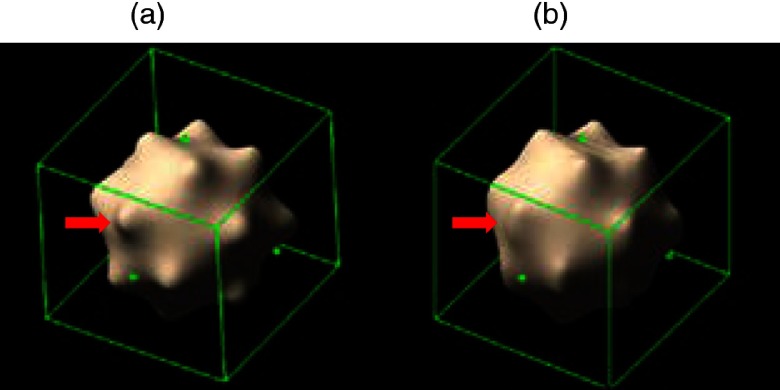
Image noise was measured from four acquisition/reconstruction combinations: 81.5 HU for UHR with S80f kernel, 26.6 HU for UHR with B46f kernel, 21.6 HU for macro with S80f kernel, and 19.5 HU for macro with B46f kernel. Figure 2 shows representative images of a star- and sphere-shaped nodule scanned with the PCD-CT UHR-mode, including axial images [Figs. 2(a) and 2(d)], 3-D volume rendered images [Figs. 2(b) and 2(e)], and the surface curvature distribution [Figs. 2(c) and 2(f)]. Figure 3 shows a comparison of surface curvature distributions for star-shaped and sphere-shaped nodules. Figure 4 shows a comparison of 3-D volume-rendered images of a star-shaped nodule acquired with the UHR mode [Fig. 4(a)] and macro mode [Fig. 4(b)], both reconstructed with the S80f kernel. Figure 5 shows a scatter plot [Fig. 5(a)] and a log-transformed scatter plot [Fig. 5(b)] of the measured versus reference nodule volumes. Table 1 summarizes the slope (95% CI), intercept (95% CI), , and RMSE for the linear regression analysis between measured nodule volume and reference volume for the two modes (macro, UHR) and two reconstruction kernels (B46f, S80f). Results demonstrated that all slopes were close to 1 and was close to 1, indicating that all volume measurements from the four PCD-CT techniques were highly linear in relation to the reference values.
Fig. 2.
Representative UHR mode axial CT image (a: star, d: sphere), 3-D volume rendering (b: star, e: sphere) and surface curvature distribution (c: star, f: sphere), .
Fig. 3.
Surface curvature distribution comparison between a 10-mm star-shaped (blue) and a 10-mm sphere-shaped (green) lung nodule. The star-shaped nodule has a wider distribution of curvature than the sphere-shaped nodule.
Fig. 4.
3-D volume rendering comparison between (a) UHR mode and (b) macro mode from images reconstructed with the sharp kernel (S80f) for a 10-mm star-shaped lung nodule. Red arrow indicates better feature depiction of star-shaped nodules for UHR.
Fig. 5.
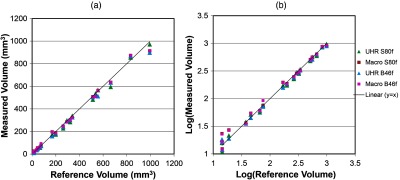
(a) Scatter plot and (b) log-transformed scatter plot of the measured versus reference volumes showed good linearity.
Table 1.
Summary of linear regression results for all nodules with different acquisition modes and reconstruction kernels.
| Mode and reconstruction kernel | Slope | Intercept () | RMSE () | |
|---|---|---|---|---|
| UHR S80f | 0.98 (0.95, 1.02) | (, 11.31) | 0.992 | 21.31 |
| Macro S80f | 0.96 (0.93, 1.00) | (, 19.77) | 0.994 | 22.49 |
| UHR B46f | 0.96 (0.92, 0.99) | 0.54 (, 15.57) | 0.994 | 22.20 |
| Macro B46f | 0.96 (0.93, 1.00) | 5.06 (, 20.18) | 0.994 | 22.35 |
We found, however, that UHR mode provided more accurate volume estimation with a significantly () lower absolute percent error (4.8%) compared with macro mode (12.6%) for S80f kernel. For B46f kernel, the absolute percent error of UHR mode (10.0%) was not significantly different () compared with that of macro mode (10.5%). There was no significant difference between the two kernels with macro mode () while for UHR mode, S80f kernel had significantly lower absolute percent error than B46f (). Detailed statistical analysis results were shown in Table 2.
Table 2.
Summary of statistical analysis for comparing the absolute percent error between two acquisition modes and two reconstruction kernels. is considered statistically significant.
| Comparison | -value (adjusted) |
|---|---|
| UHR versus macro at S80f | 0.01 |
| UHR versus macro at B46f | 0.99 |
| S80f versus B46f at UHR | 0.01 |
| S80f versus B46f at macro | 0.50 |
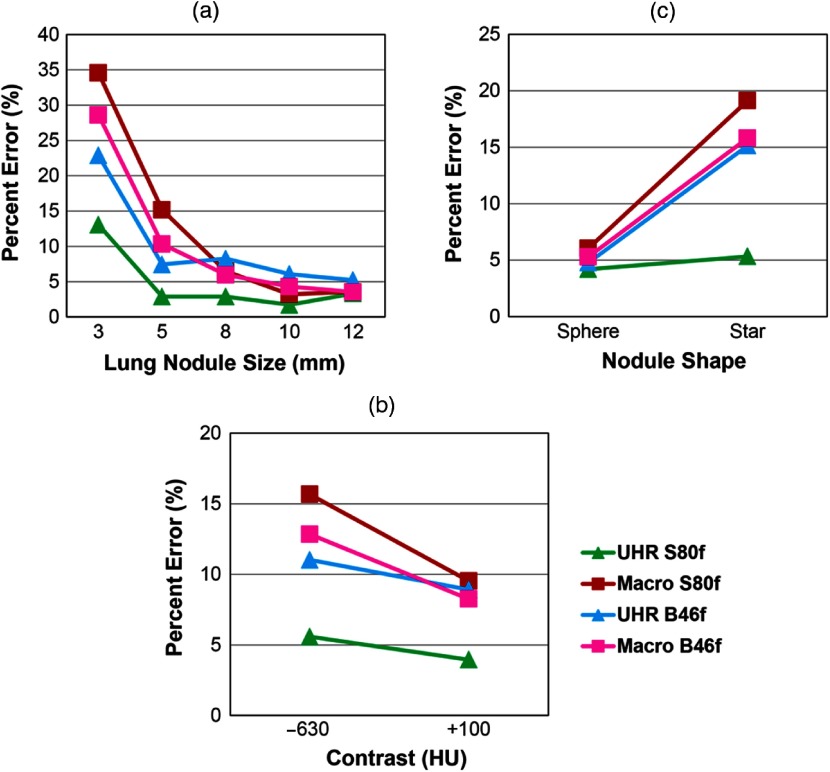
The volume measurement absolute percent error for each acquisition mode and reconstruction kernel combination was computed and compared based on lung nodule properties, including nodule size [Fig. 6(a)], nodule CT number [Fig. 6(b)], and nodule shape [Fig. 6(c)]. With B46f kernel, UHR mode demonstrated substantially lower absolute percent error values for the small nodules (22.9%, for 3 mm, 7.4% for 5 mm) than the macro mode (3 mm: 28.6% for B46f, 34.6% for S80f: 5 mm: 10.3% for B46f, 15.2% for S80f). With S80f kernel, the UHR mode further increased the volume accuracy with the lowest absolute percent error (13.1% for 3 mm, 2.9% for 5 mm). For large size nodules (), the absolute percent error of UHR mode (5.2% to 8.3% for B46f, 1.8% to 3.3% for S80f) was similar to that of macro mode (3.5% to 6.0% for B46f, 3.2% to 6.5% for S80f). This demonstrated the benefit of the UHR mode for small lung nodules, where improved spatial resolution had a more obvious effect. For the high contrast nodule (), the absolute percent error of UHR mode with S80f (4.0%) was lower than that of macro mode (8.2% for B46f and 9.5% for S80f), and for low contrast nodule (), the absolute percent error of UHR mode with S80f kernel (5.6%) had a lower absolute percent error compared with UHR mode with B46f (16.5%) and macro mode (12.8% for B46f, 15.7% for S80f). Finally, both modes demonstrated similar errors for sphere-shaped nodules (UHR: 4.8% for B46f, 4.2% for S80f; macro: 5.3% for B46f, 6.0% for S80f). By contrast, UHR mode with S80f kernel had more accurate volume measurements of star-shaped nodules (5.3%) than did UHR with B46f kernel (15.2%) and macro mode with both kernels (15.8% for B46f, 19.1% for S80f).
Fig. 6.
Mean absolute percent error of volume measurements according to (a) nodule size, (b) CT contrast, and (c) nodule shape for the evaluated acquisition modes and reconstruction kernels.
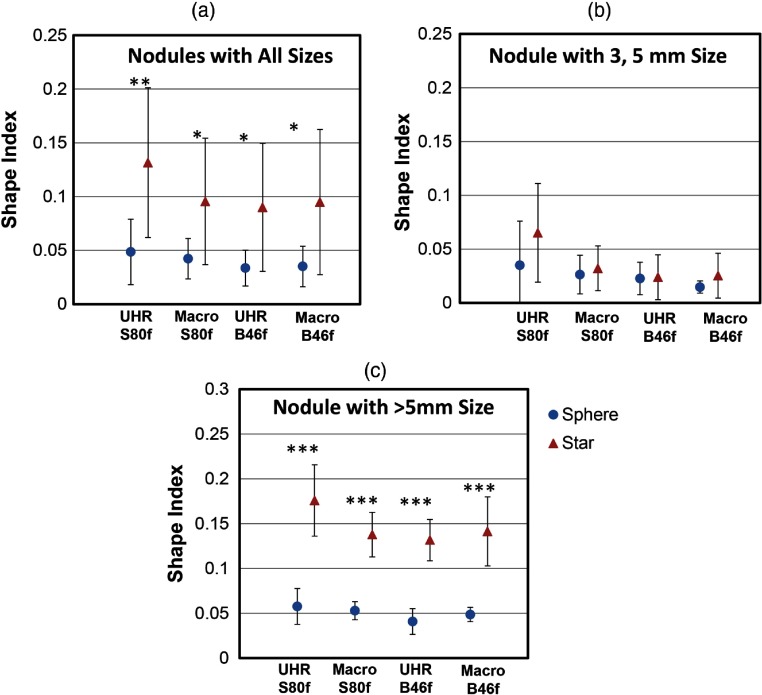
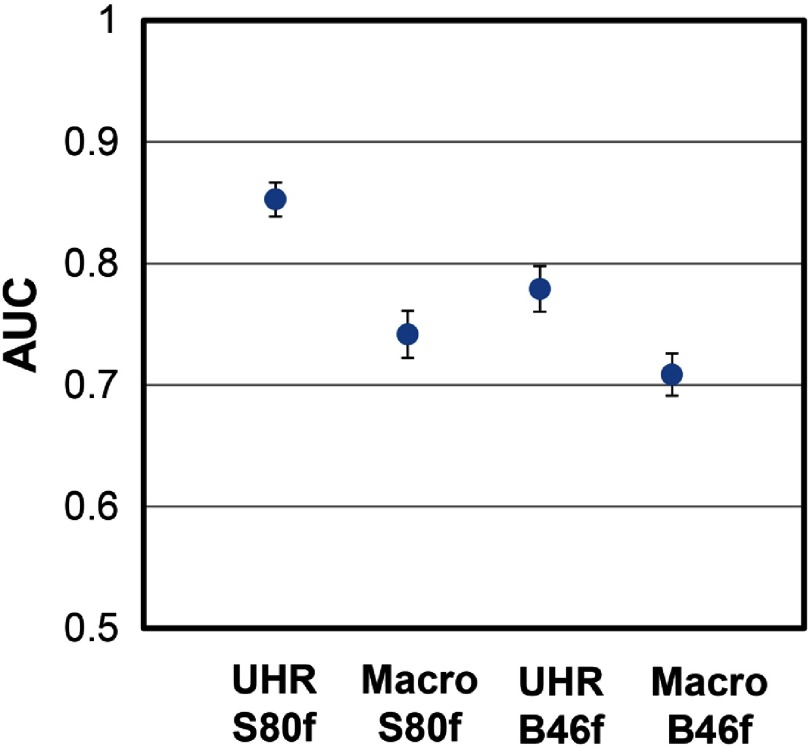
The shape indices for sphere and star nodules with different scan mode/reconstruction combinations are shown in Fig. 7. For all nodule sizes [Fig. 7(a)], the averaged shape indices ranged from 0.034 to 0.049 for sphere nodules and from 0.090 to 0.132 for star nodules. For each scan mode and reconstruction combination, the averaged shape indices of the sphere nodules were significantly lower than that of the star nodules (). For nodules with diameters [Fig. 7(b)], UHR images reconstructed with the sharp kernel (S80f) showed the largest difference in shape indices among all acquisitions, although none of the comparisons were statistically significant. For nodules with diameters [Fig. 7(c)], shape indices for sphere-shaped nodules were significantly lower than for star-shaped nodules across all acquisition and reconstruction combinations. For nodules of all sizes, ROC analysis (Fig. 8) demonstrated that the UHR mode had significantly higher (Table 3, ) AUC values [95% CI: (0.839, 0.867) for S80f and (0.761, 0.799) for B46f] compared to macro mode [95% CI: (0.723, 0.761) for S80f and (0.692, 0.726) for B46f] for the task of discriminating sphere- and star-shaped nodules. The sharp kernel (S80f) and UHR mode had a significantly higher AUC value () than the medium sharp kernel (B46f) and the UHR mode.
Fig. 7.
The mean and standard deviation of shape indices for sphere and star shaped nodules at (a) all sizes, (b) , and (c) calculated from images obtained with different acquisition modes and reconstruction kernels. *, **, and ***.
Fig. 8.
AUC comparison from ROC analysis for the task of differentiating spheres from star-shaped nodules from all sizes using images with different acquisition modes and reconstruction kernels. The blue dots represent the mean AUC value while the error bars indicate 95% CI.
Table 3.
Summary of statistical analysis for comparing the AUC values from ROC analysis between the acquisition mode and reconstruction kernel combinations. is considered statistically significant.
| Comparison | -value (adjusted) |
|---|---|
| UHR versus macro at S80f | |
| UHR versus macro at B46f | |
| S80f versus B46f at UHR | |
| S80f versus B46f at macro | 0.08 |
4. Discussion
Improved assessment of nodule morphology could potentially increase the sensitivity of detecting cancerous lung nodule. We evaluated lung nodule characterization using two acquisition modes (UHR and macro) available on PCD CT by analyzing the accuracy of volume measurements and the ability to differentiate the sphere from star-shaped nodules. This is the first quantitative characterization of lung nodules using the UHR mode of a PCD CT system. The results obtained here would likely apply equally well to conventional (EID) CT systems, should such a system provide similar spatial resolution characteristics. To date, however, the smallest image thickness available commercially is 0.5 mm.
Previous phantom studies investigated the influence of collimations (0.625 to 1.5 mm) and slice thickness (0.625 to 5 mm) on lung nodule volume quantification using commercial scanners with EIDs. It was reported that thinner collimations and slice thicknesses could improve the accuracy of lung nodule volume measurements.24,25 In these studies, the thinnest slice thickness was 0.625 mm; while in our study, collimation and slice thickness were further reduced down to 0.25 mm using the PCD technique. We showed that the ultrathin collimation (0.25 mm) with slice thickness at 0.25 mm enabled further improvement of volume measurements. As expected, image noise increased for thin image thicknesses. Since both resolution and noise affect volume and shape quantification accuracy, at a certain point, the benefit of the UHR scan mode could be offset by high image noise, negatively impacting accurate characterization. For the scenario investigated in this study using clinical dose levels, even though the noise level increased in the thinner UHR images, the improved resolution provided overall better delineation of the nodules. Energy threshold selection might also impact spatial resolution and image noise. Use of a higher energy threshold increases image noise by discarding more photons below the energy threshold, but may also increase spatial resolution by reducing the influence of charge sharing and fluorescence, as shown by Koenig et al.26 As charge sharing and fluorescence highly depend on the specific detector configuration, especially the pixel size, future studies are needed to assess whether similar effects as in the work by Koenig exist on the system investigated in this work. Previous studies also demonstrated that reconstruction kernels had negligible influence on lung nodule volume quantification for image slice thickness from 0.625 to 5 mm.24,25 In these scenarios, slice thickness was the most essential imaging parameter for volume estimation. This was corroborated with our data in macro mode, where two kernels yielded similar results of nodule volume. However, as slice thickness went down to 0.25 mm in the UHR acquisition, the reconstruction kernel could become more influential in volume accuracy, and the sharp kernel yielded more accurate measurements in UHR datasets.
For small nodules (), UHR mode was able to achieve more accurate volume measurements than macro mode due to the higher spatial resolution. Studies have demonstrated that the growth of some solid nodules smaller than 6 mm in diameter is greater than that of large nodules,27 with rapid volume doubling being considered as an indicator of malignancy.6 Therefore, 12-month follow-up CT scans to monitor the growth of small nodules have been recommended by the most recent clinical guidelines.28,29 Since nodule growth and growth rate are calculated based on the measurement of nodule size on CT images acquired at different time points, accurate volume measurement at each time point is essential to accurately monitor nodule growth over time. However, volumes of small nodules are more susceptible to measurement errors. For instance, a 4-mm measurement (diameter) for a 3-mm nodule could result in a 37% volume bias. For PCD CT with UHR mode and sharp kernel, the volumetric measurement of small nodules could achieve similar accuracy in comparison to that of large nodules.
Studies have shown that nodules with irregular or spiculated margins, particularly with distortion of adjacent vessels, are likely to be malignant.30 However, the irregular shape of the nodules could increase the errors in volume measurement.31 In our study, all acquisitions showed comparatively low bias in evaluating volumes of sphere nodules. However, for irregularly shaped (star) nodules, particularly at small sizes (), UHR acquisitions with the sharp kernel provided substantially better accuracy in volume measurements compared to the other three acquisition mode/reconstruction kernel combinations. Furthermore, ROC analyses showed a clear benefit of the UHR mode, demonstrating an increased capability to differentiate small, smooth, spherical nodules from small, irregularly shaped nodules. Our results also showed that shape indices can be used as a useful diagnostic indicator for lung nodules.
There are several limitations in the current study. The number of nodules included in this study was relatively small and was limited to two shapes (sphere and star) due to limited availability of precision-manufactured nodule phantoms. Future studies to investigate the repeatability of volume and shaped index measurements using the UHR mode would be of benefit, as would including more nodules with different shapes. Additionally, the thorax phantom used is relatively small compared with typical adult patients.
5. Conclusion
With its improved spatial resolution, the UHR mode of the evaluated PCD CT system was able to improve measurement accuracy for nodule volume and nodule shape characterization. This improvement could substantially increase the ability to monitor changes in nodule volume and shape clinically. The results of the current study indicate the potential for the UHR mode of the PCD CT system to have a substantial impact on lung imaging, as well as other applications that are now limited by spatial resolution.
Acknowledgments
Research reported in this article was supported by the National Institutes of Health under award numbers C06 RR018898 and R01 EB016966. The content is solely the responsibility of the authors and does not necessarily represent the official views of the National Institutes of Health. The equipment and concepts described in this work are based on a research device and are not commercially available.
Biographies
Wei Zhou received his BS degree in physics from Nanjing University in 2012 and his PhD in medical physics from the University of Texas Health Science Center, San Antonio, in 2016. He is currently a medical physics resident at Mayo Clinic. His research interests include CT physics, multienergy CT, and quantitative MRI.
Juan Montoya received his BS degree in biomedical engineering from EIA-CES University (Medellin, Colombia) in 2013 and working in the field of medical imaging since then. He is currently pursuing a doctoral degree in medical physics at the University of Wisconsin Madison. His research interests include CT applications for vascular, abdominal and genitourinary imaging, 4D cone-beam CT image reconstruction and radiation dose reduction.
Ralf Gutjahr received his BSc degree in biomedical engineering in 2012 at the University of Applied Sciences Mannheim and Heidelberg University, his MSc and PhD degrees in computer science at the Technical University of Munich in 2015 and 2018. He joined Siemens Healthcare in 2017 and his research focuses on contrast media innovation, dynamics and optimization from technical-clinical perspective, and development and evaluation of quantitative (multi) material decomposition algorithms in spectral CT.
Andrea Ferrero graduated from the Polytechnic of Turin, Italy, with a degree in physics engineering, followed by a master degree in medical imaging at the Royal Institute of Technology in Stockholm, Sweden, and PhD in biomedical engineering at the University of California, Davis. Currently, he is a clinical medical physics resident in the Department of Radiology at Mayo Clinic, with a research focus on diagnostic and interventional CT imaging.
Ahmed Halaweish received his BS degree in electrical engineering in 2005 from South Dakota State University, his PhD in biomedical engineering from the University of Iowa in 2011, and he completed his postdoctoral research fellowship at Duke University School of Medicine | Radiology in 2013. He is currently a staff scientist and R&D collaborations manager for the computed tomography division of Siemens Healthineers. His research interests include preclinical and clinical multimodality CT and MR imaging.
Steffen Kappler received his diploma and PhD in physics from Karlsruhe University, Germany, in 2000 and 2004, respectively. He worked as an assistant lecturer for RWTH Aachen, Germany, from 2005 to 2007. During this time he was a visiting researcher at CERN, Switzerland and FNAL, USA. He joined SIEMENS Healthcare in 2007, where he is responsible for CT technology management. His research interests include detector physics and image reconstruction with special focus on photon counting CT.
Cynthia McCollough is a professor of radiological physics and biomedical engineering at Mayo Clinic, where she directs the CT Clinical Innovation Center. Her research interests include CT dosimetry, advanced CT technology, and new clinical applications, such as dual-energy and multispectral CT. She is an NIH-funded investigator and is active in numerous professional organizations. She is a fellow of the AAPM and ACR. She received her doctorate from the University of Wisconsin in 1991.
Shuai Leng received his BS degree in engineering physics in 2001, his MS degree in engineering physics in 2003, from Tsinghua University, and his PhD in medical physics in 2008 from the University of Wisconsin, Madison. She is an associate professor of medical physics at the Mayo Clinic in Rochester, Minnesota, USA. She has authored over 100 peer-reviewed articles. His research interest is technical development and clinical application of x-ray and CT imaging.
Disclosures
R. Gutjahr, A. Halawiesh, and S. Kappler are employees of Siemens Healthcare. C. McCollough receives industry funding from Siemens Healthcare. No other authors have interests to disclose.
References
- 1.Siegel R. L., Miller K. D., Jemal A., “Cancer statistics, 2016,” CA: Cancer J. Clin. 66(1), 7–30 (2016). 10.3322/caac.21332 [DOI] [PubMed] [Google Scholar]
- 2.Kohler B. A., et al. , “Annual report to the nation on the status of cancer, 1975-2011, featuring incidence of breast cancer subtypes by race/ethnicity, poverty, and state,” J. Natl. Cancer Inst. 107(6), djv048 (2015). 10.1093/jnci/djv048 [DOI] [PMC free article] [PubMed] [Google Scholar]
- 3.Henschke C. I., et al. , “Early lung cancer action project: overall design and findings from baseline screening,” Lancet 354(9173), 99–105 (1999). 10.1016/S0140-6736(99)06093-6 [DOI] [PubMed] [Google Scholar]
- 4.Pastorino U., et al. , “Early lung-cancer detection with spiral CT and positron emission tomography in heavy smokers: 2-year results,” Lancet 362(9384), 593–597 (2003). 10.1016/S0140-6736(03)14188-8 [DOI] [PubMed] [Google Scholar]
- 5.Church T. R., et al. , “Results of initial low-dose computed tomographic screening for lung cancer,” N. Engl. J. Med. 368(21), 1980–1991 (2013). 10.1056/NEJMoa1209120 [DOI] [PMC free article] [PubMed] [Google Scholar]
- 6.Lillington G. A., Caskey C. I., “Evaluation and management of solitary and multiple pulmonary nodules,” Clin. Chest Med. 14(1), 111–119 (1993). [PubMed] [Google Scholar]
- 7.Xu D. M., et al. , “Limited value of shape, margin and CT density in the discrimination between benign and malignant screen detected solid pulmonary nodules of the NELSON trial,” Eur. J. Radiol. 68(2), 347–352 (2008). 10.1016/j.ejrad.2007.08.027 [DOI] [PubMed] [Google Scholar]
- 8.Yankelevitz D. F., et al. , “Small pulmonary nodules: evaluation with repeat CT–preliminary experience,” Radiology, 212(2), 561–566 (1999). 10.1148/radiology.212.2.r99au33561 [DOI] [PubMed] [Google Scholar]
- 9.Kappler S., et al. , “Photon counting CT at elevated X-ray tube currents: contrast stability, image noise and multi-energy performance,” Proc. SPIE 9033, 90331C (2014). 10.1117/12.2043511 [DOI] [Google Scholar]
- 10.Kappler S., et al. , “A research prototype system for quantum-counting clinical CT,” Proc. SPIE 7622, 76221Z (2010). 10.1117/12.844238 [DOI] [Google Scholar]
- 11.Kappler S., et al. , “First results from a hybrid prototype CT scanner for exploring benefits of quantum-counting in clinical CT,” Proc. SPIE 8313, 83130X (2012). 10.1117/12.911295 [DOI] [Google Scholar]
- 12.Shikhaliev P. M., “Energy-resolved computed tomography: first experimental results,” Phys. Med. Biol. 53(20), 5595–5613 (2008). 10.1088/0031-9155/53/20/002 [DOI] [PubMed] [Google Scholar]
- 13.Shikhaliev P. M., “Computed tomography with energy-resolved detection: a feasibility study,” Phys. Med. Biol. 53(5), 1475–1495 (2008). 10.1088/0031-9155/53/5/020 [DOI] [PubMed] [Google Scholar]
- 14.Iwanczyk J. S., et al. , “Photon counting energy dispersive detector arrays for x-ray imaging,” IEEE Trans. Nucl. Sci. 56(3), 535–542 (2009). 10.1109/TNS.2009.2013709 [DOI] [PMC free article] [PubMed] [Google Scholar]
- 15.Persson M., et al. , “Energy-resolved CT imaging with a photon-counting silicon-strip detector,” Phys. Med. Biol. 59(22), 6709–6727 (2014). 10.1088/0022-3727/59/22/6709 [DOI] [PubMed] [Google Scholar]
- 16.Yu Z., et al. , “Evaluation of conventional imaging performance in a research whole-body CT system with a photon-counting detector array,” Phys. Med. Biol. 61(4), 1572–1595 (2016). 10.1088/0031-9155/61/4/1572 [DOI] [PMC free article] [PubMed] [Google Scholar]
- 17.Gutjahr R., et al. , “Human imaging with photon counting-based computed tomography at clinical dose levels: contrast-to-noise ratio and cadaver studies,” Invest. Radiol. 51(7), 421–429 (2016). 10.1097/RLI.0000000000000251 [DOI] [PMC free article] [PubMed] [Google Scholar]
- 18.Leng S., et al. , “Dose-efficient ultrahigh-resolution scan mode using a photon counting detector computed tomography system,” J. Med. Imaging 3(4), 043504 (2016). 10.1117/1.JMI.3.4.043504 [DOI] [PMC free article] [PubMed] [Google Scholar]
- 19.Jorgensen S. M., et al. , “Arterial wall perfusion measured with photon counting spectral x-ray CT,” Proc. SPIE 9967, 99670B (2016). 10.1117/12.2238817 [DOI] [PMC free article] [PubMed] [Google Scholar]
- 20.Shikhaliev P. M., Fritz S. G., “Photon counting spectral CT versus conventional CT: comparative evaluation for breast imaging application,” Phys. Med. Biol. 56(7), 1905–1930 (2011). 10.1088/0031-9155/56/7/001 [DOI] [PubMed] [Google Scholar]
- 21.Yu Z., et al. , “Initial results from a prototype whole-body photon-counting computed tomography system,” Proc. SPIE 9412, 94120W (2015). 10.1117/12.2082739 [DOI] [PMC free article] [PubMed] [Google Scholar]
- 22.Li Q., et al. , “A micro CT based tumor volume reference standard for phantom experiments,” in Imaging and Applied Optics, OSA Technical Digest (online) (2013). [Google Scholar]
- 23.Duan X., et al. , “Differentiation of calcium oxalate monohydrate and calcium oxalate dihydrate stones using quantitative morphological information from micro-computerized and clinical computerized tomography,” J. Urol. 189(6), 2350–2356 (2013). 10.1016/j.juro.2012.11.004 [DOI] [PMC free article] [PubMed] [Google Scholar]
- 24.Li Q., et al. , “Statistical analysis of lung nodule volume measurements with CT in a large-scale phantom study,” Med. Phys. 42(7), 3932–3947 (2015). 10.1118/1.4921734 [DOI] [PMC free article] [PubMed] [Google Scholar]
- 25.Chen B., et al. , “Quantitative CT: technique dependence of volume estimation on pulmonary nodules,” Phys. Med. Biol. 57(5), 1335–1348 (2012). 10.1088/0031-9155/57/5/1335 [DOI] [PubMed] [Google Scholar]
- 26.Koenig T., et al. , “How spectroscopic x-ray imaging benefits from inter-pixel communication,” Phys. Med. Biol. 59(20), 6195–6213 (2014). 10.1088/0031-9155/59/20/6195 [DOI] [PubMed] [Google Scholar]
- 27.Kostis W. J., et al. , “Small pulmonary nodules: reproducibility of three-dimensional volumetric measurement and estimation of time to follow-up CT,” Radiology 231(2), 446–452 (2004). 10.1148/radiol.2312030553 [DOI] [PubMed] [Google Scholar]
- 28.Baldwin D. R., et al. , “Pulmonary nodules again? The 2015 British Thoracic Society guidelines on the investigation and management of pulmonary nodules,” Clin. Radiol. 71(1), 18–22 (2016). 10.1016/j.crad.2015.10.017 [DOI] [PubMed] [Google Scholar]
- 29.MacMahon H., et al. , “Guidelines for management of incidental pulmonary nodules detected on CT images: from the Fleischner Society 2017,” Radiology 284, 161659 (2017). 10.1148/radiol.2017161659 [DOI] [PubMed] [Google Scholar]
- 30.Winer-Muram H. T., “The solitary pulmonary nodule,” Radiology 239(1), 34–49 (2006). 10.1148/radiol.2391050343 [DOI] [PubMed] [Google Scholar]
- 31.Yankelevitz D. F., et al. , “Small pulmonary nodules: volumetrically determined growth rates based on CT evaluation,” Radiology 217(1), 251–256 (2000). 10.1148/radiology.217.1.r00oc33251 [DOI] [PubMed] [Google Scholar]


