

Abstract
Background
Conserved domains in proteins have crucial roles in protein interactions, DNA binding, enzyme activity and other important cellular processes. It will be of interest to determine the proportions of genes containing such domains in the proteomes of different eukaryotes.
Results
The average proportion of conserved domains in each of five eukaryote genomes was calculated. In pairwise genome comparisons, the ratio of genes containing a given conserved domain in the two genomes on average reflected the ratio of the predicted total gene numbers of the two genomes. These ratios have been verified using a repository of databases and one of its subdivisions of conserved domains.
Conclusions
Many conserved domains occur as a constant proportion of proteome size across the five sequenced eukaryotic genomes. This raises the possibility that this proportion is maintained because of functional constraints on interacting domains. The universality of the ratio in the five eukaryotic genomes attests to its potential importance.
Background
Conserved domains in proteins have crucial roles in protein interactions, DNA binding, enzyme activity and other important cellular processes. With recently released predictions of the number of genes in the human genome [1,2] being less than many previous predictions, interactions among protein domains may prove to be central to proteome complexity. Protein domains are often conserved across many species and, as such, they offer an interesting dataset for analyzing how genomes maintain any given domain in relation to other conserved domains, as well as for analyzing the relationship of conserved domain occurrence to proteome size. Many groups have attempted to find, document and annotate these conserved domains. Whereas most groups use a form of hidden Markov models [3,4] for profiling, each group approaches the problem in a unique way, yielding a wide range of databases that can be used to verify each other.
For this study I used the SMART CD database [5,6,7] to collect data on the number of genes containing each conserved domain in each genome. The study was restricted to the five eukaryote genomes sequenced so far: Homo sapiens, Drosophila melanogaster, Arabidopsis thaliana, Caenorhabditis elegans and Saccharomyces cerevisiae. Results were confirmed using a repository of databases called the Proteome Analysis Database [8,9] (abbreviated here as PAD). PAD contains SMART CD among seven other databases [9]. In each case studies were limited to those conserved domains occurring at least once in all five genomes.
It has been possible to compare conserved domains across different genomes, and to validate the approach by using a repository of databases (PAD) and one database from this group (SMART). A close link is revealed between numbers of genes with a given conserved domain and the total number of genes in each genome.
Results and discussion
Data were gathered as follows: a PERL script was written to submit requests to the SMART database [7] for the number of genes with each of 519 conserved domains in each genome. Information in PAD [9] is already in genome-specific columns for the 200 most frequent conserved domains in humans and was downloaded directly. The information was parsed and stored for each genome. From the SMART database, 211 conserved domains were selected on the basis of the fact that they occurred at least once in each of the five genomes (see Additional data files). From PAD, 122 conserved domains were selected on the basis of the fact that they occurred at least once in each of the five genomes (see Additional data files).
My initial observation was that for many conserved domains, the ratio of the sum of genes in genome 1 containing the conserved domain to the total number of predicted genes in genome 1 was proportional to the ratio of the sum of genes in genome 2 containing the conserved domain to the total number of predicted genes in genome 2.
Given that: A = sum of proteins with given conserved domain (CD) in genome 1; B= sum of proteins with given CD in genome 2; E= sum of predicted genes in genome 1; F= sum of predicted genes in genome 2, then on average:
A/E ≈ B/F (1)
Upon rearranging Equation 1, it was noted that for many conserved domains the ratio of the number of genes containing the given conserved domain in each genome accurately reflected the ratio of the total predicted number of genes ach genome. Or, given the variables in Equation 1, then on average:
A/B ≈ E/F (2)
To normalize the data I used a ratio of the sum genes with a given conserved domain in a genome to the sum genes with the given conserved domain in all five genomes. This was used to minimize the effect that the predicted number of genes may be significantly wrong for one of the genomes whereas the others may be more accurate. Equation 1 was rewritten to reflect this normalization. Given that A= sum proteins with given CD in genome 1; G= sum proteins with given CD in five genomes; E = sum predicted genes in genome 1; H= sum predicted genes for all five genomes, then on average:
A/G ≈ E/H (3)
The sums of conserved domains in each Equation 3 ratio range were depicted graphically for each genome, and are displayed in Figure 1 (SMART database) and Figure 2 (PAD). The average ratio for each genome was calculated and multiplied against the sum predicted genes of all five genomes, yielding a number close to the number of predicted genes in each respective genome (Table 1).
Figure 1.
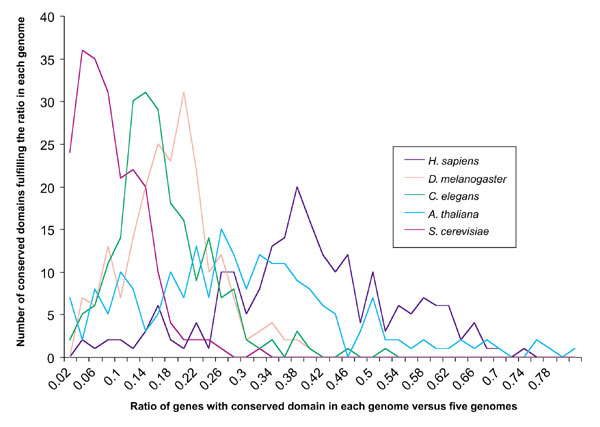
Sum of conserved domains (CDs) in each ratio range of CDs in a genome (see Equation 3) compared to their occurrence in all five genomes (211 CDs considered). Data from the SMART database was used. Equation 3 was used for all CDs for each genome. The number of CDs in each ratio range for each genome was summed and graphed. The sum of all predicted genes for the five genomes was 100,500. It is apparent that the number of CDs peaks at a particular ratio for each genome, with an average near the respective proteome size (multiply average ratio for each genome by 100,500 as in Table 1).
Figure 2.
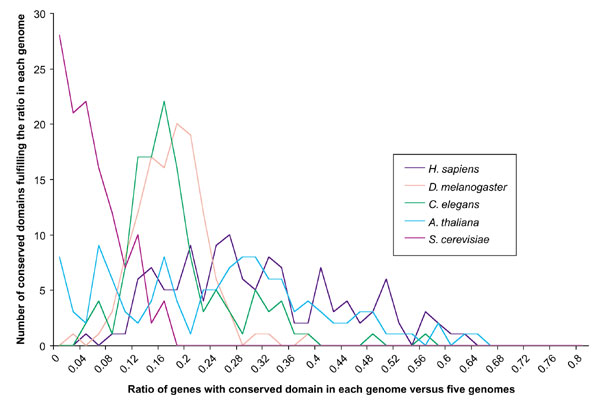
Sum of CDs in each ratio range of CDs in a genome (see Equation 3) compared to their occurrence in all five genomes (122 CDs considered). Data from PAD was used. Equation 3 was used for all CDs for each genome. The number of CDs in each ratio range for each genome was summed and graphed. The sum of all predicted genes for the five genomes was 100,500. It is apparent that the number of CDs peaks at a particular ratio for each genome, with an average near the respective proteome size (multiply average ratio for each genome by 100,500 as in Table 1). Compare the results of the five genomes here with those in Figure 1.
Table 1.
Relationship of ratios of conserved domains to predicted number of genes in genome
| SMART database | Proteome Analysis Database | ||||||
| Organism | Average ratio of genes genes with CD in organism to total genes with CD in the five species | Sum of predicted genes for all five species | Product | Average ratio of genes genes with CD in organism to total genes with CD in the five species | Sum of predicted genes for all five species | Product | Predicted number of genes in genome |
| H. sapiens | 0.386 | 100,500 | 38,793 | 0.314 | 100,500 | 31,557 | 35,000 |
| D. melanogaster | 0.172 | 100,500 | 17,286 | 0.185 | 100,500 | 18,592.5 | 14,100 |
| A. thaliana | 0.283 | 100,500 | 28,441.5 | 0.252 | 100,500 | 25,326 | 26,000 |
| C. elegans | 0.158 | 100,500 | 15,879 | 0.191 | 100,500 | 19,195.5 | 19,100 |
| S. cerevisiae | 0.076 | 100,500 | 7,638 | 0.058 | 100,500 | 5,829 | 6,300 |
Equation 2 could be used to predict total genes in a genome given that the other variables are reasonably well known, such as from expressed sequence tag (EST) data. More important, this suggests the possibility that these conserved domains are maintained in this ratio as a result of functional constraints on interacting domains. The fact that this ratio is maintained fairly well in all five eukaryotic genomes attests to its potential importance.
Although there is much disagreement on the total number of genes for the different genomes, similar gene-finding methods were used for each of the five published eukaryotic genomes. It can therefore be assumed that ratios of predicted genes between the genomes will remain similar to present ratios, as the gene numbers for each genome are clarified. Likewise, neither SMART nor PAD claim to have found all occurrences of each conserved domain in each genome. However, because of similar strategies used for finding conserved domains in different genomes within each database, the ratio of total genes found with a given conserved domain in each genome is likely to remain near constant as gene prediction improves.
An interesting finding from this research was that while the ratios for H. sapiens, A. thaliana, and S. cerevisiae related closely to the total predicted genes for each organism, both databases gave a peak ratio that exchanged total predicted gene numbers between D. melanogaster and C. elegans (Figures 1,2). From Figure 2 it can be seen that it is outlying conserved domain ratios that cause the average in Table 1 to be shifted closer to actual predicted total gene numbers for C. elegans. While this exchange cannot be explained at present, it may offer insights into the distinctions between the genomes, and genes that remain unidentified. It is important to note that by mainly analyzing conserved domains occurring most frequently, conserved domains that occur only once in each genome are, for the most part, excluded from the analysis.
It has been shown that conserved domains in proteins are maintained in proteome-specific ratio for the five eukaryotic genomes sequenced so far. The reasons for this ratio are unclear, but it would not be unreasonable to suspect that the functional interactions of these protein domains require that they be kept in a specific ratio. Further research may reveal that conserved domains outside of this ratio are critical to the organism's unique functions, and will be necessary to understand the reasons for, and universality of this ratio in eukaryotic genomes.
Materials and methods
The SMART database was searched for conserved domains occurring at least once in each of the five genomes [7]. For PAD the search was restricted to those conserved domains listed in the top 200 domains occurring in humans for which there was at least one occurrence in each of the four other genomes [9]. This strategy of limiting the study to more global conserved domains was used to increase the chance that the conserved domains were constructed correctly and to increase the statistical reliability of the results.
The total number of predicted genes for each genome was as follows: H. sapiens, 35,000 [1,2]; D. melanogaster, 14,100 [10,11]; A. thaliana, 26,000 [12,13,14]; C. elegans, 19,100 [15,16]; S. cerevisiae, 6,300 [17]. This yielded a total of 100,500 genes for all five genomes, and a total of 39,500 for D. melanogaster, C. elegans, and S. cerevisiae alone. The number of genes in each genome is approximate because it is an estimate that is continually being updated [13].
Additional data files
SMART_CDs.txt is a text, tab-delimited file containing all 211 conserved domain names from the SMART database used in this study. For each conserved domain name, the corresponding number of genes containing the conserved domain in each genome is listed. PAD_CDs.txt is a text, tab-delimited file containing all 122 InterPro entry numbers for the domains in PAD used in this study. For each InterPro entry number, the corresponding number of genes containing the conserved domain in each genome is listed.
Supplementary Material
SMART_CDs - a text, tab-delimited file containing all 211 conserved domain names from the SMART database used in this study.
PAD_CDs - a text, tab-delimited file containing all 122 InterPro entry numbers for the domains in PAD used in this study.
Acknowledgments
Acknowledgements
I thank those at TIGR who reviewed the ideas presented here and B. Parvizi and J. Vamathevan for help with the writing and analysis. Thank you to S. Malek for critical review of the manuscript.
References
- Venter JC, Adams MD, Myers EW, Li PW, Mural RJ, Sutton GG, Smith HO, Yandell M, Evans CA, Holt RA, et al. The sequence of the human genome. Science. 2001;291:1304–1351. doi: 10.1126/science.1058040. [DOI] [PubMed] [Google Scholar]
- International Human Genome Sequencing Consortium Initial sequencing and analysis of the human genome. Nature. 2001;409:860–921. doi: 10.1038/35057062. [DOI] [PubMed] [Google Scholar]
- Sonnhammer EL, Eddy SR, Birney E, Bateman A, Durbin R. Pfam: multiple sequence alignments and HMM-profiles of protein domains. Nucleic Acids Res. 1998;26:320–322. doi: 10.1093/nar/26.1.320. [DOI] [PMC free article] [PubMed] [Google Scholar]
- Eddy SR, Mitchison G, Durbin R. Maximum discrimination hidden Markov models of sequence consensus. J Comput Biol. 1995;2:9–23. doi: 10.1089/cmb.1995.2.9. [DOI] [PubMed] [Google Scholar]
- Schultz J, Copley RR, Doerks T, Ponting CP, Bork P. SMART: a web-based tool for the study of genetically mobile domains. Nucleic Acids Res. 2000;28:231–234. doi: 10.1093/nar/28.1.231. [DOI] [PMC free article] [PubMed] [Google Scholar]
- Schultz J, Milpetz F, Bork P, Ponting CP. SMART, a simple modular architecture research tool: identification of signaling domains. Proc Natl Acad Sci USA. 1998;95:5857–5864. doi: 10.1073/pnas.95.11.5857. [DOI] [PMC free article] [PubMed] [Google Scholar]
- SMART - Simple Modular Architecture Research Tool http://smart.embl-heidelberg.de [DOI] [PMC free article] [PubMed]
- Apweiler R, Biswas M, Fleischmann W, Kanapin A, Karavidopoulou Y, Kersey P, Kriventseva EV, Mittard V, Mulder N, Phan I, Zdobnov E. Proteome Analysis Database: online application of InterPro and CluSTr for the functional classification of proteins in whole genomes. Nucleic Acids Res. 2001;29:44–48. doi: 10.1093/nar/29.1.44. [DOI] [PMC free article] [PubMed] [Google Scholar]
- Proteome Analysis Database http://www.ebi.ac.uk/proteome/HUMAN/interpro/comparison/top200.html
- Adams MD, Celniker SE, Holt RA, Evans CA, Gocayne JD, Amanatides PG, Scherer SE, Li PW, Hoskins RA, Galle RF, et al. The genome sequence of Drosophila melanogaster. Science. 2000;287:2185–2195. doi: 10.1126/science.287.5461.2185. [DOI] [PubMed] [Google Scholar]
- Berkeley Drosophila Genome Project http://www.fruitfly.org/sequence/download.html
- The Arabidopsis Information Resource http://www.arabidopsis.org/
- The Arabidopsis Genome Initiative Analysis of the genome sequence of the flowering plant Arabidopsis thaliana. Nature. 2000;408:796–815. doi: 10.1038/35048692. [DOI] [PubMed] [Google Scholar]
- Riechmann JL, Heard J, Martin G, Reuber L, Jiang C, Keddie J, Adam L, Pineda O, Ratcliffe OJ, Samaha RR, et al. Arabidopsis transcription factors: genome-wide comparative analysis among eukaryotes. Science. 2000;290:2105–2110. doi: 10.1126/science.290.5499.2105. [DOI] [PubMed] [Google Scholar]
- The C. elegans Protein Database Wormpep http://www.sanger.ac.uk/Projects/C_elegans/wormpep
- The C. elegans Sequencing Consortium Genome sequence of the nematode C. elegans: a platform for investigating biology. Science. 1998;282:2012–2018. doi: 10.1126/science.282.5396.2012. [DOI] [PubMed] [Google Scholar]
- Saccharomyces Genome Database http://genome-www.stanford.edu/Saccharomyces/
Associated Data
This section collects any data citations, data availability statements, or supplementary materials included in this article.
Supplementary Materials
SMART_CDs - a text, tab-delimited file containing all 211 conserved domain names from the SMART database used in this study.
PAD_CDs - a text, tab-delimited file containing all 122 InterPro entry numbers for the domains in PAD used in this study.