

Abstract
High-resolution magic angle spinning (HRMAS) magnetic resonance spectroscopy (MRS) is a powerful method for gaining insight into the physiological and pathological processes of cellular metabolism. Given its ability to obtain high resolution spectra of non-liquid biological samples, while preserving tissue architecture for subsequent histopathological analysis, the technique has become invaluable for biochemical and biomedical studies. Using HRMAS MRS, alterations in measured metabolites, metabolic ratios, and metabolomic profiles present the possibility to improve identification and prognostication of various diseases and decipher the metabolomic impact of drug therapies. In this review, we evaluate HRMAS MRS results on human tissue specimens from malignancies and non-localized diseases reported in the literature since the inception of the technique in 1996. We present the diverse applications of the technique in understanding pathological processes of different anatomical origins, correlations with in vivo imaging, effectiveness of therapies, and progress in the HRMAS methodology.
Keywords: metabolomics, high-resolution magic angle spinning (HRMAS), magnetic resonance spectroscopy (MRS), human tissue
Graphical Abstract
High resolution magic angle spinning (HRMAS) magnetic resonance spectroscopy (MRS) is a method which enhances resolution for non-liquid biological samples. Since its introduction in 1996, HRMAS has been used in a wide variety of biomedical and biochemical studies and is one of the major techniques used in metabolomic analysis. In this review, HRMAS results on human tissue malignancies and non-localized diseases are evaluated, with discussions of applications for understanding pathological processes, correlations with in vivo imaging, therapy effectiveness, and methodology progress.
Introduction
The utility of magnetic resonance spectroscopy (MRS) as a medical diagnostic, prognostic and therapeutic evaluation tool for a wide range of diseases has been well investigated. MRS, particularly high-resolution magic angle spinning (HRMAS) MRS, has demonstrated its ability for direct measurement of non-liquid biological tissue to obtain valuable insight into cellular metabolism of physiological and pathological processes of human diseases, as well as into experimental models of animals and cell-lines of these medical conditions.
In this article, we aim to comprehensively review HRMAS MRS for its applications in ex vivo studies of diseased human tissue specimens published prior to the end of 2016. Hereinafter, we narrowly define human studies as direct HRMAS MRS measurements of human tissue specimens, not including animal and cell-line studies of human disease models, as they were reviewed in a separate article1.
HRMAS MRS observable tissue spectra present mostly cellular metabolites and mobile lipids. Metabolites are the signatures of biochemical pathways, through which the processes of cellular carbohydrate, protein, lipid, amino acid and xenobiotic metabolism may be probed. The ability of MRS to explore the metabolic status can help elucidate the physiological and pathological transformations accompanying various medical conditions; it can provide a detailed account of metabolic mechanisms at cellular levels2–4. Review of the published HRMAS MRS studies on human disease emphasizes the utility of the technique especially in understanding human malignancies. Cancer presents identifiable lesions, which enables clear comparison of metabolites from affected and not affected tissue from the same patient. For non-malignant medical conditions, metabolite investigation is more complicated. Disease and control tissues must be obtained from different individuals, presenting bio-variation as a confounding factor. Therefore, the large body of HRMAS MRS research is skewed towards cancer, but we will balance our presentation with critical reviews of other non-localized diseases.
Applications of HRMAS MRS on studies of human malignant diseases
Publications of HRMAS MRS human studies on cancers revealed areas of research emphases that reflect either the prevalence of diseases seen in clinic or the technical advancement achieved with clinical MRS. This review analyzed over 100 studies using HRMAS MRS, including brain tumors (41 papers), breast cancer (21), prostate cancer (19), cervical cancer (9), gastrointestinal tumors (9), lung cancer (5) and renal cancer (4). Cancers are highly variable as far as patient prognostication is concerned. The major aims of these studies, in addition to providing metabolic markers for disease detection and diagnosis, were centered on identification of disease aggressiveness and their response to systemic therapies.
Breast and prostate cancers, as the most frequently diagnosed cancers respectively for women and men, respectively, with 252,710 and 161,360 estimated new cases and accounting for 40,610 and 26,730 estimated deaths in the U.S. in 2017 alone5, have attracted the most attention in research. On the other hand, although tumors of the brain and central nervous system might only present 23,800 new cases and account for 16,700 deaths5, two specific characteristics of the field encouraged researchers to focus on these malignancies: the unparalleled advancement of brain MR techniques (imaging, MRI; functional imaging, fMRI, and MRS) and the vast number of clinical studies reported in the area, due mostly to the relative tissue magnetic susceptibility homogeneity, and minimal respiratory and cardiac motion effects in the brain.
Brain tumors
To structure a large body of publications in this area6–52 into a differentiated review, we will divide this section into three focuses: the correlations between in vivo and ex vivo HRMAS MRS, classification of adult and pediatric CNS tumors, and the relationships between metabolites and histopathological tissue properties. As “brain tumors” refer to a large class of neoplasia including both malignant and non-malignant lesions, we aimed to put the different metabolic findings into the context of the pathologic grading (I–IV) according to the 2016 WHO brain tumor classification53, to reflect the tumor differentiation levels. As the most frequent human brain tumor, most of the research was targeted at gliomas and their subtypes, e.g. astrocytomas and oligodendrogliomas, with the pediatric medulloblastoma also the focus of several studies.
In vivo and ex vivo correlations
While clinical MR investigations on brain tumors have inspired studies of ex vivo HRMAS MRS of tissue specimens to reveal tumor type-specific metabolic structures and pathways, the most significant value of such ex vivo tissue analyses is in improving interpretation of different tumor types, grades, and progression potential for in vivo MRS. A study of 17 human astrocytomas (4 grade II, 1 grade III and 12 grade IV) has shown spectral similarities between in vivo and ex vivo results (Figure 1), and highly significant correlations were found for 8 out of the 13 measured metabolite concentrations, including Creatine (Cr), Glutmate (Glu), Glutamine (Gln), myo-inositol (myo-Ino), N-acetylaspartate (NAA), scyllo-inositol (scy-Ino), total choline (tCho), Glycerophosphocholine (GPC) and Phosphocholine (PCho)) and Lipid/Macromolecule (Lip/MM)26. Similarities between in vivo and ex vivo MRS have also been reported for heterogeneous primary and secondary glioblastomas (GBM)19, as well as for hemangiopericytoma and meningiomas, two less heterogeneous tumor types31.
Figure 1.

In vivo PRESS TE 30 msec spectra (b, e, h) and their equivalent ex vivo HRMAS presaturation spectra (c, f, i) from a histopathologically verified astrocytoma grade II (a–c) and glioblastoma (d–f) showing unimodal variation of the grayscale pixel values in the voxel placement areas (a,d), and a histologically verified glioblastoma with multimodal variation of the grayscale pixel values (g–i). Major peaks of the metabolites discussed have been labeled, but for clarity not all metabolites are labeled in each spectrum (Ala, alanine; Cr, creatine; Gln, glutamine; Glu, glutamate; Glx, [Gln + Glu]; Gly, glycine; Ins, myo-inositol; Lac, lactate; Lip/MM, lipids/macromolecules; Scyllo, scyllo-inositol; Tau, taurine; tCho, total cholines)26.
However, when connecting ex vivo HRMAS with in vivo MRS results, the major difference between the two spectra, due partially to the magnetic field strength difference and the application of HRMAS in the ex vivo measurements, needs to be considered, particularly when concerning the overlap among metabolite signals in the in vivo MRS. For instance, in the last mentioned hemangiopericytoma and meningiomas study, mannitol – a medication used to reduce brain pressure – presented one peak in the 3T in vivo spectrum at 3.8 ppm. However, when measured ex vivo at 9.4T, the HRMAS spectrum showed multiple peaks between 3.6 and 4.0 ppm. This phenomenon is common for overlapping signals of various metabolites, such as for GPC, PCho, and choline (Cho), and Glu and Gln, which leads the former to be assigned as total choline (tCho = GPC+PCho+Cho), and the latter as Glx (Glu+Gln) for in vivo MRS reports26.
Differentiations among individual metabolites can be very important for tumor identification as noted in a comparative study between grade II astrocytomas (n=10) and GBMs (n=48), where PCho is increased in grade II astrocytomas, while GBMs showed increased levels of GPC. In addition, different amounts of GPC were seen to significantly separate primary GBMs from secondary GBMs (p<0.001). Therefore, accurate differentiations between PCho and GPC, rather than considering tCho collectively, may make it possible to distinguish between grade II astrocytomas and GBM and within the GBM subtype40.
In addition to metabolite overlaps, the detection of certain metabolites can also be field strength- and sensitivity-dependent. For instance, alanine (Ala) was detectable in an HRMAS spectrum at 9.4T but not at 3T during in vivo MRS31. Despite these technical challenges, the trend of increasing magnetic field strength of clinical MRI scanners means the clinical translation of HRMAS MRS findings is increasingly possible. Currently, HRMAS MRS is highly suitable to tackle another task that presents challenges in the clinical setting: analysis of tissue metabolic structures to characterize and distinguish brain tumor types and grades.
Differentiations of tumor types and grades for adult and pediatric brain cancer
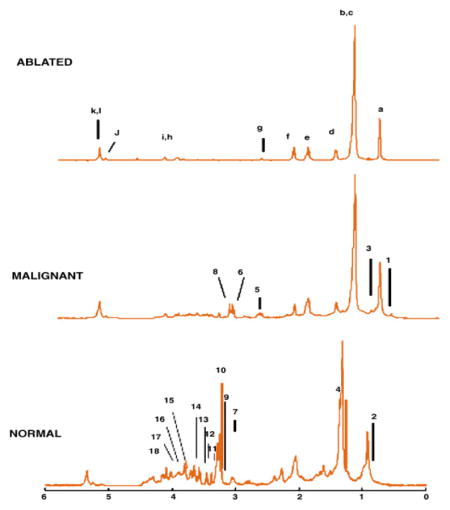
Due to significant clinical impact, gliomas have been a primary focus of research in the recent years. In 2010, an HRMAS MRS study of 30 neuroepithelial brain cancer specimens showed that certain metabolic changes are directly or inversely related to tumor grades (Figure 2). Specifically, in high grade tumors (grade III–IV), taurine (Tau), glycine (Gly) and aspartate (Asp) increases and Cr, myo-Ino, GPC, PCho decreases were observed. Furthermore, lipids and Ala were higher in grade II and III astrocytomas than in grade I. For grade III astrocytoma, NAA, Cr, myo-Ino (all p<0.01) were lower than in grades I and II astrocytomas, whereas Gly (p<0.05) was higher. GBM spectra were mostly characterized by lower Lac, Cr, and myo-Ino (all p<0.05) than in grades I–III astrocytomas. To distinguish grade III astrocytomas from GBM, GPC (n.s.), Cho (n.s.), lactate (Lac) (p<0.05) and Cr (p<0.001) are found in higher levels in the former. In contrast, myo-Ino (p<0.001) and PCho (n.s.) are lower in grade III. The changes in the following five metabolites were in agreement with other in vivo studies: Gly, NAA, Lac, Cr, and myo-Ino8. A summarizing table of reported brain tumor HRMAS MRS measurable metabolite changes from this and other reviewed references will be provided later in this section.
Figure 2.

HR-MAS 1H NMR spectra of six brain specimens acquired from CPMG pulse sequence at a spin rate of 2 kHz. (A) Normal Tissue, (B) Astrocytoma (grade I), (C) Astrocytoma (grade II), (D) Astrocytoma, (E) Glioblastoma (grade IV), (F) Medulloblastoma (grade IV)8.
In another study, metabolic differences between grade II astrocytomas (n=10) and GBMs (n=48) were investigated using multivariate and principal component analysis (PCA). GBMs showed increased lipids and decreased GPC levels than grade II astrocytomas, which accords with previous research, in addition to harboring higher PCho and Gly and lower myo-Ino. The prediction model showed a sensitivity of 70% and a specificity of 88% in discriminating grade II from GBMs. As previously described, primary and secondary GBMs can be differentiated by PCho, with recurrent GBM (n=17 out of the 48) having lower amounts of this metabolite40.
Gliomas tend to not only recur but also transform to a higher grade, so biomarkers that can identify these types can be crucial in the clinic. Differentiation between grade II gliomas that underwent malignant transformation to a higher grade vs. those that remained grade II was evaluated for 53 recurrent grade II gliomas. Myo-Ino levels were 56% lower in gliomas that underwent progression than those that remained low grade, while 2-hydroxyglutarate (2HG) (2.24 – 2.30 ppm), hyp-Tau (2.62–2.69 ppm), and Cho (3.21–3.29 ppm) had up to 120%, 137%, and 83% higher levels in the progressive gliomas. Higher levels in this group were also detected for lipids, gluthathione (GSH) and Ala. Particularly, myo-Ino was proposed as a key metabolite of discriminative strength. Combined with other presented metabolic information, it assisted in reaching 96% accuracy in identifying tumor progression10.
Later in 2014, a larger study with 254 samples from 126 patients with either primary or secondary and new or recurrent gliomas was reported. Comparison between primary GBMs (n= 101) and secondary GBMs (ntotal=33, grade II → grade IV: 19, grade III → IV: 14) found that tCho, 2HG and Asp were significantly higher in the grade II → IV cases than in primary GBMs (all p<0.005). In addition, classification models could separate primary from secondary GBMs with very high accuracy, scoring 94% between grade II → IV and 96% between grade III → IV, with 2HG being the most important parameter. Separating these types is vital since GBMs with transformative potential need more aggressive treatment than de novo GBMs46–48,51. Primary grade II and grade III astrocytomas could be separated from primary GBMs with higher 2HG levels for the astrocytomas. Additionally, a higher myo-Ino/tCho ratio and a lower total glutathione (tGSH = reduced glutathione + disulfide form) level were present in grade II tumors vs. GBMs, and higher levels of tCho, 2HG, NAA, Cr/phosphocreatine (PCr) ratio existed for the grade III to enable separation from the GBMs. Astrocytomas themselves could be separated with a higher myo-Ino/tCho ratio, together with lower levels of Gly and phosphoethanolamine (PE), distinguishing primary grade II from primary grade III anaplastic astrocytomas with 73% accuracy15.
The tumor-promoting onco-metabolite 2HG52, as an important discrimination marker for gliomas, was found to be significantly correlated with a number of other metabolites in a 2009 study. Positive correlations were reported for fifteen metabolites [PCho, GPC, tCho, Cr, phosphocreatine (PCr), PE, GSH, Glu, Gln, gamma-aminobutyric acid (GABA), Ala, Gly, betaine (Bet), hypo-taurine (hyp-Tau), and Lac], and 2HG was negatively correlated with the myo-Ino/tCho ratio (all p<0.05). Choline-containing compounds (ChoCC) are widely used as an in vivo MRS marker for tumor presence and increased levels of many other metabolites, so 2HG could be an added marker. It could also contribute additional prognostic information in the clinical setting. For example, glioma patients with an IDH1 or IDH2 gene mutation present more favorable prognoses (higher 5-year survival rate) and accumulate higher amounts of 2HG52. Considering the resonance overlaps between 2HG and other metabolites at clinical field strengths14, ex vivo MRS identification of this relationship is critical. Positively, other findings suggest that 2HG can be identified clinically by using 1D spectral-editing with a localized 2D correlation7.
HRMAS MRS results have also been supported by genomic analyses. In a study of 9 grade II, 6 grade III, 8 grade IV astrocytomas and 3 normal tissue specimens, as expected, results found that NAA and GABA, two important neuronal markers, were decreased in glioma tissues as compared to normal tissue. Using higher GPC/tCho ratio in low grade (II) tumors, the latter can be correctly separated from high grade (III and IV) tumors in 22 out of 23 cases (95% accuracy), suggesting GPC as the main component in low grade tumors and PCho as a signature Cho derivate in high grade glioma. Genomic results further supported the purported rise in PCho by demonstrating an increase in the gene expressions of choline kinase α and phospholipase C29.
Whereas most HRMAS MRS research on malignant disease focuses on adults, research on brain malignancies extends to pediatric studies. One of the most common malignant CNS tumors in children is the medulloblastoma49,50, which is a high grade (WHO grade IV) tumor with an overall poor prognosis. A cohort of 35 cerebellar childhood tumors (18 medulloblastomas, 12 pilocytic astrocytomas and 5 ependymomas), were studied, with separation possible between all three tumor types. High levels of PCho and Glu as well as low Gln levels characterized medulloblastomas. These tumors also had high Tau, MM/Lipids and Ala levels. Alterations in NAA, Cr and myo-Ino can be used to distinguish ependymomas from pilocytic astrocytomas, with NAA detectable in astrocytomas, but not in ependymomas or medulloblastomas. Higher Cr levels are found in ependymomas (Figure 3)12.
Figure 3.

Mean spectra for (a) astrocytomas (n=12), (b) ependymomas (n=4), (c) medulloblastomas (n=18) and (d) controls (n=4) with 95% confidence intervals indicated by the shaded region12.
In a follow-up study, Gly was validated as an in vivo marker for high grade childhood brain tumors. Looking at 15 tissue samples (high grade: 8 medulloblastomas, 1 anaplastic ependymoma; low grade: 5 pilocytotic astrocytomas, 1 ependymoma), the study showed a significant relation between the normalized Gly concentration measured with short echo time for in vivo MRS and the Gly levels of the corresponding samples examined with HRMAS (p<0.05). High grade tumors showed higher Gly (p<0.05) when compared to the low grade group13.
Results from analyses of 29 childhood brain tumors with PCA and linear discriminant analysis (LDA) agreed that different tumor types possess clear metabolomic fingerprints of significant changes for glial tumors (10 pilocytic astrocytomas and 2 ependymomas) vs. primitive neuroectodermal tumors (PNETs) (9 medulloblastomas, 7 neuroblastomas and 1 supratentorial PNET) (p<0.05)41. Glial tumors displayed higher levels of Cr and Glu and lower levels of Tau, Cho, PCho and PE when compared to PNETs, with 90% classification accuracy. Within the group of PNETs, differentiation of just medulloblastomas and neuroblastomas was feasible with 94% accuracy, as medulloblastomas show higher Cr, Gly, Glu, PCho and scy-Ino (p<0.05)41.
Metabolites and histopathological tissue properties
In addition to distinguishing among different brain tumor types and grades, HRMAS MRS has also been used to measure correlations between tissue histopathological features and metabolic properties.
Micro-heterogeneity of brain tumors is common in neuropathology, especially in high grade tumors. It complicates tumor biopsy grading and hinders correlations between metabolic changes and pathological features. Tissue HRMAS MRS can help uncover these correlations. In 2000, very soon after the invention of intact tissue HRMAS MRS, this capability was demonstrated by a study of multiple tissue specimens obtained from a 44-year old GBM patient. The specimens were first measured by ex vivo HRMAS MRS and then underwent quantitative histopathological analysis. Highly significant positive correlations between the amount of necrosis in the specimen and Lac (p<0.032, R2= 0.939) as well as lipids (p<0.02, R2= 0.961) were found. Additionally, the amount of glioma was clearly related to an increasing PCho/Cho ratio (p<0.033, R2= 0.936)45. In addition to uncovering relationships between metabolites and brain tumor pathologies, this study, for the first time, demonstrated the critical advantage of HRMAS MRS in enabling both high resolution tissue metabolic quantifications and histopathology evaluations of the same tissue specimen. This unique capability of HRMAS MRS proved to be critical for many human studies, such as those of PCa to be reviewed later.
Apoptosis plays a major role in checking tumor growth and development. As new drugs aim to activate apoptotic pathways within the tumor cells to control their growth, a study included 41 brain tumor biopsies of grades II (n=8), III (n=3) and IV (n=30) astrocytomas revealed Tau as a potential marker of apoptosis in glioma. Tau positively and significantly correlated with apoptotic terminal deoxynucleotidyl transferase biotin-dUTP nick end labelling (TUNEL)-stained nuclei in non-necrotic (p=0.003, R=0.727), as well as in necrotic (p=0.0005, R=0.626) biopsies. Additionally, Lip/MM in the regions of 1.3 ppm (p<0.005, R=0.703) and 2.8 ppm (p<0.005, R=0.705) were positively associated with the number of apoptotic cells in non-necrotic tissue samples. These markers may help to monitor treatment response in clinic25.
In addition to necrosis and apoptosis, identification of other common histopathological features is important for disease evaluation and treatment monitoring. Results from studies of 52 patients of different types of glial tumors showed metabolite differences between tissue with necrosis, high cellularity, or cancer infiltration. The best separations among the three groups were enabled by tCho/NAA and Lip/NAA ratios, with the latter being especially useful in the differentiation between necrotic and highly cellular tissue. The necrotic tissue was characterized by negligible NAA and tCho but very high quantities of lipids, whereas highly cellular tissue showed low NAA and lipids but great amounts of tCho, a marker of cell membrane turnover33. Furthermore, 2HG was found to be positively correlated with mitotic activity (measured by the MIB-1 index), cellular density and relative tumor content within the tissue sample14.
In 2012, an ex vivo 1H and 31P HRMAS MRS study of 33 brain tumor biopsies to identify metabolites, pH values, and their correlations with histopathological features was reported. Percentage of unaffected brain tissue revealed high associations with NAA, Glycerophosphorylethanolamine (GPE), GABA, Cr (all p<0.01) and Glu (p<0.05). In contrast, the percentage of necrosis was negatively correlated with Cr, GABA, Gln, Ade (all p<0.01) and positively with fatty acids (FA) (p<0.01). The metabolites Gln, PE + PCho, FA and the Glu/Gln and Cho/Cr ratios were significantly related to the percentage of tumor cells. GPE, Cr, NAA and Ade (all p<0.01) were all found to be negatively correlated with tissue pH. However, different correlations were found within only GBMs (n=19). The amount of cancerous tissue was positively linked to GSH, PC and myo-Ino levels (all p<0.05). In contrast, FA was negatively associated (p<0.05). Amount of necrosis in the GBM samples and amount of PC, Lac, Glu, GSH, and myo-Ino were inversely correlated (all p<0.05)17.
To assist readers in navigating through the large volume of HRMAS MRS studies on human brain tumors, we have summarized literature data in Table 1.
Table 1.
Selected papers on brain tumors with metabolic findings highlighted, 1998–2015. Additional abbreviations: His, histidine; Lys, lysine; Thr, threonine; Val, valine.
| Year | Author | Samples investigated | Metabolites increased (in first named entity vs. second) | Metabolites decreased (in first named entity vs. second) |
|---|---|---|---|---|
| 1998 | Cheng9 | Astrocytoma (low grade →high grade) | Cho/Cr | NAA |
| 2007 | Tzika38 | Malignant glioma % | PCho/tCr | |
| Necrosis % | Lip/tCr | |||
| 2008 | Andronesi6 | High grade tumors, metastases | Lip, FA | |
| Metastases (breast) | GPC | |||
| Metastases (general) | PCho, PCho/GPC | |||
| Davies12 | Pediatric pilocytic astrocytoma | FA, isoleucine, leucine, Val, NAA, GABA, Glu | Cr, myo-Ino, Tau, ChoCC, | |
| Pediatric ependymoma | myo-Ino, Cr | NAA, Tau | ||
| Erb16 | High grade oligodendroglioma vs. low grade oligodendroglioma | Ala, Val | Proline, Glu, Gln, GABA, NAA | |
| Monleon22 | High grade meningioma | PCho, PE, GSH | ||
| Meningioma (general) | No NAA, low FA | |||
| Opstad24 | Necrosis % in GBMs | Lip/MM | ||
| 2009 | Davies13 | High grade pediatric brain tumors | Gly | |
| Opstad25 | Apoptotic cell density of tumor | Tau (independent of necrosis), Lip/MM (in non-necrotic tissue) | ||
| Righi29 | High grade gliomas | PCho, PCho/tCr | ||
| Low grade gliomas | GPC, PCho/tCr | |||
| Gliomas vs. healthy | ChoCC | |||
| Wilson41 | Pediatric glioma vs. PNETs | Cr, Gln | Tau, PE, PCho, Cho | |
| Pediatric medulloblastoma vs. pediatric meuroblastoma | Cr, Gln, PCho, Gly, scy-Ino | |||
| 2010 | Cuellar-Bana11 | Medulloblastoma (general) | Tau, GPC, PCho, Cho | NAA, FA, Glu |
| Pilocytic astrocytoma (general) | FA | |||
| Ependymoma (general) | myo-Ino | |||
| Monleon23 | Atypical meningioma | Lac | ||
| Righi30 | Tumors vs. healthy | Gly | ||
| GBM vs. low grade tumors | Gly | |||
| GBM vs. metastases | Gly/myo-Ino | |||
| Meningioma vs. low grade tumors | Gly/myo-Ino | |||
| Wright43 | GBM | Cr, Gly, Gln, hyp-Tau | ||
| Astrocytoma II vs. GBM | myo-Ino | Ala | ||
| Astrocytoma II vs. Metastasis | Gln, myo-Ino | PE | ||
| Astro II vs. meningioma | Cr, GPC, His, myo-Ino, scy-Ino | Ala, Glu, GSH, PE | ||
| Astro III vs. metastasis | Hyp-Tau | |||
| Astro III vs. meningioma | GPC, myo-Ino | GSH, Lys | ||
| GBM vs. metastasis | Cr, Gln, Gly, hyp-Tau | |||
| GBM vs. meningioma | Asp, Cr, GPC, His, myo-Ino, NAA, scy-Ino | Ala, Glu, GSH, Isoleucine, Tau, Val | ||
| Metastasis vs. meningioma | Cr | Ala, Glu, Gln, Lac | ||
| 2011 | Chen8 | Increasing astrocytoma tumor grade | Lip, Lac, Ala, scy-Ino | NAA, myo-Ino, Cr |
| Astrocytoma II, III vs. I | Lip, Ala | NAA, myo-Ino, Cr, PCho, GPC | ||
| GBM (general) | Gly, Lip | NAA, PCho, GPC | ||
| GBM vs. Astrocytoma I – III | Lac, Cr, myo-Ino | |||
| GBM vs. astrocytoma I | Lip, Tau | Lac, Cr | ||
| Astrocytoma III vs. I, II | Gly, Lac/Cr, myo-Ino/Cr, Gly/Cr, scy-Ino/Cr, Ala/Cr | NAA, Cr, myo-Ino | ||
| Medulloblastoma (general) | Tau, PCho, GPC | Lac | ||
| Medulloblastoma vs. astrocytoma II – IV | myo-Ino, Tau, Gly, PC, GPC, Asp | Lac, Cr | ||
| Astrocytoma I – II vs. III | NAA, Cr, GPC, myo-Ino | Lac, PCho | ||
| Astrocytoma I – II vs. GBM | Lac, Cr, Cho, GPC | Gly, PCho | ||
| Astrocytoma III vs. GBM | Lac, Cr, Cho, GPC | myo-Ino, PCho | ||
| Croitor33 | Border tissue/cancer infiltration vs. high cellularity or necrosis | NAA | Lip/Cr | |
| High cellularity vs. border tissue/cancer infiltration or necrosis | ChoCC/Cr | Lip/Cr, NAA/Cr | ||
| Necrosis vs. border tissue/cancer infiltration or high cellularity | Lip/Cr | Cho/Cr | ||
| McKnight20 | Astrocytoma II vs. III | PCho | ||
| Ki-67 | GPC | |||
| Cell density | PCho, tCho | |||
| 2012 | Constantin10 | Glioma II → higher grade | 2HG, hyp-Tau, Cho, Lip, GSH, Ala | myo-Ino |
| Secondary Glioma III vs. secondary IV | changes in hyp-Tau, GSH, Ala | |||
| Secondary Glioma III vs. recurrent Glioma II | changes in hyp-Tau, GSH, Cho, myo-Ino, 2HG | |||
| Likelihood of malignant transformation in recurrent low grade gliomas | Increasing 2HG levels | |||
| Elkhaled14 | Metabolites (related to malignancy) positively correlating with 2HG | Asp, GABA, Thr, hyp-Tau, Cr, PCr, Bet, Gly, Lac, GSH, PE, Glu, Gln | ||
| Negatively correlating with 2HG | myo-Ino/tCho | |||
| Righi31 | Hemangiopericytoma vs. meningioma | myo-Ino/Glu, Glc/Glu, GSH/Glu | Cr/Glu, Gln/Glu, Ala/Glu, Gly/Glu, ChoCC/Glu, Ala | |
| 2013 | Sjobakk35 | Necrosis in tissue | Lip | |
| Brain metastases from melanoma vs. other brain metastases | GPC | |||
| Vettukattil40 | Astrocytoma II vs. GBM | GPC, myo-Ino | PCho, Gly, Lip | |
| Non-recurrent vs. recurrent GBM | PCho | |||
| % necrosis | Lip, Lac | |||
| Recurrent vs. non-recurrent GBM | GPC, myo-Ino, Cr | Gly | ||
| 2014 | Elkhaled15 | Transformation from Glioma grades II to III or IV | 2HG, tGSH | myo-Ino/tCho |
| Primary glioma grade III vs. secondary | Cho, Gly, PC/GPC | |||
| Transformation to IV | PC/GPC | |||
| High malignancy regions | tCho | myo-Ino/tCho, NAA, Cr/PCr | ||
| 2015 | Kohe18 | Retinoblastoma level of differentiation | Tau | |
| Level of necrosis | Lip | Tau, hyp-Tau, Cr, PCho, tCho | ||
| Retrolaminar optic nerve invasion | tCho, PCho |
Breast cancer
Studies of BrCa have shown HRMAS MRS as a promising tool in cancer diagnosis, treatment monitoring, and prediction of prognosis54–73. Here, we will focus our review on four interesting aspects: metabolic differences between malignant and non-malignant breast tissues, correlations between metabolites and pathologic features of BrCa, predictions of the response to the clinical treatment and the prognosis of BrCa with metabolic information, and the relationships of metabolite, gene, and protein information.
Metabolic differences between malignant and non-malignant breast tissues
Many conventional diagnostic tools have been developed and applied in clinical practice for BrCa, including mammography, ultrasound, and dynamic contrast-enhanced MRI to provide differential diagnosis for this complex disease. Several studies of BrCa using both in vivo and ex vivo MR spectroscopy have shown that malignant lesions from the breast have increased levels of ChoCC74,75. Studies on extracts of BrCa tissue have reported elevated levels of PC in cancerous tissue compared with non-involved tissue76–78 and benign breast lesions79.
In 2006, the relative intensities of GPC, PC and Cho were examined by HRMAS MRS measured from the microscopy-confirmed cancerous (n=76) and non-involved samples (n=9)55. Consistent with previous findings, intensity ratios of PC/Cho were higher in tumor samples than in non-involved tissue (p=0.005), and GPC/PC and GPC/Cho were lower (p<0.001 and p=0.013). Classification of tumor and non-involved samples based on the relative intensities of the different ChoCC showed high sensitivity and specificity, 82% and 100%, respectively.
A study of 31 breast tissue samples (13 cancers and 18 non-cancers) again showed that in cancer cells, ChoCC, particularly PC, increased, while introducing the novel finding of increased Tau (p<0.009) and decreased Asp (p<0.002)59. The low sensitivity and high specificity of the prediction of the cancer status were 69% and 94%, respectively.
HRMAS MRS observable metabolites discriminated between BrCa and non-involved adjacent tissue in 328 tissue samples (263 BrCa samples and 65 non-involved samples) from 228 BrCa patients. BrCa samples were shown to contain higher levels of ChoCC and Tau, in addition to ascorbate, Lac, Cr, and Gly, and lower levels of glucose (Glc) compared to non-involved tissue (Figure 4). The results emphasized ChoCC as primary biomarkers for tumor presence, given that BrCa and noninvolved tissue could be accurately discriminated with high sensitivity (91%) and specificity (93%) (p<0.001). This finding may have the potential to guide resection margins during BrCa surgery to reduce risk of local recurrence and re-surgery66.
Figure 4.

The corresponding loading profile of first principal component (PC1), explaining 40.1% of the total variation of the data. β-Glc, β-glucose; Asc, ascorbate; Lac, lactate; Cr, Cr; Gly, glycine; Tau, Taurine; GPC, glycerophosphocholine; PCho, phosphocholine; Cho, free choline66.
Correlation between metabolites and pathologic features of breast cancer
Histopathological (tumor size, grade, and axillary lymph node status) and immuno-histochemical [steroid hormone receptor, human epidermal growth factor receptor 2 (HER2), and cellular proliferation marker Ki-67] evaluation of BrCa specimens is the gold standard for patient treatment planning. Studies have focused on correlations between metabolic information measured from the ex vivo HRMAS MRS method and the clinical pathological results. A study of 103 samples (85 BrCa and 18 non-involved tissues) from 85 BrCa patients showed that tumors >2.0 cm were found to have significant higher levels of Gly (p=0.03) and Cho (p=0.04) than tumors ≤2.0 cm (Student’s t-test). While no significant metabolite differences were found in samples between lymph node-positive and -negative patients (Student’s t-test), a trend of increased myo-Ino in samples from node-positive patients (p=0.08) was seen55. Separately, analysis of 36 core needle biopsy samples showed BrCa of high histological grade presenting higher PC/Cr than low histological grade BrCa (p=0.04). Higher tCho concentrations have been detected in high-grade BrCa, indicating a correlation between Cho phospholipid metabolism and tumor malignancy and aggressiveness61.
As is known in the BrCa clinic, estrogen receptor (ER) positive and progesterone receptor (PR) positive tumors present better prognosis, while HER2 overexpression tumors are associated with worse prognosis. To study the relationship between metabolites and these hormone and growth receptors, a study measured 36 ER-negative BrCa samples and found higher Cho than in ER-positive samples (p=0.03). PR-negative cancers also showed higher concentrations of Cho, as well as higher Cr and Tau, than those of PR-positive cancers (p=0.01, p=0.02, and p=0.02, respectively). Concentrations of Tau, scy-Ino, and myo-Ino of HER2-positive BrCa were significantly higher than those of the HER2-negative cancers (p=0.01, p=0.03, and p=0.01, respectively). Triple negative BrCas (TNBC) (ER-negative, PR-negative, and HER2-negative cancers) showed higher Cho concentrations and higher values of Cho/Cr and tCho/Cr than those of non-triple negative cancers. BrCa with high Ki-67 levels showed higher concentrations of tCho and PC, and higher values of PC/Cr than those of BrCa with low Ki-67 (p=0.01)61. These high concentrations of ChoCC in BrCa tissues may be a consequence of overexpression and changes in the levels of choline kinase activity in response to demands from the cell for increased phospholipid synthesis80,81. Down-regulation of choline kinase alpha (CHKA), the gene regulating the conversion of Cho to PC, has been shown to decrease cell proliferation, and to increase the effect of chemotherapy in ovarian cancer82 and in BrCa83, whereas CHKA overexpression increases drug resistance in BrCa cells84. Targeting the genes or enzymes responsible for the Cho phospholipid metabolism may provide new molecular targets for treatment of TNBC67.
In another investigation of hormone receptors and protein expression, a larger study of 106 biopsies from 73 patients showed clear separation between TNBC and triple positive BrCas (TPBC) (ER-positive, PR-positive and HER2-positive cancers) (77.7% accuracy, p=0.001) using varying levels of metabolites: TNBC is characterized with higher levels of Cho and GPC and a lower level of Cr compared to TPBC. Partial least square-discriminant analysis (PLS-DA) models enabled clear separations between ER-negative and ER-positive (72.2% accuracy, p<0.001), and PR-negative and PR-positive (67.8% accuracy, p<0.001) tumors in the testing set (Figure 5). ER-negative tumors show higher levels of Gly, Cho, and Lac compared to ER-positive tumors, suggesting enhanced glycolytic activity. PLS-DA classification and relative quantification of PR-negative and PR-positive tumors show similar metabolite profiles to ER-negative and ER-positive tumors. Validation of a PLS-DA model to separate HER2-negative and HER2-positive tumors discriminated the two with 69.1% accuracy (p<0.001). By relative quantification, HER2-negative tumors have a lower level of Gly, Gln, succinate, and Cr and higher levels of Ala, compared to HER2-positive tumors. Regardless of ER and PR status, higher levels of Gly were associated with HER2 overexpression67.
Figure 5.
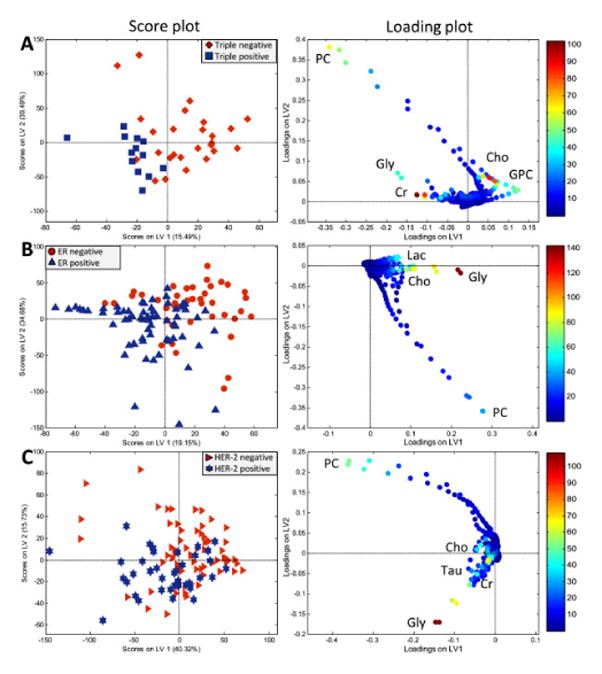
PLS-DA score and loading plots of (A) TNBC vs. TPBC, (B) ERneg vs. ER pos, and (C) HER-2 neg vs. HER-2 pos breast cancer tumors. In the score plots (left), each symbol represents one sample. The score plots show the first and second latent variables (LV), and are used for interpreting relations between samples, thus similar samples are located close to each other. In the loading plots (right), the symbols represent metabolites that are significantly important for the discrimination between the groups. Variable importance in the projection (VIP) scores is illustrated by the heat map. The majority of TNBC, ERneg and HER-2neg samples have positive score for LV167.
Prediction of the response to the clinical treatment and prognosis with metabolic information
As BrCa is a heterogeneous disease, major efforts aim to more precisely identify women at risk for recurrence and to predict patient responsiveness to systemic therapies. Thirty-seven tissue samples from 37 locally advanced BrCa (a subset of BrCa characterized by the most advanced breast tumors in the absence of distant metastasis, T3–4 N1–3M0) patients were obtained by core needle biopsy65. These patients were treated with anthracycline- and/or taxane-based neoadjuvant chemotherapy (NAC), and subsequently underwent surgery. The 37 samples were analyzed for a number of metabolite concentrations and choline-related compound ratios. Applying multivariate analysis, orthogonal projections to latent structure-discriminant analysis (OPLS-DA) model showed clear discrimination of three pathologic responses to NAC (sensitivity between 84.6–100%): pathologic complete response, partial response, and stable disease. Low concentrations of Tau, Cho, and GPC in the complete response group distinguished it from the others (p<0.05).
Another study confirmed that the partial response and stable disease groups could not be differentiated63,64. Seventy pre-treatment and eighty post-treatment spectra from 85 patients, who were treated weekly with doxorubicin NAC for 16 weeks before surgery, were acquired. Although there was a significant change in tumor metabolism in response to NAC treatment for patients with partial response and stable disease, there was no difference in the metabolic response between them by PLS-DA63. On the other hand, when comparing the metabolic changes between survivors (≥5 years) and non-survivors (<5 years), significant differences in the metabolic response to NAC were seen, including increases in Lac (p=0.004), and decreases Glc (p=0.002), in response to treatment in non-survivors compared to survivors. Under normoxic conditions, cancer cells, according to the Warburg effect, can reprogram their energy metabolism to largely depend on anaerobic glycolysis as their primary energy pathway, resulting in increased Lac production85,86. Increased Lac levels may be a marker for tumor aggressiveness as high levels of Lac have been correlated with low survival rates, high incidence of distant metastasis and recurrence, and increased risk of radiation resistance in several types of cancer 87–89. It has been hypothesized that Lac may enhance the invasiveness of tumor cells and the resulting low pH may help tumor cells evade tumor-attacking immune cells90.
From a larger open-label multicenter study where patients were randomly allocated to receive NAC treatment with either anthracycline (epirubicin) or taxane (paclitaxel) monotherapy, samples were analyzed from a subcohort of breast cancer patients (n=89)64. In this study, Gly appears to be decreased in survivors (≥5 years), and the difference in Gly relative intensities before and after treatment was significant (p=0.047)64. The observed Gly decrease in survivors may reflect altered glycolysis and/or reduced Cho levels associated with reduced tumor aggressiveness64.
HRMAS MRS was applied to intact tissue samples from BrCa patients with clinically defined good (n=13) and poor (n=16) prognoses57. Good prognosis was defined as no detectable cancer spreading to axillary lymph nodes, tumor smaller than 2 cm, and positive for ER and PR hormone receptors, with poor prognosis as the opposite. Absolute quantitative measurements of nine metabolites were analyzed by peak area ratios and PCA. A trend toward lower concentrations of Gly in patients with a good prognosis (1.1 mmol/g) compared to patients with a poor prognosis (1.9mmol/g) (p=0.067) was found. Tissue concentration of Glc was found to negatively correlate to proliferation index (MIB-1) (r2=−0.46, p=0.013). Most importantly, high levels of Tau, GPC, and Cr combined with low levels of Gly and PCho in BrCa tissue characterized patients who remained healthy five years after surgery. Combined peak area ratios or PCA of metabolic profiles from several metabolites more strongly correlated with patients’ prognosis and long-term health status than single metabolite concentrations.
In another study, 209 tissue spectra from 156 patients were analyzed by PLS-DA, probabilistic neural networks, and Bayesian belief networks to compare the prediction capability of different multivariate analysis methods58. A blind set (n=50) was used to test the training set (n=~150) for verification of each multivariate model. ER and PR status were successfully predicted by each method, but they were best predicted by PLS-DA with a correct classification of 44 of 50 and 39 of 50 samples, respectively. Lymph node status was best predicted by Bayesian belief network with 34 of 50 samples correctly classified, indicating a relationship between metabolic profile and lymph node status. It showed that hormone receptor-negative patients appear to have more Gly, GPC, and Cho than receptor-positive patients (p<0.05).
Relationships of metabolite, gene and protein information
To investigate the potential of evaluating molecular mechanisms at different levels, a feasibility study measuring genetic and metabolic data from the same BrCa samples was conducted for BrCa tissue samples from 46 patients. Following HRMAS MRS, microarray analysis showed no significant change in total RNA integrity (p=0.86)56. Luminal A tumors, a subtype of BrCa that is HER2-, ER-, and PR-negative, were split into three subgroups based on hierarchical clustering of the HRMAS MR spectra. One of the subgroups, designated A2, showed significantly lower Glc and higher Ala levels than the other two groups (p<0.001), suggesting higher glycolytic activity in the A2 tumors (Figure 6). Potentially explained by increased glycolytic activity and indicative of a more aggressive tumor, Gene Ontology (GO) terms related to cell cycle and DNA repair also significantly differentiated this group from A1 tumors.
Figure 6.

Differences in metabolic and gene expression profiles of identified groups of luminal A samples. Mean spectra of the A1 (black), A2 (red) and A3 (blue) groups of luminal A tumors are plotted with the significantly different points (p<0.001) indicated with grey vertical lines. At ppm values with allocated metabolites and significant differences in one group vs. the other, the direction of the arrows indicate if the latter group has the highest (up) or lowest (down) mean value56.
Analysis of protein expression was also combined with metabolite and gene evaluations in a study of 228 BrCa patients70. HRMAS MRS was performed to gather tumor metabolic profiles, and hierarchical cluster analysis resulted in three significantly different metabolic clusters (Mc1, Mc2, and Mc3) that could provide treatment guidance in the clinic. Genomic and proteomic assays were also conducted to investigate correlations with the metabolomic-derived clusters: reverse phase protein array subtypes and genetic subtypes significantly differed among the three clusters, with assays finding that extracellular matrix- and collaged-associated genes were downregulated in Mc1, for example. Metabolomic evidence of an increased glycolytic rate in Mc1 also helps to classify it as the cluster likely with the worst prognosis. These approaches of combining information from several –omics levels show promise in sub-classifying BrCa or improving the understanding of breast cancer heterogeneity, potentially leading to more patient- and therapy-specific treatment70.
Selective tissue metabolic relationships observed with intact BrCa tissues are summarized in Table 2.
Table 2.
Selected papers on breast cancer with metabolic findings highlighted, 1998–2016. Additional abbreviations: Asc, ascorbate; Asn, asparagine; Eta, ethanolamine; Fum, α-Haa, hydrogen attached to α-carbon of amino acid, Phe, phenylalanine; pro, proline; Tyr, tyrosine.
| Year | Author | Samples investigated | Metabolites increased (in first named tumor vs. second) | Metabolites decreased (in first named tumor vs. second) |
|---|---|---|---|---|
| 1998 | Cheng54 | IDC II vs. II–III | Lac/Cho, PC | |
| IDC II vs. III | Lac/Cho, PC | |||
| 2006 | Sitter55 | Tumor vs. non-involved | PC/Cho | GPC/PC, GPC/Cho |
| IDC III vs non-cancer (tumor without cancer cells) | Cho | |||
| Chemo-treated vs. non-cancer | Cr | |||
| Tumor >2.0 cm vs tumor ≤2.0 cm | Gly,Cho | |||
| Cancer cell vs. fat and fibrous connective tissue | Gly, PC | |||
| 2010 | Borgan56 | A1 vs. A2 | β-Glc, α-Glc, Lip | Ala, α-Haa, myo-Ino |
| A2 vs. A3 | Ala | β-Glc, α-Haa, α-Glc | ||
| A3 vs. A1 | α-Haa, myo-Ino | Lip | ||
| Sitter57 | Good prognosis vs. poor prognosis | Tau/Gly, GPC/Gly, tCho/Gly | ||
| Giskeødegård58 | ER-negative vs. ER-positive | Gly, GPC, Cho, Ala, Asc, Cr, Tau, PC, Lac | ||
| PR-negative vs. PR-positive | Asc, Lac, Gly, GPC, PC, Cho, Cr, Ala | |||
| 2011 | Li59 | Cancer vs. non-cancer | Tau, ChoCC (PC especially) | Asp |
| Klomp60 | 31P MRS 7T in vivo patient 1 vs. healthy | PE, PC, GPC | ||
| 1H MRS 7T in vivo patient 1 vs. healthy | tCho | |||
| 2012 | Choi61 | ER-negative vs. ER-positive | Cho | |
| PR-negative vs. PR-positive | Cho, Cr, Tau | |||
| HER2-negative vs. HER2-negative | Tau, scy-Ino, myo-Ino | |||
| Low histological grade vs. high histological grade | PC/Cr | |||
| TNBC vs. TPBC | Cho, Cho/Cr, tCho/Cr | |||
| Low Ki-67 vs. high Ki-67 | PC, tCho, PC/Cr | |||
| Good prognosis vs. poor prognosis | scy-Ino, Gly | |||
| Giskeødegård62 | ER-positive survivors vs. non-survivors | Lac | ||
| Cao63 | Pre-NAC survivors vs. post-NAC survivors | Gly, GPC, PC, Cho, tCho | β-glc, Lac, Gly | |
| Cao64 | Pre-NAC PR vs. post-NAC PR | GPC, tCho | ||
| Pre-NAC survivors vs. post-NAC survivors | GPC, Cho | |||
| Survival ≥5ys vs. Survival <5ys | tCho | Lac | ||
| 2013 | Choi65 | pCR vs. PR | PC/Cr | |
| Bathen66 | Tumor vs. non-tumor | Asc, Lac, Cr, Gly, Tau, ChoCC | Glc | |
| 2014 | Cao67 | TNBC vs. TPBC | Cho, GPC, Glu | Cr, Gln |
| ER-negative vs. ER-positive | Gly, Cho, Lac, Glu | Gln | ||
| HER2-negative vs. HER2-positive | Gly, Gln, succinate, Cr | |||
| 2016 | Chae68 | DCIS vs. DCIS with invasive cancer | GPC/PC, myo-Ino, succinate | |
| Yoon69 | High SER vs. low SER | Asn, Cho, Fum, Glu, His, PE, Phe, Tyr, uracil, tCho | ||
| High SUV vs. low SUV | Asn, Fum, Glu, Lac, PC, PE, uracil, tCho | |||
| ER-positive, high SER vs. low SER | Asn, ethanol, Eta, Fum, Gln, His, Lys, Phe, Tyr, uracil | |||
| ER-positive, high SUV vs. low SUV | Fum, Lac, uracil | |||
| PR-negative, high SER vs. low SER | Asn, His, Phe, Tyr, Uracil | |||
| PR-negative, high ADC vs. low ADC | Asp | |||
| PR-negative, high SUV vs. low SUV | Asn, PE, Uracil | |||
| PR-positive high SER vs. low SER | Fum, Lys | |||
| PR-positive high ADC vs. low ADC | His, Phe, Tyr | |||
| PR-positive high SUV vs. low SUV | Lac | |||
| HER2-negative, high SER vs. low SER | Asn, Cho, Eta, Fum, His, PE, Uracil | |||
| HER2-negative, high ADC vs. low ADC | Thr | |||
| HER2- negative, high SUV vs. low SUV | Asn, Cho, Fum, Glu, Lac, PE, Uracil | Ile | ||
| HER2-positive, high ADC vs. low ADC | Eta, Uracil | Lac | ||
| HER2-positive, high SUV vs. low SUV | Betaine, Cr | |||
| Ki67-negative, high SER vs. low SER | Fum, His, Lys, Pro, Uracil | Ala | ||
| Ki67-negative, high ADC vs. low ADC | Leu | Tau | ||
| Ki67-negative, high SUV vs. low SUV | Asn, Fum, Lac, Uracil | |||
| Ki67-positive, high SER vs. low SER | Phe | |||
| Haukaas70 | Mc1(58p) | GPC, PC | Lac, Tau, Ala, Glu, Ace | |
| Mc2(58p) | β-glc, myo-Ino | Lac, Cr, Gly, Tau, GPC, PC, Ala, Asc, L-Tyr | ||
| Mc3(112p) | Lac, Gly, Tau, Cr, Ala | β-Glc, GPC, PC | ||
| Mc1 vs. Mc2 | GPC, PC, L-Tyr, Asc, Cr, Ala | β-glc, myo-Ino, scy-Ino, Glu, Ace | ||
| Mc1 vs. Mc3 | GPC, PC | Lac, Tau, Ala, Glu, Ace, myo-Ino | ||
| Mc2 vs. Mc3 | β-glc, myo-Ino, Ace | Asc, Lac, L-Tyr, Gly, GPC, PC, Cr, GSH, succinate, Ala | ||
| Park71 | Center vs. periphery | Pro | ||
| Haukaas72 | 1.5h after vs. before | Glc, Gly, Cho | GPC |
Prostate Cancer
This chapter critically reviews publications on prostate cancer (PCa)91–116 and concentrates on metabolic changes that allow for discrimination between benign and malignant tissues as potential biomarkers, as well as their connection to clinical parameters, including the Gleason scores (GS), pathological stage, and disease prognosis. Given the limitations of biopsies, digital rectal exams, and prostate-specific (PSA) tests, novel tools are necessary to guide disease surveillance, avoid overtreatment, and improve patient’s quality of life.
Metabolic differentiations of malignant and benign prostate tissues
HRMAS MRS studies on PCa started with attempts to differentiate samples according to their malignant or benign status, with the first measuring 199 specimens (5 GS=5, 126 GS=6, 53 GS=7, 9 GS=8, and 6 GS=9) from 82 prostatectomies. Metabolites PCho and Cho were seen to strongly contribute to the PC that significantly differentiated tissue status (p<0.005) (Figure 7b)93.
Figure 7.

(A) High-resolution magic angle spinning 1H MR spectrum of intact tissue obtained from the removed prostate of a 61-year-old patient with GS 6 T2b tumors. (B) Three-dimensional plot of principal component 13 (PC13 correlates linearly with percent volume of cancer cells in tissue samples) vs. phosphocholine vs. choline. Cancerous and histologically benign (histo-benign) tissue samples from 13 patients can be visually separated in observation plane. The paired Student’s t test results (cancer vs. histo-benign from the same patients) for principal component 13, phosphocholine, and choline are 0.012, 0.004, and 0.001. Only results from these 13 patients could be evaluated with paired tests for other cancer positive samples were collected from patients from whom no histo-benign samples were analyzed. (C) The canonical plot resulting from discriminant analysis of the three variables in B presents the maximum separation between the two groups. (D) The resulting receiver operating characteristic curves indicates the accuracy of using the three variables in B to positively identify cancer samples93.
Since publication of this study in 2005, ChoCC have been evaluated as discriminant metabolites for PCa in several others92,94,101,110–115. PCa tissues have also been compared with other non-cancer prostate pathologies such as healthy glandular (n=20) and stromal tissues (n=20), with the former being the epithelia that are responsible for secretion and the latter, smooth muscle cells111. When predominantly stromal tissue is compared to cancer, enrichment of ChoCC in the latter significant differentiates the two (p=0.01)112. In addition, myo- and scy-Ino elevations may derive from membrane-associated phosphatidyl inositols or from inositol phosphates which serve as cellular signal transduction messengers103. Notably, using multivariate linear regression, the myo-Ino/scy-Ino ratio was reported to correlate inversely with tumor load from studies of 108 non-malignant and 41 malignant samples (p=0.001)110. Furthermore, this ratio also seemed to correlate with distance to tumor foci (p=0.03). Therefore, the ratio between these isomers may be important for PCa evaluation. In addition, this distance relationship could also be seen with the (ChoCC + PC)/Cr ratio (p<0.001).
Lac and Ala levels are also enhanced in PCa tissues101,113–115. Results from a study of 20 PCa samples revealed that higher concentrations of ChoCC and Lac were seen in PCa tissues than were measured in healthy glandular and stromal tissues (both p<0.01), and Cho and Ala were also significantly higher in PCa tissues when compared with stroma (both p<0.01)113. Although Lac and Ala enhancements may be caused by hypoxia which occurred during sample handling, their large ratio (Lac/Ala) seemed to be indicative of PCa, as Lac may be increased through anaerobic glycolysis115. These results indicated stimulation of glycolytic flux, cytosolic amino acid transformations, and protein synthesis104. The altered Lac levels may result from a number of biological processes, including the Warburg effect85,86,116, the activation of hyaluronan synthesis105, the upregulation of the growth factor VEGF97, or the hypoxia-inducible factor HIF-1α106. When comparing benign samples predominantly containing glandular or stromal tissues, Lac and Ala levels did not differ significantly114. Together with Cho derivatives, ethanolamine (Eta)-containing compounds were reported as discriminant (15 cancer vs. 32 benign)111. High levels of PC, GPC, PE, and GPE and low Eta were found in cancer specimens. Moreover, evaluations of metabolic ratios presented higher values for PC/GPC (sensitivity=73%, specificity=81%), PC/PE (sensitivity=73%, specificity=81%), PE/Eta (sensitivity=50%, specificity=77%), and GPE/Eta (sensitivity=64%, specificity=81%) ratios in cancer cases 111. Since these molecules are precursors or degradation products of phospholipid membranes74, they indicate cellular proliferation, apoptosis, and enzymatic activity in cancer status117–122.
Another interesting class of biomolecules found in malignant specimens is the omega-6 polyunsaturated FA (n-6-PUFAs), including linoleic acid, γ-linolenic acid, dihomo-GLA, and arachidonic acid109. Results from this study suggested that n-6 PUFAs did not accumulate in the adjacent non-malignant tissue. These data were in accordance with reports of potent stimulant effects of n-6 PUFAs for PCa development and aggressiveness99, likely due to their involvement in diet, cell death, mitochondrial and cell membrane breakdown, and accelerated cell turnover in lipid-rich regions.
Concentrations of Cr do not significantly differ for different PCa pathological status113. For this reason, several studies have used Cr as a normalization factor and reported significant increases in (ChoCC+Cr)/Cit, ChoCC/Cr (both p<0.05)115, Tau/Cr (p=0.03), and polyamine-to-Cr (PA/Cr) ratios (p=0.013) in cancer samples. Many also report a decrease in the Cit/Cr ratio (p=0.05)112 or positive correlation of (ChoCC + PC)/Cr, Cho/Cr, and scy-Ino/Cr with tumor load (0%–100%) (p<0.05)110. In the latter study of 149 tissue samples, 108 samples with 0% tumor load were characterized by a broad variability in stroma-to-epithelium ratio, as well as by the presence of inflammatory cells and diverse glandular morphologies. Interestingly, inter-sample difference of (GPC + PC)/Cr ratios did not vary as much for these samples with variable pathology as compared with samples of >0% tumor loads. The (GPC + PC)/Cr ratio also correlated with number of proliferating cells, measured by proliferation marker Ki67 presence (p<0.001)110.
Potential biomarkers in PCa
Since serum PSA levels are known to be prostate specific, but not cancer specific nor capable of predicting PCa aggressiveness, additional biomarkers may contribute to a more personalized PCa clinic91.
Results from a number of studies indicated citrate (Cit) and polyamines as potential prostate biomarkers92,94,112,114,115. Bivariate linear least square analysis performed on 16 adenocarcinoma samples (9 GS=6, 6 GS=7, and 1 healthy control) showed increased levels of Cit (p=0.001) and spermine (Spm p=0.018), a polyamine, with increases in percentage volume (vol%) of normal prostatic epithelial cells in the analyzed samples94, indicating that Cit and Spm are largely presented in histologically-benign (histo-benign) prostate epithelial glands96. In addition, Cit and Spm were also linearly correlated (r2 = 0.75, p=0.0001). The reduction of Cit is likely due to the depletion of zinc in PCa cells, since zinc can function to prevent oxidation of Cit in the Krebs’ cycle98. Spm is also an important metabolite in the prostate for its inhibitory effect on the growth of PCa cells in vitro108. Interestingly, since Cit and Spm are secreted in histologically benign (histo-benign) lumen epithelia95,100, linear correlations were observed between concentrations of both metabolites and computer-aided image analysis-determined vol% of epithelium with lumen and without lumen. Correlations between vol% epithelium with lumen were reported for Cit (r2=0.432; p<0.02) and Spm (r2= 0.490; p<0.02), and correlations between vol% epithelium without lumen and the metabolites were r2= 0.581; p<0.01 and r2= 0.336; p<0.05, respectively. However, no correlation was found between metabolic concentrations and vol% lumen alone, suggesting the metabolites are secreted as a function of normal epithelia92.
Correlation of metabolomics with clinical features
Metabolites measured with HRMAS MRS also have been correlated with Gleason scores, PSA levels, or risk of biochemical recurrence (BCR).
The Gleason Score (GS) is the most relevant parameter for PCa evaluation in clinic. HRMAS MRS results indicated increases in Cho, (Cho + Cr + Spm)/Cit ratio, and n-6 PUFAs, and decreases in Cit in association with high grade PCa107,109,112. Linear regression analyses have shown that Cho/Cr, tCho/Cr, and Cit/Cr ratios significantly relate to GS (all p<0.05), and, according to Spearman’s rank tests, significant correlation coefficients link GS with GPC+PC/Cr, Cho/Cr, tCho/Cr, Cit/Cr, tCho/Cit, and (tCho+Cr)/Cit (all p<0.05) (Figure 8)115. Because of Cit secretion in histo-benign glandular epithelia, higher Cit/Cr ratios were measured in histo-benign glandular than in stromal tissues (p=0.0011), or in samples with <20% (p=0.017) or >20% (p=0.05) presence of PCa glands112. Thus, Cit/Cr alone may not separate predominantly stromal specimens from those containing cancer or between GS 6 and GS 7 cancers. As expected, similar results were observed using Spm/Cr ratio112.
Figure 8.

Ex vivo 1H HRMAS spectra showing the Cho-to-Cit region and corresponding H&E staining patterns of excised tissue samples containing (a) predominantly prostate cancer, (b) benign predominantly stromal tissue, and (c) benign predominantly glandular tissue112.
However, unlike relative concentrations, examining absolute concentrations of Cit and Spm showed significant differences in the presence of PCa, with Spm being almost absent in GS 7112. Furthermore, Spm and Cit also seemed capable of separating tumors confined in both lobes from tumors invading extraprostatic tissue and from cancer confined in a single lobe, as well as recognizing benign GS 6 from benign GS 7 samples93. The ChoCC/Cr ratios were reported to be significant only for samples with cancer load ≥ 20% (p≤0.05)112.
A decrease in Cit concentrations in benign epithelia was correlated to faster PCa growth rates (p<0.05, n=27 from 18 patients), as low Cit/epithelia levels were symptomatic of rapid increase in PSA values (r2=0.27, p<0.034), hence higher PSA velocities. Similar results were reported when correlating Cit/epithelia with PSA densities (r2=0.31, p<0.021) and blood percent-free PSA (r2=0.53, p<0.011)98.
HRMAS MRS has also been employed in estimation of the risk of BCR after prostatectomy. Sixteen patients with BCR were paired with 32 subjects with no BCR and matched according to age, GS, and observation period. Based on four PCs, metabolomic profiles can differentiate matched groups with and without BCR. Analysis of variance (ANOVA) and receiver-operating characteristic (ROC) provided insight that recurrence could be predicted in 71% and 78% of cases, according to the four identified PCs and all nine PCs, respectively102.
Another interesting application of HRMAS MRS was the characterization of androgen deprivation therapy effects on patients treated with Degarelix, a drug that rapidly suppresses PSA expression and castrates testosterone levels101. OPLS-DA of 7 untreated and 6 treated prostate samples proposed, without a validation set, that depletions in Lac and ChoCC concentrations were indicative of Degarelix treatment. As described in the previous sections, the former observation could be related to lower glycolysis, while the latter may implicate drug-induced effects on the phospholipid metabolism. These ex vivo findings support the possibility to monitor the pharmacological response of the patients by optimized in vivo 1H MRS techniques.
Cervical Cancer and Uterine Leiomyomas
Research on the uterine organ has focused on two clinical conditions with very different underlying biochemical mechanisms.
Cervical cancer (CeCa) accounts for 10% of all female cancers in western countries123. This low rate is probably the result of the implementation of screening programs over the last 50 years; in fact, in countries where such strategies are not systematically applied, CeCa is the predominant form of cancer among women124. The majority of the literature on the discrimination between CeCa and non-malignant specimens agrees on higher levels of Cho-containing compounds (GPC and PC) (p≤0.05) as cancer indicators125–129. While the Cho derivatives are common features in different type of cancers due to stimulated cell turnover, the correlation between oncogenic human papillomavirus and CeCa130 also presents viral proteins E6 and E7131 as partially responsible for alterations in ChoCC.
Lipids, especially triglycerides, comprise another class of discriminants that increase with the presence of CeCa malignancy (p<0.05)125,127,128,132. Current hypotheses suggest the presence of apoptotic cells133 and necrosis as reasons for increases; however, the role of necrosis is under debate because of their involvement in a variety of different cancers134–136. Results from a linear regression show that lipid peak areas fail to correlate with tumor load for samples with greater than 20% tumor, suggesting that a sizeable tumor presence may induce changes in the adjacent tissue through ‘field effects’ that cause its lipid profile to look more like cancer (p<0.05)132. However, no data were available to indicate the distance over which this metabolic change is detectable.
Increases of amino acid residues such as Cr (p=0.05), Tau, and Ala (p<0.001) have been observed as characteristic of tumor tissue125,128,129. Intriguingly, Ala and Cr levels appear depleted in benign tissue from cancer patients when compared with normal tissue from non-cancer patients, suggesting metabolite depletion in benign tissue adjacent to cancer129. Therefore, the presence of tumors alters the metabolic profile of the surrounding cells137. Moreover, the significant presence of Tau may be an endogenous defense mechanism against tumor proliferation125. In addition, a study of six squamous cell carcinomas, two adenocarcinomas, and eight nonmalignant hysterectomy tissues measured higher Lac and lower levels of Glc in malignant samples125, suggestive of the Warburg effect, the preference for anaerobic lactic acid fermentation over the usual energetic pathways85,86,138,139.
Results from analysis of 44 biopsies sampled before and during radiotherapy in 23 patients identified a relationship between samples with high tumor cell fraction and high tumor cell density, finding elevated levels of Lac, Cr, GPC, and PC and decreases in Glc, myo-Ino, Tau, and Cho (p<0.001) associated with each140. The increases in GPC and PC and the reduced levels of Cho suggest high membrane turnover, cell proliferation, and activation of choline kinase-initiated Cho-to-PC conversion and the phosphatidylcholine pathway74,141,142. Furthermore, the study also showed that apoptotic cell density correlated with lipid contents (r=0.95, p<0.001). Low apoptotic activity has been associated with aggressiveness and treatment resistance in many tumor types, including CeCa143,144. Here, the positive correlation between lipid contents and highly apoptotic tissues is probably due to modifications in the composition of cytoplasmic lipid droplets145. The lipid increase in cancer specimens could be enhanced when apoptosis is triggered by radiotherapy and could be an indicator of treatment success. Lac and lipids were also reported as discriminatory metabolites between adenocarcinomas and samples from patients with lymphatic invasion125.
Cervical intraepithelial neoplasia (CIN) is a pre-invasive stage of CeCa that can function as an investigative model to explore early events in the biology of epithelial malignancies129. Metabolomic comparisons of punch biopsy samples of 27 squamous cell carcinoma (SCC), 12 CIN, and 39 normal tissues showed SCC as characterized by longer, more saturated lipid side-chains than CIN and healthy cases, only reaching statistical significance for distinguishing SCC and healthy126. Increased levels of Cho and Cr also characterized SCC tissue, but no significant separation was possible between CIN and normal tissues.
ChoCC (p=0.034) and lipids at 1.3 ppm (p<0.005) were helpful in separating CIN (n=14) from CeCa (n=23)146. ANOVA with Bonferroni correction and t-test analyses showed that higher levels of both metabolic classes characterized tumor cases. These observations may be explained by rapid cell membrane turnover, resulting in accumulation of choline metabolites not only in the cancer cells, but also in the peritumoural tissue. Unfortunately, analysis of the stromal portion delivered no significant information. In another study investigating CIN, ChoCC measured with 73 biopsies (5 histologically normal cervix, 5 mild CIN, 40 moderate/severe CIN, and 23 invasive cancer) showed higher (p≤0.002) concentrations could distinguish cancer from high-grade CIN tissues, and could separate CIN samples of cancer-affected from CIN of non-cancer patients (p=0.0001)129. Nevertheless, in light of the previously discussed effects on these metabolites from tissue pathological features, such as the proportion of epithelia, interpretations of the experimental results should also consider the presence of tissue pathology.
Another medical condition affecting 20 to 50% of women is uterine leiomyomas, commonly known as fibroids, which are solid, benign, and non-degenerating pelvic tumors. Intense pelvic pain, urinary disturbances, uterine bleeding, anemia, infertility, and abortion may be related outcomes147. To search for a comprehensive molecular description of the condition, intact healthy (myometrium) and leiomyoma uterine tissues from 10 subjects were studied148. The application of ANOVA and PC analyses revealed an enrichment of Glu and Gln and a depletion of Tau in leiomyomas (p≤0.05). In addition to these main differences between the two groups, increases in myo-Ino, Lac, leucine and isoleucine also played roles in separation of the two groups (p≤0.05).
Gastrointestinal Neoplasia
HRMAS MRS has been used as a diagnostic tool to differentiate between gastrointestinal mucosae types. In analyzing tissue biopsies from eight female and eight male healthy subjects, no measurable difference was found in the overall metabolite composition between genders. However, metabolite intensities did show dependency on the anatomical sites from where biopsies were obtained149. These investigated topographical regions including antrum, duodenum, jejunum, ileum, and colon. By using a cross-validated OPLS-DA model, it was observed that the antrum, the duodenum and jejunum together, and the colon all had specific metabolic profiles, whereas the ileum overlapped with the duodenum/jejunum and the colon (Figure 9). This observation is anatomically reasonable for the ileum links the jejunum and colon. In addition, the study correlated metabolic alterations with physiological conditions in the gut. Since the stomach is exposed to low pH values and osmotic stress, the appearance of protective glycoproteins and osmolytes, such as Tau, is physiologically logical. Traces of pancreatic lipid digestion – such as lipids and Cho – are seen in duodenal spectra, and the glutathione observed may function to protect cells against radicals resulting from lipid digestion. Amino acids seen in ileal spectra might reflect energy metabolism in the gut which depends heavily on amino acids, such as Gln. The diverse microbiome of the colon results in a great deal of bacterial fermentation, which could explain the large amounts of acetate in the spectra of colonic mucosa.
Figure 9.

OPLS-DA cross-validated scores plot showing differentiation of the metabolic profiles of localized gastrointestinal compartments. Red squares, antrum; blue dots, combined duodenum and jejunum, brown dots, ileum; green rhombus, colon149.
Cancers of the gastrointestinal tract account for almost 17% of all cancer cases in developed countries and about 20% in developing countries150. To understand metabolic differences among cancer types and stages within a type, HRMAS MRS studies have investigated colorectal cancer (CRCa). The findings from different reports regarding metabolic changes in CRCa were similar and consistent. In agreement with the Warburg effect, higher levels of Lac and lower levels of Glc were found in CRCa tissue samples, as well as lower levels of lipids (all p<0.05)151–153. Increased levels of cell membrane components Cho and ChoCC, a marker of cell proliferation, were found in cancer cells (all p<0.05)151,153. Higher levels of the amino acid Gly were found in cancer as well; in one report it reached a very high level of significance with p<0.005152 and is again linked to cell proliferation as a precursor in the synthesis of glycolysis intermediates151,152.
While many studies focus on individual metabolites, a pilot study on rectal cancer compared 14 malignant and 9 benign samples collected from 5 patients using PCA. Analysis revealed statistically significant differences in malignant-benign comparisons for a variety of spectral regions not identified with specific metabolites (all p<0.03), as well as highlighted correlations between histopathological features and spectral regions154.
In addition to reporting metabolic changes between benign and cancer samples, HRMAS MRS has also been used to assess CRCa tumor (T), lymph node infiltration (N) and metastasis (M) status – the TNM-staging essential for therapy decisions and prognosis. A study analyzed 44 samples from tumor centers and 44 samples from mucosa 5 cm from the tumor margin. The results suggested different tumor stages have distinct metabolic profiles. The development from T1/2 to T3 is marked by an increase in lipids and acetate and a decrease in GPC, whereas, T4 tissue seems to be metabolically depleted when compared to T3 tumor tissues. This seemingly-unexpected decrease in metabolite activities in T4 tumors likely indicates the T3 stage experiences the most powerful growth. The study was able to correctly classify 90%, 91%, and 75% of T1/2, T3 and T4 tumors, respectively152.
Tumor growth can metabolically change the tissue environment, as explored in a study using ‘off-tumor-tissue’ (OTT) to predict the N-stage from 83 tumor and 86 OTT samples from 26 patients. OTT samples localized next to T4-staged tumors showed lower levels of Glc and formate but increased levels of certain amino acids, such as Val (p<0.05), when compared to OTT samples next to T1 – T3 tumors, likely caused by higher protein degradation in the area surrounding higher-staged tumors. In addition, OTT presented metabolic profiles that varied by N-stage. Patients with lymph node infiltration had higher levels of Leu and phenylalanine (Phe) in their OTTs (p<0.05). Higher N-stages, in general, were associated with the trend of lower triglyceride levels likely due to a higher consumption of TGs during fast growth. Interestingly, for the prediction of the N-stages, the OTT metabolic profile presented a higher predictive power (AUC=0.92) than the metabolic profile measured from tumor tissues (AUC=0.88). Furthermore, a very promising predictive result was observed when correlating five-year patient survival rates with specific metabolic changes, which indicated that a relapse in CRCa was more probable for patients with higher concentrations of Cho, isobutyrate and acetate (Figure 10)153.
Figure 10.
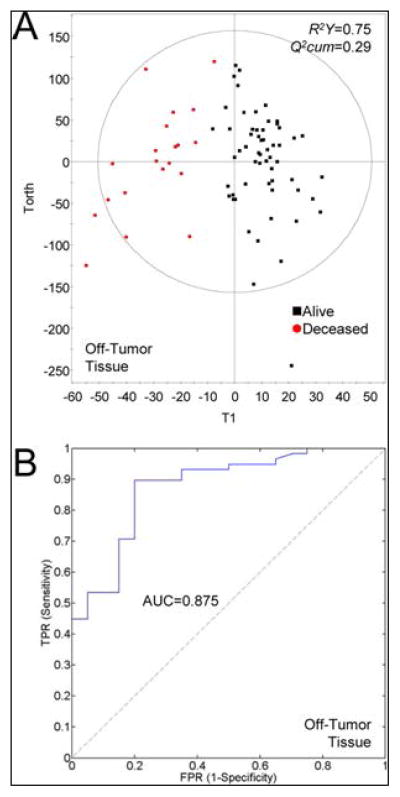
Survival prediction power for CRC using HRMAS metabolite fingerprints of tumor and off-tumor samples. (A) Scatter plot of the OPLS models of tumor and off-tumor tissue samples for patients alive (■) and deceased at 5 years after surgery (red ●). (B) ROC curve for the previous model. Reprinted with permission from153. Copyright 2013 American Chemical Society.
Being the products of bacterial fermentation, isobutyrate and acetate may indicate the possible role of the colonic microbiome in CRCa. Supporting this hypothesis, a product of bacterial cell wall degradation, isoglutamine, was found to be higher in CRCa cells than in OTT (p<0.05)153. Besides probable microbiota differences, metabolic differences between rectal and colonic cancer have been identified. Tissue samples obtained from colonic tumors were characterized by decreased levels of Lac (p<0.005) and increased levels of arginine and acetate (p<0.005) when compared to rectal cancer biopsies152.
Gastric cancer
Both cancerous and non-cancerous gastric samples have been studied to identify metabolites characterizing gastric tissue. About 40 metabolites, with only slight and non-significant differences in relative abundance between the samples, were identified by a study examining healthy gastric mucosa155. Examination of five gastric cancer tissue samples (Helicobacter pylori-positive with different tumor grades and differentiations) and 11 healthy controls found higher levels of lipids and Gly and changes in metabolite ratios such as the Cho/ChoCC and the ChoCC/Cr ratio to be indicative of gastric cancer. While the Cho/ChoCC ratio showed an increase from 1:5 in healthy tissues to 4:1 in cancerous ones, the ChoCC/Cr ratio decreased from 16:1 to 2.5:1 in cancer samples. As stated previously, larger amounts of Gly may be linked to altered glycolysis156.
In addition to gastric cancer, autoimmune gastritis and Helicobacter pylori-associated gastritis were examined in 27 subjects. Twelve healthy controls were compared to five samples in each of the three above-mentioned pathological conditions. Typical findings for gastric cancer were increased levels in free Cho, Gly, Ala, lipids, and triglycerides, with the latter only found in adenocarcinoma. Two ChoCC, phosphatidylcholine and glycerophosphocholine, decreased in cancerous samples. A similar ChoCC decrease was seen for autoimmune gastritis samples, highlighting their similarity to gastric neoplasia. Tissue with Heliobacter pylori-associated gastritis more resembled the healthy controls, with phosphorylcholine as the most abundant metabolite157.
Esophageal tissue
An HRMAS MRS study of 17 samples of Barrett’s metaplasia, a precursor of the esophageal adenocarcinoma, and 17 squamous epithelium tissue samples both obtained from 16 Barrett’s patients revealed metabolic alterations between the two tissue groups. In particular, a highly significant increase in the Cho/Cr ratio was seen in Barrett’s metaplasia (p<0.001)158. Results from analyzing tissue from 52 control subjects and 70 samples (32 tumor and 38 proximally histologically benign mucosa) from 35 esophageal cancer patients indicated metabolite changes in the various esophageal tissues. Applying PLS-DA on spectra of all samples, 5% of the profile showed a consistent change from healthy controls to benign mucosa to cancerous tissues from cancer patients. Metabolites that contributed to this relationship include phosphocholine and Glu and were suggested to be putative biomarkers. This study further created a model that could predict the three different types of tissue with high accuracy (p<0.01)159.
Lung cancer
Lung cancer (LuCa) is the leading cause of cancer death in the United States with 155,870 estimated deaths in 2017 alone5. Findings from HRMAS MRS studies on LuCa overlapped for many metabolites, with specific findings in Table 4. The main aim of these studies was to reveal metabolic differences between healthy and cancerous tissue and to use these results as a tool for disease discrimination. Results showed that Lac, ChoCC and Tau were consistently elevated in cancer, whereas Glc, acetate, myo-/scy-Ino and Gly were found to be decreased160–162. As previously discussed, the decrease in Glc and increase in Lac is likely linked to the Warburg effect, and the higher levels of ChoCC are markers for cell-proliferation. Differences in osmolytes such as myo-/scy-Ino might be linked to osmolytic shifts in tumor cells. Statistical analysis revealed significant changes in some metabolites when comparing tissue from centers of tumors with adjacent or parenchyma tissue from 17 patients [8 SCC, 7 adenocarcinoma (AC), 1 small cell lung carcinoma, and 1 malign mesothelioma]. Asp, Lac and PC/GPC showed increases from margin to tumor center (all p<0.05), whereas Glu and Val decreased progressively from margin to tumor center (all p<0.05). In addition, a positive correlation was seen between Lac and lipid levels (r=0.701, p<0.0001), but a negative correlation between Glc and Lac was observed (r=−0.439, p<0.005). Further, PCA and cross-validated OPLS-DA approaches were used to create a differentiation tool based on HRMAS MRS data. PCA could discriminate between the different sample origins – center, parenchyma, adjacent – and OPLS-DA differentiated stage I/II from III/IV and adenocarcinoma from squamous cell carcinoma (Figure 11)162.
Table 4.
Selected papers on lung cancer with metabolic findings highlighted. Samples in italics denote agreement between two or more studies.
| Study | Sample size | p - values | Metabolites elevated in lung cancer | Metabolites decreased in lung cancer |
|---|---|---|---|---|
|
| ||||
| Duarte161 | 24 patients, 26 tumor + 25 adjacent | Lac, UDP, GPC, Tau, GSH, PC | Gly, scy-ino, Glc, Lys, PE, methionine, acetate, myo-ino, | |
|
| ||||
| Rocha160 | 12 samples, 10 used for metabolomics, 2 for assignment and stuff | 0.0717 | Cho (+5%) | Acetate (−55%) |
| 0.706 | Cr (+29%) | Ala (−5%) | ||
| 0.847 | ||||
| 0.175 | GPC (+103%) | |||
| 0.00454 | Lactate (178%) | Glc(−68%) | ||
| 0.00868 | PCho (119%) | |||
| 6.09 × 10⁻⁷ | Tau (34%) | |||
| 0.0463 | ||||
| 0.171 | ||||
| 0.286 | Gly (−14%) | |||
| 0.0574 | Inosine/adenosine (−35%) | |||
| 0.0504 | Myo-inositol (−26%) | |||
| 0.101 | Phe (−36%) | |||
| 0.612 | Scy-ino (−26%) | |||
| 0.112 | Tyr (−34%) | |||
|
| ||||
| Chen162 | 17 patients, 3 samples from each | Lac, Ala, Asp, Tau, GPC, PCho, Lipids | Glc | |
|
| ||||
| Jordan163 | 14 tissue-serum pairs from 14 LuCa patients + 5 healthy serum controls | ANOVA p < 0.0005 | Significant differentiation between cases and controls | |
Figure 11.

The OPLS-DA score plots and the regression coefficient plots of the HRMAS 1H NMR spectra of lung tissue samples for various stages (n=50) and subtypes (n=44). (A) The OPLS-DA score plot and (B): the regression coefficient plot produced using only the group stage I–II and the group stage III–IV; (C) the OPLS-DA score plot and (D); the regression coefficient plot produced using only the class SCC and the class AC. Tissue at stage I–II (filled diamonds), tissue at stage III–IV (open diamonds), SCC tissue (dark triangles), AC tissue (open triangles)162.
Lung tissue HRMAS MRS results obtained from 24 tumor (11 adenocarcinoma, 4 epidermoid, 1 myofibroblastic, 3 carcinoid, 3 sarcomatoid, 2 large cell carcinoma) and 24 control samples classified 95% of the LuCa and 100% of the control samples correctly from a PLS-DA model. LuCa was characterized by elevated levels of PC, GPC, lipids, Cr, Tau, and Lac, whereas non-LuCa tissues typically showed higher amounts of acetate, methionine, and Glu. In addition to identifying LuCa from controls, metabolic differences among different tumor types, including epidermoid, carcinoid, and myofibroblastic, were observed. While the myofibroblastic type resembled the non-LuCa tissue, statistical analysis with PLS-DA allowed for proposed but unvalidated discriminations between adenocarcinoma and carcinoid or epidermoid subtypes161.
Besides measuring LuCa tissues, HRMAS MRS has been applied to search for new serum markers of LuCa by analyzing 14 tissue-serum pairs from LuCa patients (5 AC and 9 SCC) and 7 healthy serum controls. Although scientifically classified as liquids, using HRMAS on serum reduced the influence of serum macromolecules that hamper resolution in traditional liquid NMR. The study attempted to define metabolomic profiles of serum samples both independent of and linked to tissue metabolomic profiles of known pathology quantities. When metabolomic profiles generated from tissue spectra were applied to serum spectra, a significant differentiating power among the three serum groups (ANOVA p<0.0001) was observed. Metabolomic profiles generated solely from the serum spectra could also differentiate between SCCs and ACs (p<0.0001) and between control and AC samples (p<0.0005). This study emphasizes the possibility of applying HRMAS MRS not only on biopsies but also on serum to search for biomarkers and early diagnosis of LuCa as a screening tool163.
Kidney cancer
Kidneys face many metabolic challenges, as they are constantly exposed to osmotic stress and high oxygen needs. There exist two kinds of renal tissues, the cortex and the medulla, with different physiologic functions, and thus different metabolite activities. Kidney cancer tissues were among the few human specimens first analyzed by HRMAS MRS after the invention of the method in the late 1990s164. Since then, HRMAS MRS results have identified Gly and Tau to be typical in cortical renal tissues, and glycine-betaine and myo-Ino to be associated with the medulla, while various ChoCC are equally present in both tissue types. In addition, the same study of renal cell carcinoma (RCC), including three clear cell RCCs and two papillary RCCs, demonstrated decreases in the osmolytes myo-/scy-Ino that are likely due to osmotic imbalances in the tumor, and resulting increases in ChoCC165. Interestingly, esterification of FA to TGs to cholesterol represents a unique finding in clear cell carcinoma, probably indicating the involvement of cholesterolesters carcinogenesis165. Using PCA and LDA on HRMAS MRS data obtained from 22 tissue pairs of cancerous and adjacent kidney tissues, discrimination between adjacent benign kidney and RCC samples was achieved, and many metabolites were highly correlated with the PCs developed by statistical analysis (p<0.01)166.
For early stage kidney cancer, surgeries are considered as a curative therapy. However, other therapeutic approaches have also been subject to investigation. For example, the effects of radiofrequency ablation were examined by HRMAS MRS in 10 patients (mean 26.6-month post radiofrequency ablation) to confirm the status of ‘no-evidence-of-disease’ originally assessed by CT scans and histological evaluations. Thirty-seven tissue samples were acquired as ‘benign’ and ‘malignant’ controls from a separate cohort of patients undergoing nephrectomy. Using spectra characterized as ‘ablated’, ‘malignant’, and ‘normal’, HRMAS MRS results fully corroborated the CT scans to confirm the ‘no-evidence-of-disease’ status. The study also hoped to distinguish between viable and nonviable tissue for the purposes of helping to assess ablation margins. In viable tissue, reductions of the metabolites Cr, Cho, myo-Ino and cholesterol implied the absence of cancer (Figure 12)167.
Figure 12.
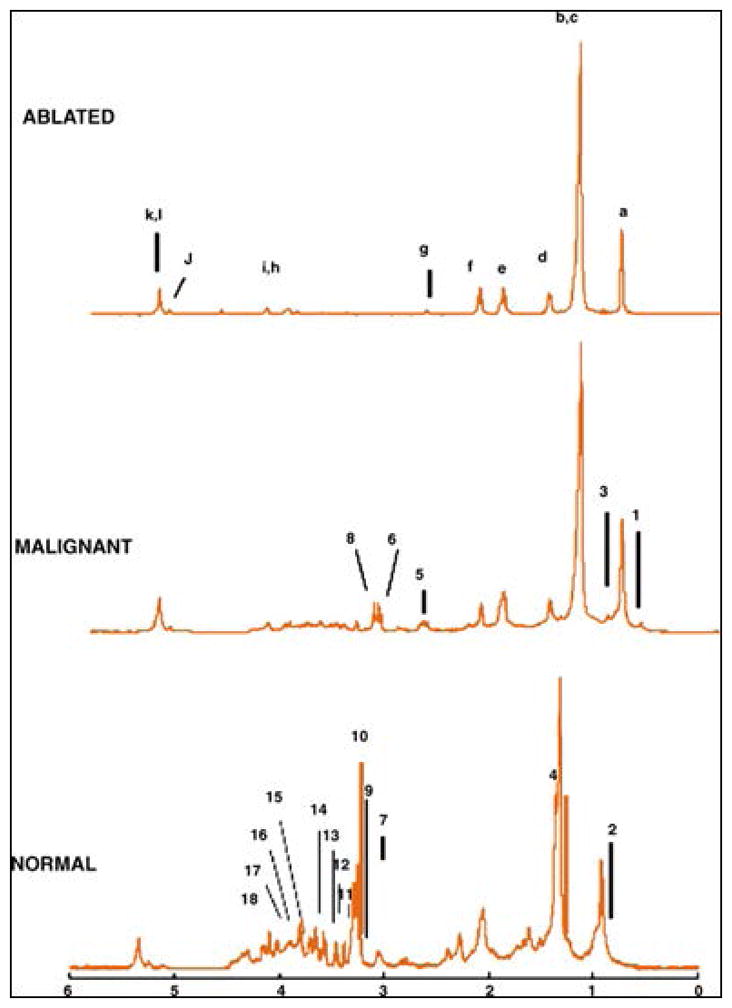
Representative magnetic angle spinning 1H spectra. (A) Ablated tumors. The peaks associated with lipid components are labeled by letters according to the chemical moiety within the triglyceride fragment seen above. Similar peaks in (B) malignant tumors and (C) normal tissue without ablation are unlabeled. Peaks labeled with numbers correlate to the following small molecular metabolites: (1) cholesterol (chol) C26, C27; (2) chol C21; (3) chol C19; (4) alanine (5) creatine/creatinine; (6) choline; (7) phosphorylcholine; (8) glycerophosphorylcholine, trimethylamine n-oxide, betaine, taurine; (9) UA singlet; (10) taurine; (11–12) myo-inositol; (13–16) amino acid and glucose resonances; (17) myo-inositol; (18) lactate167.
Glandular cancer
A 2011 article analyzed 13 paired samples from surgically resected thyroid tissues and fine-needle aspiration biopsies. These specimens comprised papillary thyroid carcinomas (n=4), follicular adenomas (n=4), and normal thyroid samples (n=5). PCA and ANOVA analyses delivered 4 PCs that could discern different spectral features in the three pathological types. Notably, data from cytological biopsies and histological tissues showed similar trends, and revealed statistical significances among their canonical scores (p<0.0003). Results indicated separation was possible between papillary carcinomas and benign samples (follicular adenoma and normal) (p<0.017) and between neoplastic (papillary carcinoma and adenoma) and normal tissue (p<0.016)168. Another study reported successful separation of thyroid neoplasia (papillary thyroid cancers, follicular lesions, and benign nodules) from controls obtained from the opposite healthy lobe169. Following OPLS-DA, lower lipids and higher Lac, Cho, Tau, and several other amino acids levels were observed in the neoplasm group (p<0.0001). In particular, the lipid trend may be explained through accelerated metabolic turnover and higher membrane biosynthesis for cell propagation. Furthermore, benign and malignant samples could be differentiated by Lac due to either the Warburg effect85,86 or hypoxia and ischemia in tumor tissues. Opposite levels of Tau and myo-/scy-Ino might relate to osmolyte imbalance (p<0.0001)170. HRMAS examination of cell samples from ex vivo fine-needle aspirations produced similar results to those of the previous study, especially for amino acids components169.
The adrenal glands also contain two functionally and structurally diverse tissues: adrenal cortex and medulla. The healthy portions of these compartments presented different metabolic hallmarks, with the cortex characterized by higher FA content (p<0.05) and absence of adrenaline and noradrenaline complexes171. Diseased, cortical adenomas (Ad) and adrenal cortical carcinomas (ACC) are difficult to differentiate with current diagnostic strategies172–174. Ad are more commonly benign and are less likely to degenerate into severe morbidities175,176, while ACC are less common but extremely aggressive, so separating them is crucial. Discrimination was possible, with significantly higher levels of Lac, acetate, and tChoCC characterizing ACC. Additionally, ACC displayed signs common to neoplasia: stimulated phospholipid turnover (higher ChoCC, p<0.05), anaerobic and glycolytic processes, and amino acids synthesis, probably due to the presence of necrotic tissues171.
Differentiating between benign and cancerous tissue is again difficult for tumorous pheochromocytomas (PCC). Recent metabolomic analysis, however, has shown the ability to separate PCCs from normal adrenal medulla based on several measured metabolites, including different noradrenaline/adrenaline ratios to indicate different activity of phenylethanolamine-N-methyltransferase. Noradrenaline was more abundant than adrenaline in PCC, while the trend was reversed in normal medulla (p<0.04). GABA and ascorbic acid levels were significantly altered when comparing PCC with normal medulla or ACC (p<0.05), and ascorbic acid seems to further positively correlate with noradrenaline, adrenaline, and their sums likely due to its involvement in catecholamine synthesis171. Another recent targeted metabolomic approach based on four metabolites (succinate, Glu, GSH, and adenosine triphosphate/adenosine diphosphate/adenosine monophosphate) was able to visualize the different profiles of apparently sporadic PCC, hereditary PCC, and those with germline mutations in succinate dehydrogenase subunits genes (accuracy > 80%, p=0.01)177.
Liver cancer
Analyses of 16 diseased liver tissue samples from biopsies or surgeries (3 cirrhosis, 1 liver metastasis and 12 hepatitis of different stages and etiologies) and one healthy sample obtained from autopsy detected trends in metabolites and metabolic ratios to describe differences in tissue pathologies178. The results showed levels of mobile FA, lipids, and Lac increasing from healthy to hepatitis to cirrhosis samples. Mobile FA presented as very characteristic of cirrhotic tissues. Metabolite ratios such as the Ala/Lys ratio decreased from 2.93 to 0.63 and 0.40 in hepatitis and cirrhosis cases, respectively. Furthermore, HRMAS MRS measurement of tissue from hepatitis-induced cirrhosis showed higher levels of glycogen178.
Hepatocellular carcinoma (HCC), as the most frequent malignant liver disease, was studied with 31 tissue samples from 17 patients, including 6 low grade and 11 high grade diseases. Fourteen adjacent tissue samples from these subjects were analyzed as controls. Lac, Cho, Cr and bile acids increased, while Glc and glycogen decreased in cancerous tissue. Among these changes, mechanical obstruction due to tumor growth may account for the observed increase in bile acid. It is also noteworthy that metabolites such as Glc and Lac differed between low and high grade HCC. In addition, Cr and Gln, elevated in HCC in general, show a further increase from low to high grade tumors. Using metabolic profiles obtained from HRMAS MRS, three different groups (non-involved/low-grade, non-involved/high-grade and low-grade/high-grade) can be differentiated with R2-values of 87.7%, 91.8% and 90.0%, respectively179.
Limited therapy options in many chronic liver diseases make liver transplantation the last possible therapeutic resort. To evaluate liver transplant status, biopsy samples from liver transplants were evaluated. Three biopsy samples (before removing the liver from the donor, at the end of cold storage, and after transplantation) were taken from each of the six studied livers. Among these transplanted livers, one patient developed post-graft dysfunction (PGD) with metabolic differences visible in the tissue spectrum. Unique to this sample, GPC did not decrease after transplantation, a change thought to indicate the beginning of the regeneration process in post-transplant tissue. Furthermore, the protective ‘University of Wisconsin solution’, used to perfuse the liver during cold storage, was seen in PGD spectra as a negative prognostic factor180.
Liposarcoma
Aiming to confirm and potentially improve diagnosis and grading for liposarcoma, analysis by HRMAS MRS has shown statistically significant differences among 30 common adipocyte and neoplastic tissue samples, with neoplastic samples subdivided into lipoma, well-differentiated, well-differentiated-sclerosing, myxoid/round cell, dedifferentiated, and pleomorphic. ChoCC and tricyglerides (TGs) showed noticeable alterations throughout the whole sample set. The intensities of N-methyl-choline increased steadily as the degree of differentiation within the sample decreased. It reached the highest values in the pleomorphic samples and could most significantly distinguish well-differentiated from myxoid/round-cell samples (p=0.0001). Despite their similarities in adipocyte composition, benign lipomas and the well-differentiated liposarcomas could be discriminated using N-methyl-choline peak intensities (p=0.002). Samples with higher mitotic rates, such as pleomorphic and dedifferentiated, also presented increased amounts of phosphatidylcholine (PtC). Triglycerides behaved oppositely, with the highest levels in regular adipose tissue and lipoma and the lowest levels in pleomorphic and dedifferentiated tissues, likely due to their consumption for membrane synthesis181. Although the small number of cases (~5 each) in subgroup prevents generalization of the results, the ability of Cho and its derivates to serve as biomarkers appears promising.
Therapy effects on liposarcomas were assessed with a comparison of 5 tissues from troglitazone-treated liposarcoma patients and 5 patients treated by surgery only, with normal surrounding tissue acquired as controls. With PCho production from PtC an indicator of tissue growth rate, an increase in PtC/PCho ratio implies a decrease in tissue growth rate. Two treated tissue samples showed a PtC/PCho ratio closer to that of the untreated liposarcomas, however, suggesting a poor response to therapy182.
Applications of HRMAS MRS on studies of other non-malignant diseases
In addition to the great amount of HRMAS MRS research conducted on malignant and neoplastic diseases, several studies evaluated non-malignant diseases to investigate metabolic changes linked to pathological mechanisms.
Neurodegenerative diseases
The first proof-of-principle HRMAS MRS study on human tissues was conducted in 1997 on 15 autopsy brain tissue samples from four different brains regions (primary visual cortex, superior temporal gyrus, superior frontal gyrus and inferior temporal gyrus) of a patient with Pick disease. This study, for the first time, demonstrated that direct and quantitative measurements of individual brain metabolites could be achieved with HRMAS to produce intact tissue MRS with high resolution comparable to that obtained from aqueous solution. This discovery allowed the study to present a linear correlation between neuronal losses and reductions in tissue NAA levels in this neurodegenerative disease, a reduction also consistently found in malignant neoplasia reports. As the most affected brain region from Pick disease, the rostral inferior temporal gyrus presented an overall NAA decrease to 20% of the histopathologically healthy control regions (p<0.0001). Notably, even in the less affected regions, the superior frontal and temporal gyrus, the overall NAA was 58% (p=0.007) of the controls183.
Further quantitative HRMAS MRS investigation of NAA and neuronal densities was conducted with autopsy brain samples of the superior temporal sulcus and frontal association cortex from Alzheimer’s disease (AD) patients (n=3) and healthy control subjects (n=4). The total NAA to Cr ratio acquired from the superior temporal sulcus was able to clearly and significantly separate AD patients from healthy controls (p<0.033), and an increase of PCho and a decrease of NAA were visible in AD samples. Most significantly, the study clearly demonstrated evidence of NAA as a marker for quantification of neuronal density by showing that total NAA concentration is linearly correlated (p<0.021)184.
Neurodegenerative diseases are not limited to the elderly, for children can suffer from various neurodegenerative disorders such as the neuronal ceroid lipofuscinoses (NCL). This class of diseases refers to some of the most frequent reasons for progressive childhood encephalopathies. Here, 14 NCL (9 CLN1, 4 CLN3) and nine control samples were analyzed. As CLN3 is associated with more moderate brain atrophy and greater life expectancy (16–35 years) than CLN1 (8–14 years), the finding that CLN3 samples showed little difference from controls accords moderately with clinical outcomes. PCA identified decreased levels of NAA and increased levels inositols, Cr, and Cho compounds in CLN1 brain tissue samples, which distinguished them from CLN3 and control samples. Furthermore, decreased levels of Glu and GABA in CLN1 were observed, symbolizing the neuronal deterioration that alters inhibitory and exhibitory neurotransmitters in the brain and results in myoclonic epilepsies185.
Amniotic fluid and gestational age
HRMAS experiments on amniotic fluid (AF) were concentrated on evaluations of gestational age (GA). Clinically, GA is assessed according to the time of last menstrual period and verified by crown-rump length ultrasound examination during the first 20 weeks of pregnancy. Unfortunately, evaluation at second trimester is not considered completely reliable due to the high variability in fetal size186–188. Since GA is of pivotal importance for the choice of labor induction and delivery treatments189,190, more accurate dating can improve clinical practice.
HRMAS MRS metabolic profiles of AF were generated for second and third gestation trimesters191,192. Using a targeted approach and measuring metabolite concentration through the Electronic Reference To access In vivo Concentrations (ERETIC) method10,193, HRMAS MRS results presented increases in creatinine and decreases in Glc, Cit, pyruvate, Cr, Ala, Glu, Lys, and valine with advancing GA (p<0.001). A linear GA prediction model (R2 = 0.926)191,192 was proposed that incorporated Ala, Cr, Glc, and Val. Interestingly, a better estimate was obtained for third trimester pregnancies, possibly due to the larger sample size (71 vs. 24 samples) or superior performance of the model in late gestation. Since AF collection through amniocentesis is an invasive procedure, the proposed model could have greater impact with the development of high resolution in vivo MRS techniques.
Cartilage tissue
A combination of metabolic changes and mechanical burden can lead to degenerative disc disease. HRMAS MRS examined intervertebral disc degeneration (IVDD), including eight Thompson grade 1, six Thompson grade 3, and six Thompson grade 5 punch biopsies from 17 discs of human cadaveric lumbar spines. Results showed statistically significant decreases changes (p<0.05) in two metabolite ratios according to increasing Thompson grade: N-acetyl/Cho, Cho/carbohydrate. Breakdown of chondroitin sulfate, an extracellular matrix component, leads to the observed reduction of N-acetyl and increased carbohydrate levels, evidencing disc degeneration194. HRMAS MRS results were further corroborated by proteoglycan assay, where amino acids derived from collagen (hyroxyproline, Gly) were found to be increased in anular disc tissue, indicating breakdown of the extracellular matrix component collagen. As occurs with matrix breakdown, a smaller N-acetyl peak enables the peaks of collagen-derived amino acids to be visualized since they occur at the same resonance. MRS results obtained from nuclear disc tissue were also verified by proteoglycan assay; nucleus disc tissue has less collagen, so instead a decrease in proteoglycans (PG) signified degeneration195.
In addition to linking collagen and proteoglycan breakdown with higher levels of hydroxyproline or proline, changes in carboxylic acids and alcohols were also identified as markers of degeneration. More specifically, scy-Ino and 2-propanol were shown to be the characteristic metabolites of degenerated discs from a study of 81 annulus samples (control n=21, IVDD n=60) from subjects undergoing surgery for degenerative disc disease or trauma, with the latter being used as controls. The measured metabolites were found to be age-dependent. In IVDD, the concentration of Lac and 2-propanol increased with the patient age, whereas the intensity of the n-acetyl-peak decreased. Furthermore, when considering energy metabolism in degenerative discs, reductions in Cr, an important ATP carrier, were found. The appearance of 2-propanol might be a consequence of a lack of energy metabolites that forces cells to find new ways to generate ATP, such as via ketone-based methods. Catabolic pathways such as ketone metabolism or anaerobic glycolysis lead to more acidic pH in tissue. Acidity slows down collagen synthesis and enhances the activity of matrix metalloproteinases which break down collagen196. It is noteworthy that statistically significant data has also been published on discogenic back pain. When compared to tissue samples obtained from scoliosis patients, patients with pain presented lower PG/collagen (p<0.05) and PG/Lac (p<0.05) but elevated Lac/collagen ratios, suggesting a lack of energy supply that again led to higher Lac and lower pH values197.
Skin
To study psoriasis arthritis, a rheumatic disease that affects the joints and the skin, skin biopsies were taken from three regions of the 10 patients: uninvolved skin, untreated psoriatic lesions, and psoriatic lesions treated with topical glucocorticoids for four weeks. During the four weeks of treatment and observation prior to the biopsy, seven patients showed a good response to the steroid with improvement in erythema and little tissue infiltration, whereas the other three responded poorly. The metablolomic studies performed on the skin tissue samples showed that the untreated psoriatic lesions were characterized by lower levels of Glc and myo-Ino, and increased levels of Cho (p<0.05), likely due to enhanced cell proliferation in psoriasis. However, since glucocorticoids act as an anti-proliferative and anti-inflammatory agent, skin biopsies taken from glucocorticoid-treated psoriatic skin lesions of good response presented a metabolic profile resembled that of the uninvolved tissue samples, with elevated Glc, myo-Ino, GPC, and Gly, and decreased Cho levels (p<0.05). Unsurprisingly, in samples from patients with poor response to the steroid, metabolite improvements were less pronounced198.
Cardiovascular
A metabolomics study of varicose vein tissues reported results from eight healthy controls and eight varicose vein samples. The metabolites Cr, myo-Ino and Lac were used to characterize the unhealthy tissue samples. Since Cr plays a major role as an energy supplier in muscle cells, muscle hypertrophy in the varicose samples showed larger amounts of Cr. On the other hand, the observed changes in myo-Ino and Lac were considered to be linked with the activation of NF-κB signaling pathway and hypoxic conditions in varicose veins, respectively. NF-κB signaling is involved in various pathways, most importantly in inflammatory response. Results from OPLS regression analysis were able to differentiate the two examined kinds of tissues based on metabolites (Figure 13), with an AUC of 0.92 indicating strong ROC curve accuracy199.
Figure 13.
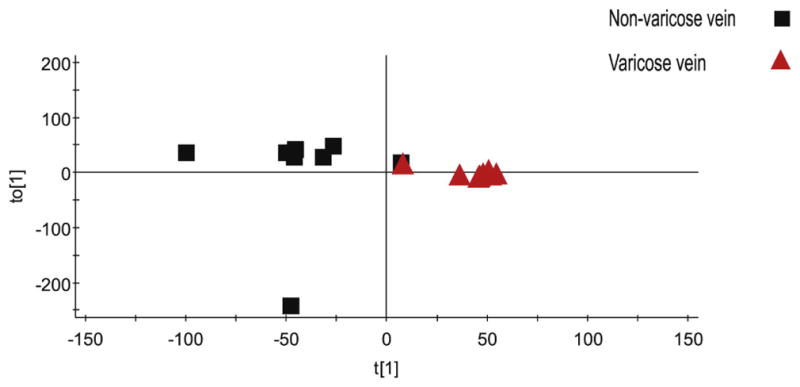
Orthogonal partial least square (OPLS) analysis separating the two classes (varicose and non-varicose veins) based on their metabolic profiles detected using MAS-1H NMR. Probabilistic quotient normalization and unit variance settings were applied for data analysis. R2Ycum was 0.788 and Q2cum was 0.406 for orthogonal component. Q2 indicates the fraction of variation predicted by the model for cross validation. One non-varicose vein samples is closer to the varicose veins group199.
Ex vivo HRMAS MRS studies on TGs within cardiac tissue were used to correlate results measured from in vivo MRS. While more often overabundant than not, TGs are critical to many pathological processes of the human heart, and improving accuracy of assessment can assist in diagnostics and disease management. In this study, biopsy samples from nine heart transplant patients demonstrated a statistically significant correlation (r2=0.83) with corresponding in vivo measurements200.
Summary of Metabolic Observations
In reviewing studies conducted on both malignant and non-malignant diseases, common metabolic biomarker trends became apparent for only the former, due to similar processes behind most malignant neoplasia. Specifically, many studies reported that malignant tissues are characterized by enhanced growth and proliferation, increasing cellular energy demand. Lowered levels of glucose and increased lactate production are observed in tumors, which the Warburg effect suggests are due to a shift in metabolism from oxidative phosphorylation to anaerobic glycolysis. Increased levels of growth-related ChoCC were also noted. As PtC is a major cell membrane constituent, high cell and cell membrane turnover may account for increased levels of ChoCC in tumor tissue. As a tumor grows, it can encounter the problem of self-induced hypoxia, where proliferation of tumor cells outraces that of supporting blood vessels. This phenomenon is directly linked to the aforementioned Warburg effect of increased anaerobic glycolysis, leading to higher levels of glycolysis-derived Ala and Gly in addition to triglycerides. Lipid accumulation is also a metabolic shift that is linked to necrosis, which occurs when tumor growth exceeds local oxygen and nutrient supply. Necrosis can also be induced by therapeutic radiation, and observed lipid accumulation could be indicative of successful therapy.
Malignant tumors were also characterized by an osmotic imbalance indicated by changes in Tau and myo- or scy-Ino. Whereas Tau may be an endogenous defense mechanism against cancer, myo-Ino is an activator of protein kinase C, which is involved in processes of more aggressive cerebral tumors.
Lastly, the effects of ‘metabolomic fields’, whereby cancer alters the metabolic profile of adjacent, histologically benign tissue to the tumor area, could better inform biopsy procedures or surgical margin resectioning to improve diagnostic approaches in the manifold field of oncology.
Technical Remarks
HRMAS MRS methodology has undergone significant transformation since its inception. The technique has expanded from initial, proof-of-concept research into feasibility of the method to analyze intact human tissue samples of various kinds, to differentiation of various diseases, to the proposal of MRS-based metabolomics, and to validation studies which are on the verge of translating identified metabolomic biomarkers to biological and clinical application. While HRMAS MRS remains an ex vivo technique, promising correlations with in vivo biomarker studies point to the next-generation diagnostic or prognostic advances with which the methodology can assist.
Nevertheless, we urge care in application of the technology. For instance, when comparing these ex vivo metabolomic results with disease phenotypes observed clinically or even other ex vivo studies, the same protocol and experimental conditions must be applied to yield comparable results. Care must be taken when comparing specimens collected or measured under different conditions. Specifically, specimens obtained for later analysis should be frozen within 30 min of removal from a patient to avoid changes in metabolites that occur after 60 min201. Analysis of tissue directly after excision vs. snap-frozen samples showed increased levels of 12 metabolites in frozen tissue, which might result from intracellular lysis and release of metabolites, cautioning direct comparison of fresh and frozen samples72. Fortunately for biobanked specimens, long-term storage prior to analysis shows no significant impact72.
With the increased dimensionality seen in metabolomics, multivariate analysis is increasingly becoming the method of choice for analyzing these data, for it reduces the data complexity in order to test the underlying scientific hypotheses. However, to avoid false significance arising, corrections for multiple comparisons, such as adjusted Bonferroni significance thresholds, should be used. Supervised statistical methods, such as discriminant analyses, return statistical outputs which highlight differences between samples, but these differences must be confirmed by applying the discriminant parameters to a testing or validation cohort202. Otherwise, conclusions drawn are not evidence supporting a hypothesis but merely proposal of one.
Concluding Remarks and Future Directions
Results from HRMAS MRS studies of a great variety of intact human tissue samples demonstrated the utility and future potential of the technique, rendering it capable of evaluating tissue metabolomic profiles associated with physiological and pathological processes. While the method is capable of measuring intact tissue metabolites present in a given specimen, it cannot further localize metabolites onto individual pathological features. Fortunately, recent developments in mass spectrometry imaging have enabled mapping of individual metabolites onto tissue pathologies at a single cell level. The combination of tissue metabolomics measured from HRMAS MRS with metabolites localized via mass spectrometry imaging can push the boundaries for how new in vivo MRS protocols may be designed and implemented to achieve non-invasive detection, characterization, and evaluation of therapies and diseases in clinic.
Table 3.
Selected papers on prostate cancer with metabolic findings highlighted, 2001–2016.
| Year | Author | Samples investigated | Metabolites elevated (in first named entity vs. second) | Metabolites decreased (in first named entity vs. second) |
|---|---|---|---|---|
| 2001 | Cheng94 | GS 6 and GS 7 vs. normal | Cit | |
| Vol% normal epithelia | Spm | |||
| 2003 | Swanson112 | PCa vs. healthy glandular tissue | ChoCC, Cho, Tau/Cr | Cit, PA |
| PCa vs. stromal tissue | ChoCC, Tau, myo/scy-inositol | |||
| High GS vs. lower GS | Cho | Cit, PA | ||
| 2005 | Cheng93 | Malignant vs. histo-benign (Hb) | PCho, Cho, | |
| Metabolite profiles correlate with PSA | ||||
| Hb tissue can predict pTNM and perineural invasion | ||||
| 2006 | Swanson113 | PCa vs. healthy glandular and stromal tissue | PC+GPC, tCho, Lac, Ala | Cit, PA |
| 2008 | van Asten115 | PCa vs. benign | tCho/Cit, Cho/Cr, (GPC+PC)/Cr, (tCho+Cr)/Cit, Lac/Ala | Cit/Cr |
| Tessem114 | PCa vs. benign | ChoCC, lactate, alanine | Cit, PA | |
| Swanson111 | PCa vs. benign | PC, GPC, PE, GPE | Eta | |
| 2009 | Stenman109 | PCa vs. benign | PC/GPC, PC/PE, PE/Eth, GPE/Eth, n-6-PUFAs | |
| 2010 | Maxeiner102 | BCR vs. non-BCR | Recurrence predicted with 78% accuracy from PCA and canonical analysis | |
| 2011 | Stenman110 | High tumor cell fraction vs. low | (GPCho + PCho)/Cre | myo-Ino/scy-Ino, Cho/Cre and scy-Ino/Cre; |
| Benign tissue adjacent to GS 7 vs. GS 6 | Cho/Cr | myo-Ino/scy-Ino | ||
| 2012 | Dittrich98 | High PSA velocity High PSA density |
Cit | |
| High free PSA % | Cit | |||
| 2013 | Selnaes107 | Gleason Score | (Cho+Cr+Spm)/Cit | |
| 2016 | Madhu101 | Degarelix-untreated PCa vs. treated and benign | Lac, Ala, tCho, PC+GPC |
Acknowledgments
CD would like to thank the German National Academic Foundation for its support of his work. FE dedicates his contribution to this work to Kathrin Bail and to the memory of Lena Herzog (2006 – 2016). FE gratefully acknowledges the Carl Duisberg Scholarship of the Bayer Science & Education Foundation and the support of the German Academic Exchange Service and the Manfred Lautenschläger Foundation. FP gratefully acknowledges Sardinia Regional Government (F.S.E. 2007–2013 UniCa) for the financial support of his PhD scholarship (P.O.R. Sardegna F.S.E. Operational Program of the Autonomous Region of Sardinia, European Social Fund 2007– 2013—Axis IV Human Resources, Objective l.3, Line of Activity l.3.1.). YJ acknowledges the Youth Project of Natural Science Foundation of China and the support of the Training Program for the outstanding young teachers of Nanjing Medical University.
Funding: This work was funded by PHS NIH grants CA115746, CA115746S2, and CA162959.
Abbreviations
- 2HG
2-hydroxyglutarate
- AC
adenocarcinoma
- ACC
adrenal cortical carcinoma
- AD
Alzheimer’s disease
- Ad
cortical adenoma
- AF
amniotic fluid
- Ala
alanine
- ANOVA
analysis of variance
- Asc
ascorbate
- Asn
asparagine
- Asp
aspartate
- AUC
area under curve
- BCR
biochemical recurrence
- Bet
betaine
- BrCa
breast cancer
- CeCa
cervical cancer
- CHKA
choline kinase alpha
- Cho
choline
- ChoCC
choline-containing compounds
- CIN
cervical intraepithelial neoplasia
- Cit
citrate
- Cr
creatine
- CRCa
colorectal cancer
- ER
estrogen receptor
- ERETIC
electronic reference to access in vivo concentrations
- Eta
ethanolamine
- FA
fatty acids
- fMRI
functional MRI
- Fum
fumarate
- GA
gestational age
- GABA
gamma-aminobutyric acid
- GBM
glioblastoma
- Glc
glucose
- Gln
glutamine
- Glu
glutamate
- Glx
glutamine+glutamate
- Gly
glycine
- GO
gene ontology
- GPC
glycerophosphocholine
- GPE
glycerophosphorylethanolamine
- GS
Gleason Score
- GSH
glutathione
- HCC
hepatocellular carcinoma
- HER2
human epidermal growth factor receptor 2
- His
histidine
- Histo-benign
histologically-benign
- HRMAS
high-resolution magic angle spinning
- hyp-Tau
hypo-taurine
- IVDD
intervertebral disc degeneration
- Ki-67
cellular proliferation marker
- Lac
lactate
- LDA
linear discriminant analysis
- Lip/MM
lipids/macromolecule
- LuCa
lung cancer
- Lys
lysine
- Mc
metabolic cluster
- MRI
magnetic resonance imaging
- MRS
magnetic resonance spectroscopy
- myo-Ino
myo-inositol
- n-6-PUFA
n-6-polyunsaturated fatty acid
- NAA
N-acetylaspartate
- NAC
neoadjuvant chemotherapy
- NCL
neuronal ceroid lipofuscinoses
- NF-κB
nuclear factor kappa-light-chain-enhancer of activated B cells
- OPLS-DA
orthogonal projections to latent structure-discriminant analysis
- OTT
off-tumor tissue
- PA
polyamines
- PC
principal component
- PCA
principal component analysis
- PCa
prostate cancer
- PCC
pheochromocytomas
- PCho
phosphocholine
- PCr
phosphocreatine
- PE
phosphoethanolamine
- PG
proteoglycan
- PGD
post-graft dysfunction
- Phe
phenylalanine
- PLS-DA
partial least square-discriminant analysis
- PNETs
primitive neuroectodermal tumors
- ppm
parts per million
- PR
progesterone receptor
- Pro
proline
- PtC
phosphatidylcholine
- RCC
renal cell carcinoma
- ROC
receiver-operating characteristic
- SCC
squamous cell carcinoma
- scy-Ino
scyllo-inositol
- Spm
spermine
- Tau
taurine
- tCho
total choline (GPC+PCho+Cho)
- tCr
total creatine
- TGs
triglycerides
- tGSH
total glutathione (reduced + glutathione disulfide)
- Thr
threonine
- TNBC
triple negative BrCa
- TNM status
tumor, lymph node infiltration, and metastasis status
- TPBC
triple positive BrCa
- TUNEL
deoxynucleotidyl transferase biotin-dUTP nick end labelling
- Tyr
tyrosine
- Val
valine
- vol%
volume percentage
- α-Haa
hydrogen bonded to α-carbon of amino acids
Footnotes
Competing Interests: The authors acknowledge no competing financial interests.
Author Contributions: CD, research, writing; FE; research, writing; FP: research, writing; LAV: research, writing; YJ: research, writing; VS: research; VD: research; PH: writing; JK: writing; LLC: research, writing, funding.
References Cited
- 1.Kaebisch E, Fuss TL, Vandergrift LA, Toews K, Habbel P, Cheng LL. Applications of high-resolution magic angle spinning MRS in biomedical studies I-cell line and animal models. NMR in biomedicine. 2017 doi: 10.1002/nbm.3700. [DOI] [PMC free article] [PubMed] [Google Scholar]
- 2.Papas KK, Colton CK, Gounarides JS, et al. NMR spectroscopy in beta cell engineering and islet transplantation. Ann N Y Acad Sci. 2001;944:96–119. doi: 10.1111/j.1749-6632.2001.tb03826.x. [DOI] [PubMed] [Google Scholar]
- 3.Ippolito JE, Merritt ME, Backhed F, et al. Linkage between cellular communications, energy utilization, and proliferation in metastatic neuroendocrine cancers. Proceedings of the National Academy of Sciences of the United States of America. 2006;103(33):12505–12510. doi: 10.1073/pnas.0605207103. [DOI] [PMC free article] [PubMed] [Google Scholar]
- 4.Nyblom HK, Nord LI, Andersson R, Kenne L, Bergsten P. Glucose-induced de novo synthesis of fatty acyls causes proportional increases in INS-1E cellular lipids. NMR Biomed. 2008;21(4):357–365. doi: 10.1002/nbm.1197. [DOI] [PubMed] [Google Scholar]
- 5.Siegel RL, Miller KD, Jemal A. Cancer Statistics, 2017. CA: a cancer journal for clinicians. 2017;67(1):7–30. doi: 10.3322/caac.21387. [DOI] [PubMed] [Google Scholar]
- 6.Andronesi OC, Blekas KD, Mintzopoulos D, Astrakas L, Black PM, Tzika AA. Molecular classification of brain tumor biopsies using solid-state magic angle spinning proton magnetic resonance spectroscopy and robust classifiers. Int J Oncol. 2008;33(5):1017–1025. doi: 10.3892/ijo_00000000. [DOI] [PMC free article] [PubMed] [Google Scholar]
- 7.Andronesi OC, Kim GS, Gerstner E, et al. Detection of 2-hydroxyglutarate in IDH-mutated glioma patients by in vivo spectral-editing and 2D correlation magnetic resonance spectroscopy. Sci Transl Med. 2012;4(116):116ra114. doi: 10.1126/scitranslmed.3002693. [DOI] [PMC free article] [PubMed] [Google Scholar]
- 8.Chen W, Lou H, Zhang H, et al. Grade classification of neuroepithelial tumors using high-resolution magic-angle spinning proton nuclear magnetic resonance spectroscopy and pattern recognition. Sci China Life Sci. 2011;54(7):606–616. doi: 10.1007/s11427-011-4193-7. [DOI] [PubMed] [Google Scholar]
- 9.Cheng LL, Chang IW, Louis DN, Gonzalez RG. Correlation of high-resolution magic angle spinning proton magnetic resonance spectroscopy with histopathology of intact human brain tumor specimens. Cancer research. 1998;58(9):1825–1832. [PubMed] [Google Scholar]
- 10.Constantin A, Elkhaled A, Jalbert L, et al. Identifying malignant transformations in recurrent low grade gliomas using high resolution magic angle spinning spectroscopy. Artif Intell Med. 2012;55(1):61–70. doi: 10.1016/j.artmed.2012.01.002. [DOI] [PMC free article] [PubMed] [Google Scholar]
- 11.Cuellar-Baena S, Morales JM, Martinetto H, et al. Comparative metabolic profiling of paediatric ependymoma, medulloblastoma and pilocytic astrocytoma. International journal of molecular medicine. 2010;26(6):941–948. doi: 10.3892/ijmm_00000546. [DOI] [PubMed] [Google Scholar]
- 12.Davies NP, Wilson M, Harris LM, et al. Identification and characterisation of childhood cerebellar tumours by in vivo proton MRS. NMR in biomedicine. 2008;21(8):908–918. doi: 10.1002/nbm.1283. [DOI] [PubMed] [Google Scholar]
- 13.Davies NP, Wilson M, Natarajan K, et al. Non-invasive detection of glycine as a biomarker of malignancy in childhood brain tumours using in-vivo 1H MRS at 1.5 tesla confirmed by ex-vivo high-resolution magic-angle spinning NMR. NMR in biomedicine. 2010;23(1):80–87. doi: 10.1002/nbm.1432. [DOI] [PubMed] [Google Scholar]
- 14.Elkhaled A, Jalbert LE, Phillips JJ, et al. Magnetic resonance of 2-hydroxyglutarate in IDH1-mutated low-grade gliomas. Sci Transl Med. 2012;4(116):116ra115. doi: 10.1126/scitranslmed.3002796. [DOI] [PMC free article] [PubMed] [Google Scholar]
- 15.Elkhaled A, Jalbert L, Constantin A, et al. Characterization of metabolites in infiltrating gliomas using ex vivo (1)H high-resolution magic angle spinning spectroscopy. NMR in biomedicine. 2014;27(5):578–593. doi: 10.1002/nbm.3097. [DOI] [PMC free article] [PubMed] [Google Scholar]
- 16.Erb G, Elbayed K, Piotto M, et al. Toward improved grading of malignancy in oligodendrogliomas using metabolomics. Magnetic resonance in medicine. 2008;59(5):959–965. doi: 10.1002/mrm.21486. [DOI] [PubMed] [Google Scholar]
- 17.Esteve V, Celda B, Martinez-Bisbal MC. Use of 1H and 31P HRMAS to evaluate the relationship between quantitative alterations in metabolite concentrations and tissue features in human brain tumour biopsies. Anal Bioanal Chem. 2012;403(9):2611–2625. doi: 10.1007/s00216-012-6001-z. [DOI] [PubMed] [Google Scholar]
- 18.Kohe S, Brundler MA, Jenkinson H, et al. Metabolite profiling in retinoblastoma identifies novel clinicopathological subgroups. British journal of cancer. 2015;113(8):1216–1224. doi: 10.1038/bjc.2015.318. [DOI] [PMC free article] [PubMed] [Google Scholar]
- 19.Martinez-Bisbal MC, Marti-Bonmati L, Piquer J, et al. 1H and 13C HR-MAS spectroscopy of intact biopsy samples ex vivo and in vivo 1H MRS study of human high grade gliomas. NMR in biomedicine. 2004;17(4):191–205. doi: 10.1002/nbm.888. [DOI] [PubMed] [Google Scholar]
- 20.McKnight TR, Smith KJ, Chu PW, et al. Choline metabolism, proliferation, and angiogenesis in nonenhancing grades 2 and 3 astrocytoma. Journal of magnetic resonance imaging : JMRI. 2011;33(4):808–816. doi: 10.1002/jmri.22517. [DOI] [PMC free article] [PubMed] [Google Scholar]
- 21.Metsis V, Huang H, Andronesi OC, Makedon F, Tzika A. Heterogeneous data fusion for brain tumor classification. Oncology reports. 2012;28(4):1413–1416. doi: 10.3892/or.2012.1931. [DOI] [PubMed] [Google Scholar]
- 22.Monleon D, Morales JM, Gonzalez-Darder J, et al. Benign and atypical meningioma metabolic signatures by high-resolution magic-angle spinning molecular profiling. Journal of proteome research. 2008;7(7):2882–2888. doi: 10.1021/pr800110a. [DOI] [PubMed] [Google Scholar]
- 23.Monleon D, Morales JM, Gonzalez-Segura A, et al. Metabolic aggressiveness in benign meningiomas with chromosomal instabilities. Cancer research. 2010;70(21):8426–8434. doi: 10.1158/0008-5472.CAN-10-1498. [DOI] [PubMed] [Google Scholar]
- 24.Opstad KS, Bell BA, Griffiths JR, Howe FA. Toward accurate quantification of metabolites, lipids, and macromolecules in HRMAS spectra of human brain tumor biopsies using LCModel. Magnetic resonance in medicine. 2008;60(5):1237–1242. doi: 10.1002/mrm.21496. [DOI] [PubMed] [Google Scholar]
- 25.Opstad KS, Bell BA, Griffiths JR, Howe FA. Taurine: a potential marker of apoptosis in gliomas. British journal of cancer. 2009;100(5):789–794. doi: 10.1038/sj.bjc.6604933. [DOI] [PMC free article] [PubMed] [Google Scholar]
- 26.Opstad KS, Wright AJ, Bell BA, Griffiths JR, Howe FA. Correlations between in vivo (1)H MRS and ex vivo (1)H HRMAS metabolite measurements in adult human gliomas. Journal of magnetic resonance imaging : JMRI. 2010;31(2):289–297. doi: 10.1002/jmri.22039. [DOI] [PubMed] [Google Scholar]
- 27.Piccirillo SG, Dietz S, Madhu B, et al. Fluorescence-guided surgical sampling of glioblastoma identifies phenotypically distinct tumour-initiating cell populations in the tumour mass and margin. British journal of cancer. 2012;107(3):462–468. doi: 10.1038/bjc.2012.271. [DOI] [PMC free article] [PubMed] [Google Scholar]
- 28.Poullet JB, Martinez-Bisbal MC, Valverde D, et al. Quantification and classification of high-resolution magic angle spinning data for brain tumor diagnosis. Conf Proc IEEE Eng Med Biol Soc. 2007;2007:5407–5410. doi: 10.1109/IEMBS.2007.4353565. [DOI] [PubMed] [Google Scholar]
- 29.Righi V, Roda JM, Paz J, et al. 1H HR-MAS and genomic analysis of human tumor biopsies discriminate between high and low grade astrocytomas. NMR in biomedicine. 2009;22(6):629–637. doi: 10.1002/nbm.1377. [DOI] [PubMed] [Google Scholar]
- 30.Righi V, Andronesi OC, Mintzopoulos D, Black PM, Tzika AA. High-resolution magic angle spinning magnetic resonance spectroscopy detects glycine as a biomarker in brain tumors. Int J Oncol. 2010;36(2):301–306. doi: 10.3892/ijo_00000500. [DOI] [PMC free article] [PubMed] [Google Scholar]
- 31.Righi V, Tugnoli V, Mucci A, Bacci A, Bonora S, Schenetti L. MRS study of meningeal hemangiopericytoma and edema: a comparison with meningothelial meningioma. Oncology reports. 2012;28(4):1461–1467. doi: 10.3892/or.2012.1919. [DOI] [PubMed] [Google Scholar]
- 32.Croitor Sava A, Sima DM, Martinez-Bisbal MC, Celda B, Van Huffel S. Non-negative blind source separation techniques for tumor tissue typing using HR-MAS signals. Conf Proc IEEE Eng Med Biol Soc. 2010;2010:3658–3661. doi: 10.1109/IEMBS.2010.5627436. [DOI] [PubMed] [Google Scholar]
- 33.Croitor Sava A, Martinez-Bisbal MC, Van Huffel S, Cerda JM, Sima DM, Celda B. Ex vivo high resolution magic angle spinning metabolic profiles describe intratumoral histopathological tissue properties in adult human gliomas. Magnetic resonance in medicine. 2011;65(2):320–328. doi: 10.1002/mrm.22619. [DOI] [PubMed] [Google Scholar]
- 34.Sjobakk TE, Johansen R, Bathen TF, et al. Characterization of brain metastases using high-resolution magic angle spinning MRS. NMR in biomedicine. 2008;21(2):175–185. doi: 10.1002/nbm.1180. [DOI] [PubMed] [Google Scholar]
- 35.Sjobakk TE, Vettukattil R, Gulati M, et al. Metabolic profiles of brain metastases. Int J Mol Sci. 2013;14(1):2104–2118. doi: 10.3390/ijms14012104. [DOI] [PMC free article] [PubMed] [Google Scholar]
- 36.Tugnoli V, Schenetti L, Mucci A, et al. Ex vivo HR-MAS MRS of human meningiomas: a comparison with in vivo 1H MR spectra. International journal of molecular medicine. 2006;18(5):859–869. [PubMed] [Google Scholar]
- 37.Tzika AA, Cheng LL, Goumnerova L, et al. Biochemical characterization of pediatric brain tumors by using in vivo and ex vivo magnetic resonance spectroscopy. J Neurosurg. 2002;96(6):1023–1031. doi: 10.3171/jns.2002.96.6.1023. [DOI] [PubMed] [Google Scholar]
- 38.Tzika AA, Astrakas L, Cao H, et al. Combination of high-resolution magic angle spinning proton magnetic resonance spectroscopy and microscale genomics to type brain tumor biopsies. International journal of molecular medicine. 2007;20(2):199–208. [PubMed] [Google Scholar]
- 39.Valverde-Saubi D, Candiota AP, Molins MA, et al. Short-term temperature effect on the HRMAS spectra of human brain tumor biopsies and their pattern recognition analysis. Magma (New York, NY) 2010;23(4):203–215. doi: 10.1007/s10334-010-0218-7. [DOI] [PubMed] [Google Scholar]
- 40.Vettukattil R, Gulati M, Sjobakk TE, et al. Differentiating diffuse World Health Organization grade II and IV astrocytomas with ex vivo magnetic resonance spectroscopy. Neurosurgery. 2013;72(2):186–195. doi: 10.1227/NEU.0b013e31827b9c57. discussion 195. [DOI] [PubMed] [Google Scholar]
- 41.Wilson M, Davies NP, Brundler MA, McConville C, Grundy RG, Peet AC. High resolution magic angle spinning 1H NMR of childhood brain and nervous system tumours. Mol Cancer. 2009;8:6. doi: 10.1186/1476-4598-8-6. [DOI] [PMC free article] [PubMed] [Google Scholar]
- 42.Wilson M, Davies NP, Grundy RG, Peet AC. A quantitative comparison of metabolite signals as detected by in vivo MRS with ex vivo 1H HR-MAS for childhood brain tumours. NMR in biomedicine. 2009;22(2):213–219. doi: 10.1002/nbm.1306. [DOI] [PubMed] [Google Scholar]
- 43.Wright AJ, Fellows GA, Griffiths JR, Wilson M, Bell BA, Howe FA. Ex-vivo HRMAS of adult brain tumours: metabolite quantification and assignment of tumour biomarkers. Mol Cancer. 2010;9:66. doi: 10.1186/1476-4598-9-66. [DOI] [PMC free article] [PubMed] [Google Scholar]
- 44.Yeh IB, Xu M, Ng WH, Ye J, Yang D, Lim CC. Central neurocytoma: typical magnetic resonance spectroscopy findings and atypical ventricular dissemination. Magn Reson Imaging. 2008;26(1):59–64. doi: 10.1016/j.mri.2007.04.005. [DOI] [PubMed] [Google Scholar]
- 45.Cheng LL, Anthony DC, Comite AR, Black PM, Tzika AA, Gonzalez RG. Quantification of microheterogeneity in glioblastoma multiforme with ex vivo high-resolution magic-angle spinning (HRMAS) proton magnetic resonance spectroscopy. Neuro Oncol. 2000;2(2):87–95. doi: 10.1093/neuonc/2.2.87. [DOI] [PMC free article] [PubMed] [Google Scholar]
- 46.Chow LM, Endersby R, Zhu X, et al. Cooperativity within and among Pten, p53, and Rb pathways induces high-grade astrocytoma in adult brain. Cancer Cell. 2011;19(3):305–316. doi: 10.1016/j.ccr.2011.01.039. [DOI] [PMC free article] [PubMed] [Google Scholar]
- 47.Glunde K, Bhujwalla ZM, Ronen SM. Choline metabolism in malignant transformation. Nature reviews Cancer. 2011;11(12):835–848. doi: 10.1038/nrc3162. [DOI] [PMC free article] [PubMed] [Google Scholar]
- 48.Jaeckle KA, Decker PA, Ballman KV, et al. Transformation of low grade glioma and correlation with outcome: an NCCTG database analysis. J Neurooncol. 2011;104(1):253–259. doi: 10.1007/s11060-010-0476-2. [DOI] [PMC free article] [PubMed] [Google Scholar]
- 49.McNeill KA. Epidemiology of Brain Tumors. Neurologic clinics. 2016;34(4):981–998. doi: 10.1016/j.ncl.2016.06.014. [DOI] [PubMed] [Google Scholar]
- 50.Ostrom QT, de Blank PM, Kruchko C, et al. Alex’s Lemonade Stand Foundation Infant and Childhood Primary Brain and Central Nervous System Tumors Diagnosed in the United States in 2007–2011. Neuro Oncol. 2015;16(Suppl 10):x1–x36. doi: 10.1093/neuonc/nou327. [DOI] [PMC free article] [PubMed] [Google Scholar]
- 51.Phillips HS, Kharbanda S, Chen R, et al. Molecular subclasses of high-grade glioma predict prognosis, delineate a pattern of disease progression, and resemble stages in neurogenesis. Cancer Cell. 2006;9(3):157–173. doi: 10.1016/j.ccr.2006.02.019. [DOI] [PubMed] [Google Scholar]
- 52.Yan H, Parsons DW, Jin G, et al. IDH1 and IDH2 mutations in gliomas. The New England journal of medicine. 2009;360(8):765–773. doi: 10.1056/NEJMoa0808710. [DOI] [PMC free article] [PubMed] [Google Scholar]
- 53.Louis DN, Perry A, Reifenberger G, et al. The 2016 World Health Organization Classification of Tumors of the Central Nervous System: a summary. Acta Neuropathol. 2016;131(6):803–820. doi: 10.1007/s00401-016-1545-1. [DOI] [PubMed] [Google Scholar]
- 54.Cheng LL, Chang IW, Smith BL, Gonzalez RG. Evaluating human breast ductal carcinomas with high-resolution magic-angle spinning proton magnetic resonance spectroscopy. Journal of magnetic resonance (San Diego, Calif : 1997) 1998;135(1):194–202. doi: 10.1006/jmre.1998.1578. [DOI] [PubMed] [Google Scholar]
- 55.Sitter B, Lundgren S, Bathen TF, Halgunset J, Fjosne HE, Gribbestad IS. Comparison of HR MAS MR spectroscopic profiles of breast cancer tissue with clinical parameters. NMR in biomedicine. 2006;19(1):30–40. doi: 10.1002/nbm.992. [DOI] [PubMed] [Google Scholar]
- 56.Borgan E, Sitter B, Lingjaerde OC, et al. Merging transcriptomics and metabolomics--advances in breast cancer profiling. BMC cancer. 2010;10:628. doi: 10.1186/1471-2407-10-628. [DOI] [PMC free article] [PubMed] [Google Scholar]
- 57.Sitter B, Bathen TF, Singstad TE, et al. Quantification of metabolites in breast cancer patients with different clinical prognosis using HR MAS MR spectroscopy. NMR in biomedicine. 2010;23(4):424–431. doi: 10.1002/nbm.1478. [DOI] [PubMed] [Google Scholar]
- 58.Giskeodegard GF, Grinde MT, Sitter B, et al. Multivariate modeling and prediction of breast cancer prognostic factors using MR metabolomics. Journal of proteome research. 2010;9(2):972–979. doi: 10.1021/pr9008783. [DOI] [PubMed] [Google Scholar]
- 59.Li M, Song Y, Cho N, et al. An HR-MAS MR metabolomics study on breast tissues obtained with core needle biopsy. PloS one. 2011;6(10):e25563. doi: 10.1371/journal.pone.0025563. [DOI] [PMC free article] [PubMed] [Google Scholar]
- 60.Klomp DW, van de Bank BL, Raaijmakers A, et al. 31P MRSI and 1H MRS at 7 T: initial results in human breast cancer. NMR in biomedicine. 2011;24(10):1337–1342. doi: 10.1002/nbm.1696. [DOI] [PubMed] [Google Scholar]
- 61.Choi JS, Baek HM, Kim S, et al. HR-MAS MR spectroscopy of breast cancer tissue obtained with core needle biopsy: correlation with prognostic factors. PloS one. 2012;7(12):e51712. doi: 10.1371/journal.pone.0051712. [DOI] [PMC free article] [PubMed] [Google Scholar]
- 62.Giskeodegard GF, Lundgren S, Sitter B, et al. Lactate and glycine-potential MR biomarkers of prognosis in estrogen receptor-positive breast cancers. NMR in biomedicine. 2012;25(11):1271–1279. doi: 10.1002/nbm.2798. [DOI] [PubMed] [Google Scholar]
- 63.Cao MD, Giskeodegard GF, Bathen TF, et al. Prognostic value of metabolic response in breast cancer patients receiving neoadjuvant chemotherapy. BMC cancer. 2012;12:39. doi: 10.1186/1471-2407-12-39. [DOI] [PMC free article] [PubMed] [Google Scholar]
- 64.Cao MD, Sitter B, Bathen TF, et al. Predicting long-term survival and treatment response in breast cancer patients receiving neoadjuvant chemotherapy by MR metabolic profiling. NMR in biomedicine. 2012;25(2):369–378. doi: 10.1002/nbm.1762. [DOI] [PubMed] [Google Scholar]
- 65.Choi JS, Baek HM, Kim S, et al. Magnetic resonance metabolic profiling of breast cancer tissue obtained with core needle biopsy for predicting pathologic response to neoadjuvant chemotherapy. PloS one. 2013;8(12):e83866. doi: 10.1371/journal.pone.0083866. [DOI] [PMC free article] [PubMed] [Google Scholar]
- 66.Bathen TF, Geurts B, Sitter B, et al. Feasibility of MR metabolomics for immediate analysis of resection margins during breast cancer surgery. PloS one. 2013;8(4):e61578. doi: 10.1371/journal.pone.0061578. [DOI] [PMC free article] [PubMed] [Google Scholar]
- 67.Cao MD, Lamichhane S, Lundgren S, et al. Metabolic characterization of triple negative breast cancer. BMC cancer. 2014;14:941. doi: 10.1186/1471-2407-14-941. [DOI] [PMC free article] [PubMed] [Google Scholar]
- 68.Chae EY, Shin HJ, Kim S, et al. The Role of High-Resolution Magic Angle Spinning 1H Nuclear Magnetic Resonance Spectroscopy for Predicting the Invasive Component in Patients with Ductal Carcinoma In Situ Diagnosed on Preoperative Biopsy. PloS one. 2016;11(8):e0161038. doi: 10.1371/journal.pone.0161038. [DOI] [PMC free article] [PubMed] [Google Scholar]
- 69.Yoon H, Yoon D, Yun M, et al. Metabolomics of Breast Cancer Using High-Resolution Magic Angle Spinning Magnetic Resonance Spectroscopy: Correlations with 18F-FDG Positron Emission Tomography-Computed Tomography, Dynamic Contrast-Enhanced and Diffusion-Weighted Imaging MRI. PloS one. 2016;11(7):e0159949. doi: 10.1371/journal.pone.0159949. [DOI] [PMC free article] [PubMed] [Google Scholar]
- 70.Haukaas TH, Euceda LR, Giskeodegard GF, et al. Metabolic clusters of breast cancer in relation to gene- and protein expression subtypes. Cancer & metabolism. 2016;4:12. doi: 10.1186/s40170-016-0152-x. [DOI] [PMC free article] [PubMed] [Google Scholar]
- 71.Park VY, Yoon D, Koo JS, et al. Intratumoral Agreement of High-Resolution Magic Angle Spinning Magnetic Resonance Spectroscopic Profiles in the Metabolic Characterization of Breast Cancer. Medicine. 2016;95(15):e3398. doi: 10.1097/MD.0000000000003398. [DOI] [PMC free article] [PubMed] [Google Scholar]
- 72.Haukaas TH, Moestue SA, Vettukattil R, et al. Impact of Freezing Delay Time on Tissue Samples for Metabolomic Studies. Frontiers in oncology. 2016;6:17. doi: 10.3389/fonc.2016.00017. [DOI] [PMC free article] [PubMed] [Google Scholar]
- 73.Bathen TF, Jensen LR, Sitter B, et al. MR-determined metabolic phenotype of breast cancer in prediction of lymphatic spread, grade, and hormone status. Breast cancer research and treatment. 2007;104(2):181–189. doi: 10.1007/s10549-006-9400-z. [DOI] [PubMed] [Google Scholar]
- 74.Podo F. Tumour phospholipid metabolism. NMR in biomedicine. 1999;12(7):413–439. doi: 10.1002/(sici)1099-1492(199911)12:7<413::aid-nbm587>3.0.co;2-u. [DOI] [PubMed] [Google Scholar]
- 75.Negendank W. Studies of human tumors by MRS: a review. NMR in biomedicine. 1992;5(5):303–324. doi: 10.1002/nbm.1940050518. [DOI] [PubMed] [Google Scholar]
- 76.Gribbestad IS, Sitter B, Lundgren S, Krane J, Axelson D. Metabolite composition in breast tumors examined by proton nuclear magnetic resonance spectroscopy. Anticancer research. 1999;19(3a):1737–1746. [PubMed] [Google Scholar]
- 77.Beckonert O, Monnerjahn J, Bonk U, Leibfritz D. Visualizing metabolic changes in breast-cancer tissue using 1H-NMR spectroscopy and self-organizing maps. NMR in biomedicine. 2003;16(1):1–11. doi: 10.1002/nbm.797. [DOI] [PubMed] [Google Scholar]
- 78.Gribbestad IS, Fjosne HE, Haugen OA, et al. In vitro proton NMR spectroscopy of extracts from human breast tumours and non-involved breast tissue. Anticancer research. 1993;13(6a):1973–1980. [PubMed] [Google Scholar]
- 79.Mackinnon WB, Barry PA, Malycha PL, et al. Fine-needle biopsy specimens of benign breast lesions distinguished from invasive cancer ex vivo with proton MR spectroscopy. Radiology. 1997;204(3):661–666. doi: 10.1148/radiology.204.3.9280241. [DOI] [PubMed] [Google Scholar]
- 80.Nakagami K, Uchida T, Ohwada S, Koibuchi Y, Morishita Y. Increased choline kinase activity in 1,2-dimethylhydrazine-induced rat colon cancer. Japanese journal of cancer research : Gann. 1999;90(11):1212–1217. doi: 10.1111/j.1349-7006.1999.tb00698.x. [DOI] [PMC free article] [PubMed] [Google Scholar]
- 81.Ramirez de Molina A, Gutierrez R, Ramos MA, et al. Increased choline kinase activity in human breast carcinomas: clinical evidence for a potential novel antitumor strategy. Oncogene. 2002;21(27):4317–4322. doi: 10.1038/sj.onc.1205556. [DOI] [PubMed] [Google Scholar]
- 82.Granata A, Nicoletti R, Tinaglia V, et al. Choline kinase-alpha by regulating cell aggressiveness and drug sensitivity is a potential druggable target for ovarian cancer. British journal of cancer. 2014;110(2):330–340. doi: 10.1038/bjc.2013.729. [DOI] [PMC free article] [PubMed] [Google Scholar]
- 83.Mori N, Glunde K, Takagi T, Raman V, Bhujwalla ZM. Choline kinase down-regulation increases the effect of 5-fluorouracil in breast cancer cells. Cancer research. 2007;67(23):11284–11290. doi: 10.1158/0008-5472.CAN-07-2728. [DOI] [PubMed] [Google Scholar]
- 84.Shah T, Wildes F, Penet MF, et al. Choline kinase overexpression increases invasiveness and drug resistance of human breast cancer cells. NMR in biomedicine. 2010;23(6):633–642. doi: 10.1002/nbm.1510. [DOI] [PMC free article] [PubMed] [Google Scholar]
- 85.Warburg O, Wind F, Negelein E. Über den Stoffwechsel von Tumoren im Körper. Klinische Wochenschrift. 1926;5(19):829–832. [Google Scholar]
- 86.Koppenol WH, Bounds PL, Dang CV. Otto Warburg’s contributions to current concepts of cancer metabolism. Nature reviews Cancer. 2011;11(5):325–337. doi: 10.1038/nrc3038. [DOI] [PubMed] [Google Scholar]
- 87.Brizel DM, Schroeder T, Scher RL, et al. Elevated tumor lactate concentrations predict for an increased risk of metastases in head-and-neck cancer. International journal of radiation oncology, biology, physics. 2001;51(2):349–353. doi: 10.1016/s0360-3016(01)01630-3. [DOI] [PubMed] [Google Scholar]
- 88.Walenta S, Wetterling M, Lehrke M, et al. High lactate levels predict likelihood of metastases, tumor recurrence, and restricted patient survival in human cervical cancers. Cancer research. 2000;60(4):916–921. [PubMed] [Google Scholar]
- 89.Quennet V, Yaromina A, Zips D, et al. Tumor lactate content predicts for response to fractionated irradiation of human squamous cell carcinomas in nude mice. Radiotherapy and oncology : journal of the European Society for Therapeutic Radiology and Oncology. 2006;81(2):130–135. doi: 10.1016/j.radonc.2006.08.012. [DOI] [PubMed] [Google Scholar]
- 90.Locasale JW, Cantley LC. Altered metabolism in cancer. BMC biology. 2010;8:88. doi: 10.1186/1741-7007-8-88. [DOI] [PMC free article] [PubMed] [Google Scholar]
- 91.Andriole GL, Crawford ED, Grubb RL, 3rd, et al. Prostate cancer screening in the randomized Prostate, Lung, Colorectal, and Ovarian Cancer Screening Trial: mortality results after 13 years of follow-up. Journal of the National Cancer Institute. 2012;104(2):125–132. doi: 10.1093/jnci/djr500. [DOI] [PMC free article] [PubMed] [Google Scholar]
- 92.Burns MA, He W, Wu CL, Cheng LL. Quantitative pathology in tissue MR spectroscopy based human prostate metabolomics. Technology in cancer research & treatment. 2004;3(6):591–598. doi: 10.1177/153303460400300609. [DOI] [PubMed] [Google Scholar]
- 93.Cheng LL, Burns MA, Taylor JL, et al. Metabolic characterization of human prostate cancer with tissue magnetic resonance spectroscopy. Cancer research. 2005;65(8):3030–3034. doi: 10.1158/0008-5472.CAN-04-4106. [DOI] [PubMed] [Google Scholar]
- 94.Cheng LL, Wu C, Smith MR, Gonzalez RG. Non-destructive quantitation of spermine in human prostate tissue samples using HRMAS 1H NMR spectroscopy at 9.4 T. FEBS letters. 2001;494(1–2):112–116. doi: 10.1016/s0014-5793(01)02329-8. [DOI] [PubMed] [Google Scholar]
- 95.Cohen RJ, Fujiwara K, Holland JW, McNeal JE. Polyamines in prostatic epithelial cells and adenocarcinoma; the effects of androgen blockade. The Prostate. 2001;49(4):278–284. doi: 10.1002/pros.10023. [DOI] [PubMed] [Google Scholar]
- 96.Costello LC, Franklin RB, Narayan P. Citrate in the diagnosis of prostate cancer. The Prostate. 1999;38(3):237–245. doi: 10.1002/(sici)1097-0045(19990215)38:3<237::aid-pros8>3.0.co;2-o. [DOI] [PMC free article] [PubMed] [Google Scholar]
- 97.Delongchamps NB, Peyromaure M, Dinh-Xuan AT. Role of vascular endothelial growth factor in prostate cancer. Urology. 2006;68(2):244–248. doi: 10.1016/j.urology.2006.03.010. [DOI] [PubMed] [Google Scholar]
- 98.Dittrich R, Kurth J, Decelle EA, et al. Assessing prostate cancer growth with citrate measured by intact tissue proton magnetic resonance spectroscopy. Prostate cancer and prostatic diseases. 2012;15(3):278–282. doi: 10.1038/pcan.2011.70. [DOI] [PMC free article] [PubMed] [Google Scholar]
- 99.Kobayashi N, Barnard RJ, Henning SM, et al. Effect of altering dietary omega-6/omega-3 fatty acid ratios on prostate cancer membrane composition, cyclooxygenase-2, and prostaglandin E2. Clinical cancer research : an official journal of the American Association for Cancer Research. 2006;12(15):4662–4670. doi: 10.1158/1078-0432.CCR-06-0459. [DOI] [PMC free article] [PubMed] [Google Scholar]
- 100.Lao L, Franklin RB, Costello LC. High-affinity L-aspartate transporter in prostate epithelial cells that is regulated by testosterone. The Prostate. 1993;22(1):53–63. doi: 10.1002/pros.2990220108. [DOI] [PubMed] [Google Scholar]
- 101.Madhu B, Shaw GL, Warren AY, Neal DE, Griffiths JR. Response of Degarelix treatment in human prostate cancer monitored by HR-MAS 1H NMR spectroscopy. Metabolomics : Official journal of the Metabolomic Society. 2016;12:120. doi: 10.1007/s11306-016-1055-0. [DOI] [PMC free article] [PubMed] [Google Scholar]
- 102.Maxeiner A, Adkins CB, Zhang Y, et al. Retrospective analysis of prostate cancer recurrence potential with tissue metabolomic profiles. The Prostate. 2010;70(7):710–717. doi: 10.1002/pros.21103. [DOI] [PMC free article] [PubMed] [Google Scholar]
- 103.Michaelis T, Helms G, Merboldt KD, Hanicke W, Bruhn H, Frahm J. Identification of Scyllo-inositol in proton NMR spectra of human brain in vivo. NMR in biomedicine. 1993;6(1):105–109. doi: 10.1002/nbm.1940060116. [DOI] [PubMed] [Google Scholar]
- 104.Moreadith RW, Lehninger AL. The pathways of glutamate and glutamine oxidation by tumor cell mitochondria. Role of mitochondrial NAD(P)+-dependent malic enzyme. The Journal of biological chemistry. 1984;259(10):6215–6221. [PubMed] [Google Scholar]
- 105.Rudrabhatla SR, Mahaffey CL, Mummert ME. Tumor microenvironment modulates hyaluronan expression: the lactate effect. The Journal of investigative dermatology. 2006;126(6):1378–1387. doi: 10.1038/sj.jid.5700255. [DOI] [PubMed] [Google Scholar]
- 106.Schneider D, Halperin R, Langer R, Bukovsky I, Herman A. Peritoneal fluid lactate dehydrogenase in ovarian cancer. Gynecologic oncology. 1997;66(3):399–404. doi: 10.1006/gyno.1997.4792. [DOI] [PubMed] [Google Scholar]
- 107.Selnaes KM, Gribbestad IS, Bertilsson H, et al. Spatially matched in vivo and ex vivo MR metabolic profiles of prostate cancer -- investigation of a correlation with Gleason score. NMR in biomedicine. 2013;26(5):600–606. doi: 10.1002/nbm.2901. [DOI] [PubMed] [Google Scholar]
- 108.Smith RC, Litwin MS, Lu Y, Zetter BR. Identification of an endogenous inhibitor of prostatic carcinoma cell growth. Nature medicine. 1995;1(10):1040–1045. doi: 10.1038/nm1095-1040. [DOI] [PubMed] [Google Scholar]
- 109.Stenman K, Hauksson JB, Grobner G, Stattin P, Bergh A, Riklund K. Detection of polyunsaturated omega-6 fatty acid in human malignant prostate tissue by 1D and 2D high-resolution magic angle spinning NMR spectroscopy. Magma (New York, NY) 2009;22(6):327–331. doi: 10.1007/s10334-009-0187-x. [DOI] [PubMed] [Google Scholar]
- 110.Stenman K, Stattin P, Stenlund H, Riklund K, Grobner G, Bergh A. H HRMAS NMR Derived Bio-markers Related to Tumor Grade, Tumor Cell Fraction, and Cell Proliferation in Prostate Tissue Samples. Biomarker insights. 2011;6:39–47. doi: 10.4137/BMI.S6794. [DOI] [PMC free article] [PubMed] [Google Scholar]
- 111.Swanson MG, Keshari KR, Tabatabai ZL, et al. Quantification of choline- and ethanolamine-containing metabolites in human prostate tissues using 1H HR-MAS total correlation spectroscopy. Magnetic resonance in medicine. 2008;60(1):33–40. doi: 10.1002/mrm.21647. [DOI] [PMC free article] [PubMed] [Google Scholar]
- 112.Swanson MG, Vigneron DB, Tabatabai ZL, et al. Proton HR-MAS spectroscopy and quantitative pathologic analysis of MRI/3D-MRSI-targeted postsurgical prostate tissues. Magnetic resonance in medicine. 2003;50(5):944–954. doi: 10.1002/mrm.10614. [DOI] [PubMed] [Google Scholar]
- 113.Swanson MG, Zektzer AS, Tabatabai ZL, et al. Quantitative analysis of prostate metabolites using 1H HR-MAS spectroscopy. Magnetic resonance in medicine. 2006;55(6):1257–1264. doi: 10.1002/mrm.20909. [DOI] [PubMed] [Google Scholar]
- 114.Tessem MB, Swanson MG, Keshari KR, et al. Evaluation of lactate and alanine as metabolic biomarkers of prostate cancer using 1H HR-MAS spectroscopy of biopsy tissues. Magnetic resonance in medicine. 2008;60(3):510–516. doi: 10.1002/mrm.21694. [DOI] [PMC free article] [PubMed] [Google Scholar]
- 115.van Asten JJ, Cuijpers V, Hulsbergen-van de Kaa C, et al. High resolution magic angle spinning NMR spectroscopy for metabolic assessment of cancer presence and Gleason score in human prostate needle biopsies. Magma (New York, NY) 2008;21(6):435–442. doi: 10.1007/s10334-008-0156-9. [DOI] [PubMed] [Google Scholar]
- 116.Walenta S, Schroeder T, Mueller-Klieser W. Lactate in solid malignant tumors: potential basis of a metabolic classification in clinical oncology. Current medicinal chemistry. 2004;11(16):2195–2204. doi: 10.2174/0929867043364711. [DOI] [PubMed] [Google Scholar]
- 117.Podo F, de Certaines JD. Magnetic resonance spectroscopy in cancer: phospholipid, neutral lipid and lipoprotein metabolism and function. Anticancer research. 1996;16(3b):1305–1315. [PubMed] [Google Scholar]
- 118.Gillies RJ, Morse DL. In vivo magnetic resonance spectroscopy in cancer. Annual review of biomedical engineering. 2005;7:287–326. doi: 10.1146/annurev.bioeng.7.060804.100411. [DOI] [PubMed] [Google Scholar]
- 119.Glunde K, Ackerstaff E, Natarajan K, Artemov D, Bhujwalla ZM. Real-time changes in 1H and 31P NMR spectra of malignant human mammary epithelial cells during treatment with the anti-inflammatory agent indomethacin. Magnetic resonance in medicine. 2002;48(5):819–825. doi: 10.1002/mrm.10295. [DOI] [PubMed] [Google Scholar]
- 120.Glunde K, Jie C, Bhujwalla ZM. Molecular causes of the aberrant choline phospholipid metabolism in breast cancer. Cancer research. 2004;64(12):4270–4276. doi: 10.1158/0008-5472.CAN-03-3829. [DOI] [PubMed] [Google Scholar]
- 121.Glunde K, Jie C, Bhujwalla ZM. Mechanisms of indomethacin-induced alterations in the choline phospholipid metabolism of breast cancer cells. Neoplasia (New York, NY) 2006;8(9):758–771. doi: 10.1593/neo.06187. [DOI] [PMC free article] [PubMed] [Google Scholar]
- 122.Leach MO, Verrill M, Glaholm J, et al. Measurements of human breast cancer using magnetic resonance spectroscopy: a review of clinical measurements and a report of localized 31P measurements of response to treatment. NMR in biomedicine. 1998;11(7):314–340. doi: 10.1002/(sici)1099-1492(1998110)11:7<314::aid-nbm522>3.0.co;2-z. [DOI] [PubMed] [Google Scholar]
- 123.Franco EL, Duarte-Franco E, Ferenczy A. Cervical cancer: epidemiology, prevention and the role of human papillomavirus infection. CMAJ : Canadian Medical Association journal = journal de l’Association medicale canadienne. 2001;164(7):1017–1025. [PMC free article] [PubMed] [Google Scholar]
- 124.Stewart B, Kleihues P. World Cancer Report. IARC Press; 2003. [Google Scholar]
- 125.Sitter B, Bathen T, Hagen B, Arentz C, Skjeldestad FE, Gribbestad IS. Cervical cancer tissue characterized by high-resolution magic angle spinning MR spectroscopy. Magma (New York, NY) 2004;16(4):174–181. doi: 10.1007/s10334-003-0025-5. [DOI] [PubMed] [Google Scholar]
- 126.Mahon MM, deSouza NM, Dina R, et al. Preinvasive and invasive cervical cancer: an ex vivo proton magic angle spinning magnetic resonance spectroscopy study. NMR in biomedicine. 2004;17(3):144–153. doi: 10.1002/nbm.869. [DOI] [PubMed] [Google Scholar]
- 127.Mahon MM, Cox IJ, Dina R, et al. (1)H magnetic resonance spectroscopy of preinvasive and invasive cervical cancer: in vivo-ex vivo profiles and effect of tumor load. Journal of magnetic resonance imaging : JMRI. 2004;19(3):356–364. doi: 10.1002/jmri.20012. [DOI] [PubMed] [Google Scholar]
- 128.Mahon MM, Williams AD, Soutter WP, et al. 1H magnetic resonance spectroscopy of invasive cervical cancer: an in vivo study with ex vivo corroboration. NMR in biomedicine. 2004;17(1):1–9. doi: 10.1002/nbm.830. [DOI] [PubMed] [Google Scholar]
- 129.De Silva SS, Payne GS, Thomas V, Carter PG, Ind TE, deSouza NM. Investigation of metabolite changes in the transition from pre-invasive to invasive cervical cancer measured using (1)H and (31)P magic angle spinning MRS of intact tissue. NMR in biomedicine. 2009;22(2):191–198. doi: 10.1002/nbm.1302. [DOI] [PubMed] [Google Scholar]
- 130.Hopman AH, Theelen W, Hommelberg PP, et al. Genomic integration of oncogenic HPV and gain of the human telomerase gene TERC at 3q26 are strongly associated events in the progression of uterine cervical dysplasia to invasive cancer. The Journal of pathology. 2006;210(4):412–419. doi: 10.1002/path.2070. [DOI] [PubMed] [Google Scholar]
- 131.Kim YT, Zhao M. Aberrant cell cycle regulation in cervical carcinoma. Yonsei medical journal. 2005;46(5):597–613. doi: 10.3349/ymj.2005.46.5.597. [DOI] [PMC free article] [PubMed] [Google Scholar]
- 132.Zietkowski D, Davidson RL, Eykyn TR, De Silva SS, Desouza NM, Payne GS. Detection of cancer in cervical tissue biopsies using mobile lipid resonances measured with diffusion-weighted (1)H magnetic resonance spectroscopy. NMR in biomedicine. 2010;23(4):382–390. doi: 10.1002/nbm.1472. [DOI] [PubMed] [Google Scholar]
- 133.Blankenberg FG, Katsikis PD, Storrs RW, et al. Quantitative analysis of apoptotic cell death using proton nuclear magnetic resonance spectroscopy. Blood. 1997;89(10):3778–3786. [PubMed] [Google Scholar]
- 134.Kuesel AC, Sutherland GR, Halliday W, Smith IC. 1H MRS of high grade astrocytomas: mobile lipid accumulation in necrotic tissue. NMR in biomedicine. 1994;7(3):149–155. doi: 10.1002/nbm.1940070308. [DOI] [PubMed] [Google Scholar]
- 135.Howe FA, Maxwell RJ, Saunders DE, Brown MM, Griffiths JR. Proton spectroscopy in vivo. Magnetic resonance quarterly. 1993;9(1):31–59. [PubMed] [Google Scholar]
- 136.Kurhanewicz J, Swanson MG, Nelson SJ, Vigneron DB. Combined magnetic resonance imaging and spectroscopic imaging approach to molecular imaging of prostate cancer. Journal of magnetic resonance imaging : JMRI. 2002;16(4):451–463. doi: 10.1002/jmri.10172. [DOI] [PMC free article] [PubMed] [Google Scholar]
- 137.Kallinowski F, Schlenger K, Runkel S, Vaupel P, Baessler KH, Fortmeyer HP. Glucose, lactate, and ketone body utilization by human gynecological tumors xenografted into rnu/rnu-rats. Strahlentherapie und Onkologie : Organ der Deutschen Rontgengesellschaft [et al] 1989;165(7):507–508. [PubMed] [Google Scholar]
- 138.Semenza GL, Artemov D, Bedi A, et al. ‘The metabolism of tumours’: 70 years later. Novartis Foundation symposium. 2001;240:251–260. discussion 260–254. [PubMed] [Google Scholar]
- 139.Dang CV, Semenza GL. Oncogenic alterations of metabolism. Trends in biochemical sciences. 1999;24(2):68–72. doi: 10.1016/s0968-0004(98)01344-9. [DOI] [PubMed] [Google Scholar]
- 140.Lyng H, Sitter B, Bathen TF, et al. Metabolic mapping by use of high-resolution magic angle spinning 1H MR spectroscopy for assessment of apoptosis in cervical carcinomas. BMC cancer. 2007;7:11. doi: 10.1186/1471-2407-7-11. [DOI] [PMC free article] [PubMed] [Google Scholar]
- 141.Foster DA, Xu L. Phospholipase D in cell proliferation and cancer. Molecular cancer research : MCR. 2003;1(11):789–800. [PubMed] [Google Scholar]
- 142.Ackerstaff E, Glunde K, Bhujwalla ZM. Choline phospholipid metabolism: a target in cancer cells? Journal of cellular biochemistry. 2003;90(3):525–533. doi: 10.1002/jcb.10659. [DOI] [PubMed] [Google Scholar]
- 143.Hockel M, Schlenger K, Hockel S, Vaupel P. Hypoxic cervical cancers with low apoptotic index are highly aggressive. Cancer research. 1999;59(18):4525–4528. [PubMed] [Google Scholar]
- 144.Imoto I, Tsuda H, Hirasawa A, et al. Expression of cIAP1, a target for 11q22 amplification, correlates with resistance of cervical cancers to radiotherapy. Cancer research. 2002;62(17):4860–4866. [PubMed] [Google Scholar]
- 145.Hakumaki JM, Kauppinen RA. 1H NMR visible lipids in the life and death of cells. Trends in biochemical sciences. 2000;25(8):357–362. doi: 10.1016/s0968-0004(00)01614-5. [DOI] [PubMed] [Google Scholar]
- 146.De Silva SS, Payne GS, Morgan VA, et al. Epithelial and stromal metabolite changes in the transition from cervical intraepithelial neoplasia to cervical cancer: an in vivo 1H magnetic resonance spectroscopic imaging study with ex vivo correlation. European radiology. 2009;19(8):2041–2048. doi: 10.1007/s00330-009-1363-0. [DOI] [PubMed] [Google Scholar]
- 147.Leibsohn S, d’Ablaing G, Mishell DR, Jr, Schlaerth JB. Leiomyosarcoma in a series of hysterectomies performed for presumed uterine leiomyomas. American journal of obstetrics and gynecology. 1990;162(4):968–974. doi: 10.1016/0002-9378(90)91298-q. discussion 974–966. [DOI] [PubMed] [Google Scholar]
- 148.Mazzei P, Piccolo A, Nugnes L, Mascolo M, De Rosa G, Staibano S. Metabolic profile of intact tissue from uterine leiomyomas using high-resolution magic-angle-spinning (1)H NMR spectroscopy. NMR in biomedicine. 2010;23(10):1137–1145. doi: 10.1002/nbm.1540. [DOI] [PubMed] [Google Scholar]
- 149.Wang Y, Holmes E, Comelli EM, et al. Topographical variation in metabolic signatures of human gastrointestinal biopsies revealed by high-resolution magic-angle spinning 1H NMR spectroscopy. Journal of proteome research. 2007;6(10):3944–3951. doi: 10.1021/pr0702565. [DOI] [PubMed] [Google Scholar]
- 150.Ferlay J, Soerjomataram I, Dikshit R, et al. Cancer incidence and mortality worldwide: sources, methods and major patterns in GLOBOCAN 2012. International journal of cancer. 2015;136(5):E359–386. doi: 10.1002/ijc.29210. [DOI] [PubMed] [Google Scholar]
- 151.Chan EC, Koh PK, Mal M, et al. Metabolic profiling of human colorectal cancer using high-resolution magic angle spinning nuclear magnetic resonance (HR-MAS NMR) spectroscopy and gas chromatography mass spectrometry (GC/MS) Journal of proteome research. 2009;8(1):352–361. doi: 10.1021/pr8006232. [DOI] [PubMed] [Google Scholar]
- 152.Mirnezami R, Jimenez B, Li JV, et al. Rapid diagnosis and staging of colorectal cancer via high-resolution magic angle spinning nuclear magnetic resonance (HR-MAS NMR) spectroscopy of intact tissue biopsies. Annals of surgery. 2014;259(6):1138–1149. doi: 10.1097/SLA.0b013e31829d5c45. [DOI] [PubMed] [Google Scholar]
- 153.Jimenez B, Mirnezami R, Kinross J, et al. 1H HR-MAS NMR spectroscopy of tumor-induced local metabolic “field-effects” enables colorectal cancer staging and prognostication. Journal of proteome research. 2013;12(2):959–968. doi: 10.1021/pr3010106. [DOI] [PubMed] [Google Scholar]
- 154.Jordan KW, Nordenstam J, Lauwers GY, et al. Metabolomic characterization of human rectal adenocarcinoma with intact tissue magnetic resonance spectroscopy. Dis Colon Rectum. 2009;52(3):520–525. doi: 10.1007/DCR.0b013e31819c9a2c. [DOI] [PMC free article] [PubMed] [Google Scholar]
- 155.Tugnoli V, Mucci A, Schenetti L, et al. Molecular characterization of human gastric mucosa by HR-MAS magnetic resonance spectroscopy. International journal of molecular medicine. 2004;14(6):1065–1071. doi: 10.3892/ijmm.14.6.1065. [DOI] [PubMed] [Google Scholar]
- 156.Tugnoli V, Mucci A, Schenetti L, et al. Ex vivo HR-MAS Magnetic Resonance Spectroscopy of human gastric adenocarcinomas: a comparison with healthy gastric mucosa. Oncology reports. 2006;16(3):543–553. doi: 10.3892/or.16.3.543. [DOI] [PubMed] [Google Scholar]
- 157.Calabrese C, Pisi A, Di Febo G, et al. Biochemical alterations from normal mucosa to gastric cancer by ex vivo magnetic resonance spectroscopy. Cancer epidemiology, biomarkers & prevention : a publication of the American Association for Cancer Research, cosponsored by the American Society of Preventive Oncology. 2008;17(6):1386–1395. [Google Scholar]
- 158.Dave U, Taylor-Robinson SD, Walker MM, et al. In vitro 1H-magnetic resonance spectroscopy of Barrett’s esophageal mucosa using magic angle spinning techniques. European journal of gastroenterology & hepatology. 2004;16(11):1199–1205. doi: 10.1097/00042737-200411000-00019. [DOI] [PubMed] [Google Scholar]
- 159.Yakoub D, Keun HC, Goldin R, Hanna GB. Metabolic profiling detects field effects in nondysplastic tissue from esophageal cancer patients. Cancer research. 2010;70(22):9129–9136. doi: 10.1158/0008-5472.CAN-10-1566. [DOI] [PubMed] [Google Scholar]
- 160.Rocha CM, Barros AS, Gil AM, et al. Metabolic profiling of human lung cancer tissue by 1H high resolution magic angle spinning (HRMAS) NMR spectroscopy. Journal of proteome research. 2010;9(1):319–332. doi: 10.1021/pr9006574. [DOI] [PubMed] [Google Scholar]
- 161.Duarte IF, Rocha CM, Barros AS, et al. Can nuclear magnetic resonance (NMR) spectroscopy reveal different metabolic signatures for lung tumours? Virchows Archiv : an international journal of pathology. 2010;457(6):715–725. doi: 10.1007/s00428-010-0993-6. [DOI] [PubMed] [Google Scholar]
- 162.Chen W, Zu Y, Huang Q, et al. Study on metabonomic characteristics of human lung cancer using high resolution magic-angle spinning 1H NMR spectroscopy and multivariate data analysis. Magnetic resonance in medicine. 2011;66(6):1531–1540. doi: 10.1002/mrm.22957. [DOI] [PubMed] [Google Scholar]
- 163.Jordan KW, Adkins CB, Su L, et al. Comparison of squamous cell carcinoma and adenocarcinoma of the lung by metabolomic analysis of tissue-serum pairs. Lung cancer (Amsterdam, Netherlands) 2010;68(1):44–50. doi: 10.1016/j.lungcan.2009.05.012. [DOI] [PMC free article] [PubMed] [Google Scholar]
- 164.Moka D, Vorreuther R, Schicha H, et al. Biochemical classification of kidney carcinoma biopsy samples using magic-angle-spinning 1H nuclear magnetic resonance spectroscopy. Journal of pharmaceutical and biomedical analysis. 1998;17(1):125–132. doi: 10.1016/s0731-7085(97)00176-3. [DOI] [PubMed] [Google Scholar]
- 165.Righi V, Mucci A, Schenetti L, et al. Ex vivo HR-MAS magnetic resonance spectroscopy of normal and malignant human renal tissues. Anticancer research. 2007;27(5a):3195–3204. [PubMed] [Google Scholar]
- 166.Tate AR, Foxall PJ, Holmes E, et al. Distinction between normal and renal cell carcinoma kidney cortical biopsy samples using pattern recognition of (1)H magic angle spinning (MAS) NMR spectra. NMR in biomedicine. 2000;13(2):64–71. doi: 10.1002/(sici)1099-1492(200004)13:2<64::aid-nbm612>3.0.co;2-x. [DOI] [PubMed] [Google Scholar]
- 167.Stern JM, Merritt ME, Zeltser I, Raman JD, Cadeddu JA. Phase one pilot study using magnetic resonance spectroscopy to predict the histology of radiofrequency-ablated renal tissue. European urology. 2009;55(2):433–438. doi: 10.1016/j.eururo.2008.03.106. [DOI] [PubMed] [Google Scholar]
- 168.Jordan KW, Adkins CB, Cheng LL, Faquin WC. Application of magnetic-resonance-spectroscopy- based metabolomics to the fine-needle aspiration diagnosis of papillary thyroid carcinoma. Acta cytologica. 2011;55(6):584–589. doi: 10.1159/000333271. [DOI] [PMC free article] [PubMed] [Google Scholar]
- 169.Miccoli P, Torregrossa L, Shintu L, et al. Metabolomics approach to thyroid nodules: a high-resolution magic-angle spinning nuclear magnetic resonance-based study. Surgery. 2012;152(6):1118–1124. doi: 10.1016/j.surg.2012.08.037. [DOI] [PubMed] [Google Scholar]
- 170.Tessem MB, Selnaes KM, Sjursen W, et al. Discrimination of patients with microsatellite instability colon cancer using 1H HR MAS MR spectroscopy and chemometric analysis. Journal of proteome research. 2010;9(7):3664–3670. doi: 10.1021/pr100176g. [DOI] [PubMed] [Google Scholar]
- 171.Imperiale A, Elbayed K, Moussallieh FM, et al. Metabolomic profile of the adrenal gland: from physiology to pathological conditions. Endocrine-related cancer. 2013;20(5):705–716. doi: 10.1530/ERC-13-0232. [DOI] [PubMed] [Google Scholar]
- 172.Weiss LM, Medeiros LJ, Vickery AL., Jr Pathologic features of prognostic significance in adrenocortical carcinoma. The American journal of surgical pathology. 1989;13(3):202–206. doi: 10.1097/00000478-198903000-00004. [DOI] [PubMed] [Google Scholar]
- 173.Papotti M, Libe R, Duregon E, Volante M, Bertherat J, Tissier F. The Weiss score and beyond--histopathology for adrenocortical carcinoma. Hormones & cancer. 2011;2(6):333–340. doi: 10.1007/s12672-011-0088-0. [DOI] [PMC free article] [PubMed] [Google Scholar]
- 174.Roman S. Adrenocortical carcinoma. Current opinion in oncology. 2006;18(1):36–42. doi: 10.1097/01.cco.0000198976.43992.14. [DOI] [PubMed] [Google Scholar]
- 175.Young WF., Jr Clinical practice. The incidentally discovered adrenal mass. The New England journal of medicine. 2007;356(6):601–610. doi: 10.1056/NEJMcp065470. [DOI] [PubMed] [Google Scholar]
- 176.Lloyd RV. Adrenal cortical tumors, pheochromocytomas and paragangliomas. Modern pathology : an official journal of the United States and Canadian Academy of Pathology, Inc. 2011;24(Suppl 2):S58–65. doi: 10.1038/modpathol.2010.126. [DOI] [PubMed] [Google Scholar]
- 177.Imperiale A, Moussallieh FM, Sebag F, et al. A new specific succinate-glutamate metabolomic hallmark in SDHx-related paragangliomas. PloS one. 2013;8(11):e80539. doi: 10.1371/journal.pone.0080539. [DOI] [PMC free article] [PubMed] [Google Scholar]
- 178.Martinez-Granados B, Monleon D, Martinez-Bisbal MC, et al. Metabolite identification in human liver needle biopsies by high-resolution magic angle spinning 1H NMR spectroscopy. NMR in biomedicine. 2006;19(1):90–100. doi: 10.1002/nbm.1005. [DOI] [PubMed] [Google Scholar]
- 179.Yang Y, Li C, Nie X, et al. Metabonomic studies of human hepatocellular carcinoma using high-resolution magic-angle spinning 1H NMR spectroscopy in conjunction with multivariate data analysis. Journal of proteome research. 2007;6(7):2605–2614. doi: 10.1021/pr070063h. [DOI] [PubMed] [Google Scholar]
- 180.Duarte IF, Stanley EG, Holmes E, et al. Metabolic assessment of human liver transplants from biopsy samples at the donor and recipient stages using high-resolution magic angle spinning 1H NMR spectroscopy. Analytical chemistry. 2005;77(17):5570–5578. doi: 10.1021/ac050455c. [DOI] [PubMed] [Google Scholar]
- 181.Millis K, Weybright P, Campbell N, et al. Classification of human liposarcoma and lipoma using ex vivo proton NMR spectroscopy. Magnetic resonance in medicine. 1999;41(2):257–267. doi: 10.1002/(sici)1522-2594(199902)41:2<257::aid-mrm8>3.0.co;2-n. [DOI] [PubMed] [Google Scholar]
- 182.Chen JH, Enloe BM, Weybright P, et al. Biochemical correlates of thiazolidinedione-induced adipocyte differentiation by high-resolution magic angle spinning NMR spectroscopy. Magnetic resonance in medicine. 2002;48(4):602–610. doi: 10.1002/mrm.10256. [DOI] [PubMed] [Google Scholar]
- 183.Cheng LL, Ma MJ, Becerra L, et al. Quantitative neuropathology by high resolution magic angle spinning proton magnetic resonance spectroscopy. Proc Natl Acad Sci U S A. 1997;94(12):6408–6413. doi: 10.1073/pnas.94.12.6408. [DOI] [PMC free article] [PubMed] [Google Scholar]
- 184.Cheng LL, Newell K, Mallory AE, Hyman BT, Gonzalez RG. Quantification of neurons in Alzheimer and control brains with ex vivo high resolution magic angle spinning proton magnetic resonance spectroscopy and stereology. Magn Reson Imaging. 2002;20(7):527–533. doi: 10.1016/s0730-725x(02)00512-x. [DOI] [PubMed] [Google Scholar]
- 185.Sitter B, Autti T, Tyynela J, et al. High-resolution magic angle spinning and 1H magnetic resonance spectroscopy reveal significantly altered neuronal metabolite profiles in CLN1 but not in CLN3. J Neurosci Res. 2004;77(5):762–769. doi: 10.1002/jnr.20123. [DOI] [PubMed] [Google Scholar]
- 186.Johnsen SL, Rasmussen S, Sollien R, Kiserud T. Fetal age assessment based on femur length at 10–25 weeks of gestation, and reference ranges for femur length to head circumference ratios. Acta obstetricia et gynecologica Scandinavica. 2005;84(8):725–733. doi: 10.1111/j.0001-6349.2005.00691.x. [DOI] [PubMed] [Google Scholar]
- 187.Konje JC, Abrams KR, Bell SC, Taylor DJ. Determination of gestational age after the 24th week of gestation from fetal kidney length measurements. Ultrasound in obstetrics & gynecology : the official journal of the International Society of Ultrasound in Obstetrics and Gynecology. 2002;19(6):592–597. doi: 10.1046/j.1469-0705.2002.00704.x. [DOI] [PubMed] [Google Scholar]
- 188.Hadlock FP, Deter RL, Harrist RB, Park SK. Estimating fetal age: computer-assisted analysis of multiple fetal growth parameters. Radiology. 1984;152(2):497–501. doi: 10.1148/radiology.152.2.6739822. [DOI] [PubMed] [Google Scholar]
- 189.Bennett KA, Crane JM, O’Shea P, Lacelle J, Hutchens D, Copel JA. First trimester ultrasound screening is effective in reducing postterm labor induction rates: a randomized controlled trial. American journal of obstetrics and gynecology. 2004;190(4):1077–1081. doi: 10.1016/j.ajog.2003.09.065. [DOI] [PubMed] [Google Scholar]
- 190.Savitz DA, Terry JW, Jr, Dole N, Thorp JM, Jr, Siega-Riz AM, Herring AH. Comparison of pregnancy dating by last menstrual period, ultrasound scanning, and their combination. American journal of obstetrics and gynecology. 2002;187(6):1660–1666. doi: 10.1067/mob.2002.127601. [DOI] [PubMed] [Google Scholar]
- 191.Cohn BR, Joe BN, Zhao S, et al. Quantitative metabolic profiles of 2nd and 3rd trimester human amniotic fluid using (1)H HR-MAS spectroscopy. Magma (New York, NY) 2009;22(6):343–352. doi: 10.1007/s10334-009-0184-0. [DOI] [PMC free article] [PubMed] [Google Scholar]
- 192.Cohn BR, Fukuchi EY, Joe BN, et al. Calculation of gestational age in late second and third trimesters by ex vivo magnetic resonance spectroscopy of amniotic fluid. American journal of obstetrics and gynecology. 2010;203(1):76e71–76.e10. doi: 10.1016/j.ajog.2010.01.046. [DOI] [PubMed] [Google Scholar]
- 193.Albers MJ, Butler TN, Rahwa I, et al. Evaluation of the ERETIC method as an improved quantitative reference for 1H HR-MAS spectroscopy of prostate tissue. Magnetic resonance in medicine. 2009;61(3):525–532. doi: 10.1002/mrm.21808. [DOI] [PMC free article] [PubMed] [Google Scholar]
- 194.Keshari KR, Zektzer AS, Swanson MG, Majumdar S, Lotz JC, Kurhanewicz J. Characterization of intervertebral disc degeneration by high-resolution magic angle spinning (HR-MAS) spectroscopy. Magnetic resonance in medicine. 2005;53(3):519–527. doi: 10.1002/mrm.20392. [DOI] [PubMed] [Google Scholar]
- 195.Keshari KR, Lotz JC, Kurhanewicz J, Majumdar S. Correlation of HR-MAS spectroscopy derived metabolite concentrations with collagen and proteoglycan levels and Thompson grade in the degenerative disc. Spine. 2005;30(23):2683–2688. doi: 10.1097/01.brs.0000188256.88859.9c. [DOI] [PubMed] [Google Scholar]
- 196.Pacholczyk-Sienicka B, Radek M, Radek A, Jankowski S. Characterization of metabolites determined by means of 1H HR MAS NMR in intervertebral disc degeneration. Magma (New York, NY) 2015;28(2):173–183. doi: 10.1007/s10334-014-0457-0. [DOI] [PMC free article] [PubMed] [Google Scholar]
- 197.Keshari KR, Lotz JC, Link TM, Hu S, Majumdar S, Kurhanewicz J. Lactic acid and proteoglycans as metabolic markers for discogenic back pain. Spine. 2008;33(3):312–317. doi: 10.1097/BRS.0b013e31816201c3. [DOI] [PubMed] [Google Scholar]
- 198.Sitter B, Johnsson MK, Halgunset J, Bathen TF. Metabolic changes in psoriatic skin under topical corticosteroid treatment. BMC dermatology. 2013;13:8. doi: 10.1186/1471-5945-13-8. [DOI] [PMC free article] [PubMed] [Google Scholar]
- 199.Anwar MA, Shalhoub J, Vorkas PA, et al. In-vitro identification of distinctive metabolic signatures of intact varicose vein tissue via magic angle spinning nuclear magnetic resonance spectroscopy. European journal of vascular and endovascular surgery : the official journal of the European Society for Vascular Surgery. 2012;44(4):442–450. doi: 10.1016/j.ejvs.2012.05.020. [DOI] [PubMed] [Google Scholar]
- 200.O’Connor RD, Xu J, Ewald GA, et al. Intramyocardial triglyceride quantification by magnetic resonance spectroscopy: In vivo and ex vivo correlation in human subjects. Magnetic resonance in medicine. 2011;65(5):1234–1238. doi: 10.1002/mrm.22734. [DOI] [PMC free article] [PubMed] [Google Scholar]
- 201.Jordan KW, He W, Halpern EF, Wu CL, Cheng LL. Evaluation of Tissue Metabolites with High Resolution Magic Angle Spinning MR Spectroscopy Human Prostate Samples After Three-Year Storage at −80 degrees C. Biomarker insights. 2007;2:147–154. [PMC free article] [PubMed] [Google Scholar]
- 202.Leichtle AB, Dufour JF, Fiedler GM. Potentials and pitfalls of clinical peptidomics and metabolomics. Swiss medical weekly. 2013;143:w13801. doi: 10.4414/smw.2013.13801. [DOI] [PubMed] [Google Scholar]