Abstract
Purpose
To develop a 31P spectroscopic magnetic resonance fingerprinting (MRF) method for fast quantification of the chemical exchange rate between phosphocreatine (PCr) and ATP via creatine kinase (CK).
Methods
A 31P MRF sequence (CK-MRF) was developed to quantify the forward rate constant of ATP synthesis via CK ( ), the T1 relaxation time of PCr ( ), and the PCr-to-ATP concentration ratio ( ). The CK-MRF sequence used a bSSFP-type excitation with ramped flip angles and a unique saturation scheme sensitive to the exchange between PCr and γATP. Parameter estimation was accomplished by matching the acquired signals to a dictionary generated using the Bloch-McConnell equation. Simulation studies were performed to examine the susceptibility of the CK-MRF method to several potential error sources. The accuracy of nonlocalized CK-MRF measurements before and after an ischemia-reperfusion (IR) protocol was compared to magnetization transfer (MT-MRS) method in rat hindlimb at 9.4 T (n=17). Reproducibility of CK-MRF was also assessed by comparing CK-MRF measurements to both MT-MRS (n=17) and four angle saturation transfer (FAST) methods (n=7).
Results
Simulation results showed that CK-MRF quantification of was robust with <5% error in the presence of model inaccuracies including dictionary resolution, metabolite T2 values, Pi metabolism, and B1 miscalibration. Estimation of by CK-MRF (0.38±0.02 s−1 at baseline and 0.42±0.03 s−1 post-IR) showed strong agreement with MT-MRS (0.39±0.03 s−1 at baseline and 0.44±0.04 s−1 post-IR). estimation was also similar between CK-MRF and FAST (0.38±0.02 s−1 for CK-MRF and 0.38±0.11 s−1 for FAST). The coefficient of variation from 20-s CK-MRF quantification of was 42% of that by 150-s MT-MRS acquisition and was 12% of that by 20-s FAST acquisition.
Conclusion
This study demonstrates the potential of a 31P spectroscopic MRF framework for rapid, accurate and reproducible quantification of chemical exchange rate of CK in vivo.
Keywords: magnetic resonance fingerprinting, 31P spectroscopy, creatine kinase metabolism, ischemia/reperfusion
Graphical Abstract
A 31P spectroscopic pulse sequence based on magnetic resonance fingerprinting framework was designed to quantify the forward rate constant of ATP synthesis via creatine kinase. Simulation results demonstrated the robustness of this method to several sources of experimental errors. In vivo studies on rat hindlimb showed significantly higher reproducibility than conventional magnetization transfer method with only 13% of the acquisition time.
Introduction
Magnetic Resonance Spectroscopy (MRS) offers a unique opportunity to noninvasively characterize metabolic profiles due to its chemical specificity. Phosphorus-31 (31P) MRS has been used extensively to assess the energetics of living tissues1–4. In addition to measuring tissue concentrations of phosphate metabolites, 31P magnetization transfer (MT) techniques using saturation transfer5 or inversion transfer6,7 have been developed to quantify the phosphocreatine (PCr) synthesis rate via creatine kinase (CK) in heart, skeletal muscle, and brain8–15. However, due to the low concentrations of phosphate metabolites, MT-MRS methods typically require long acquisition time to achieve adequate signal-to-noise ratio (SNR).
Shorter acquisition times have been achieved previously by using a combination of two strategies for CK measurements. The first strategy uses a reduced number of spectra acquired under partially relaxed conditions, such as in the Four Angle Saturation Transfer (FAST) method16, or the Triple Repetition Time Saturation Transfer (TRiST) method17. Reducing the number of acquired spectra is particularly useful in combination with chemical shift imaging (CSI) methods for spatially localized measurements. The second strategy further reduces the number of acquired spectra by assuming an intrinsic T1 value for PCr. These methods include the Two Repetition Time Saturation Transfer (TwiST)18 and T1 Nominal19 methods.
The Magnetic Resonance Fingerprinting (MRF) technique is a new framework to potentially reduce the time needed for quantitative measurements. MRF extracts parameter maps from signals generated using non-steady state pulse sequences in conjunction with Bloch simulations and pattern matching. This parameter estimation framework allows for greater flexibility in pulse sequence design than conventional methods and has been successfully utilized for efficient measurement of proton (1H) relaxation times in the brain20,21, abdomen22, and heart23.
In this work, a new fast and robust 31P CK-MRF measurement strategy is proposed using the MRF framework. While the technique is based on the original MRF pulse sequence and dictionary matching method, several additional strategies to improve the sensitivity to chemical exchange via CK have been incorporated. First, a 31P bSSFP-type sequence24 with a ramped flip angle series25 was employed to improve SNR efficiency. Second, selective saturation pulses and excitation pulses were rapidly alternated to allow simultaneous encoding of chemical exchange and sampling of transient signal evolution. The accuracy and robustness of this method were first evaluated in simulation studies in which several potential error sources were assessed. In vivo studies on rat hindlimb were performed to validate the CK-MRF measurements against a conventional 31P magnetization transfer (MT-MRS) method. Finally, a reproducibility comparison between the proposed CK-MRF method and the MT-MRS and FAST methods was performed.
Materials and Methods
Pulse Sequence
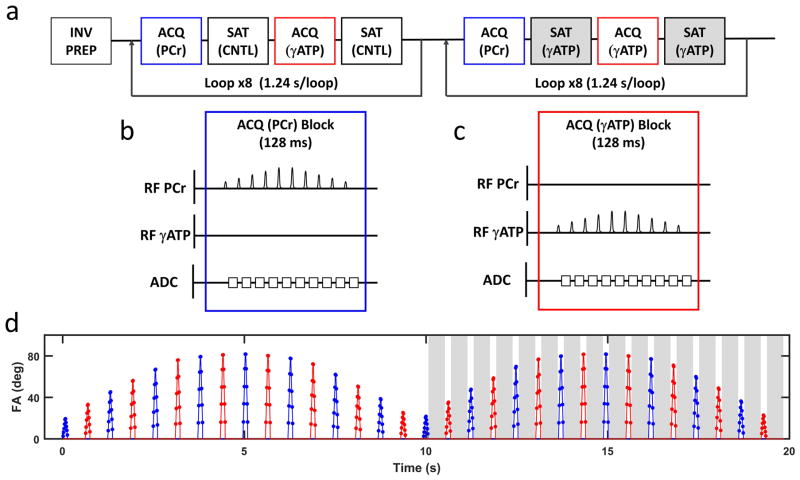
A schematic of the CK-MRF pulse sequence is shown in Figure 1a. Following an inversion preparation, a bSSFP-type acquisition scheme for 31P spectroscopy was employed. The acquisition was made up of a total of 32 acquisition blocks. To enable accurate quantification of PCr and γATP signals, two types of acquisition blocks, ACQ-PCr and ACQ-γATP, were used to acquire signals from PCr and γATP, respectively. A 490-ms selective saturation block was used between two acquisition blocks, with the saturation frequency set either at the resonance frequency of γATP (SAT-γATP) or at the frequency contralateral to γATP (SAT-CNTL). The entire acquisition is comprised of two modules that employed SAT-CNTL and SAT-γATP, respectively, with the two acquisition blocks for PCr and γATP alternated eight times in each module.
Figure 1. Sequence design.
a. Schematic of the CK-MRF pulse sequence. ACQ (PCr) and ACQ (γATP) are acquisition blocks for PCr and γATP, respectively. SAT (CNTL) and SAT (γATP) are contralateral and γATP saturation blocks, respectively. ACQ (PCr) and ACQ (γATP) used Gaussian excitation pulses, while SAT (CNTL) and SAT (γATP) used continuous wave RF pulses. b and c. Pulse sequence diagrams for one block of ACQ (PCr) (b) and ACQ (γATP) (c). d. Timing and nominal flip angles of all excitation pulses. Blue and red colors indicate PCr and γATP excitation, respectively. Grey shaded areas indicate γATP saturation.
Diagrams of acquisition blocks for ACQ-PCr and ACQ-γATP are shown in Figures 1b and 1c. Each block consisted of a train of 10 linearly ramped-up and ramped-down excitations with alternating phase and a constant TR of 12.8 ms. Selective excitation was performed with a 4 ms Gaussian pulse centered at the resonance frequency of PCr and γATP, respectively. Following each excitation, 7.7 ms of FID signal was acquired with 256 data points, resulting in a spectral resolution of 130 Hz/pt.
The nominal flip angle, frequency, and timing of all 320 RF excitations for CK-MRF are shown in Figure 1d. The maximum flip angles in the 32 acquisition blocks were modulated by a sinusoidal envelope. The total time for one complete CK-MRF acquisition was 20 s. Multiple repetitions were acquired with no delay, with a single dummy acquisition preceding each series of repetitions.
Fingerprint Simulation
Signal time courses, i.e. the fingerprints, were simulated by solving the modified Bloch-McConnell equation16,26 with two exchanging pools, i.e., PCr, and γATP. Details of the simulation methods are described in the Appendix. Simulation of a fingerprint required a total of nine input parameters: the forward rate constant of ATP synthesis via CK ( ), the concentration ratio of PCr-to-ATP ( ), the T1 and T2 relaxation times and the resonance frequencies (chemical shift) of PCr and γATP ( , ωPCr, ωγATP), as well as B0 distribution characterized by a linewidth, LW. Given a set of input parameters, spin evolution was simulated in sequential time steps, starting from a fully relaxed initial condition. Excitation was simulated by discretizing the Gaussian shaped RF pulse into 41 instantaneous complex rotations (Equations A7–9), with the magnitude of the rotation following a Gaussian envelope, and the total rotation summing to the nominal FA. The phase of each rotation was determined by the excitation frequency. γATP saturation was simulated by instantaneous saturation of γATP magnetization with no direct effect on PCr magnetization. The pulse sequence was simulated sequentially twice to account for the dummy scan. For each simulation, all FID signals were recorded from the bulk transverse magnetization, described as S(t) in Equation A12.
Dictionary Generation
The dictionary in the MRF framework is a set of fingerprints, or signal evolutions, for selected values of the tissue properties. Four tissue properties, namely , ωPCr, and , were varied over their physiologically expected range to generate a dictionary for template matching. Specifically, 51 values of ranging from 0.3 to 0.55 s−1 with a resolution of 0.005 s−1, 20 values of uniformly distributed from 2.8 to 4.7 s, 11 values for ωPCr spanning from −15 to 15 Hz, and 49 values for uniformly distributed from 3.0 to 5.4 were simulated. It is worth noting that these ranges of parameter variations reflect physiological variations expected in the current study and may need to be expanded for other studies. ωγATP for each entry was constrained to (ωPCr − ΔωPCr−γATP), where ΔωPCr−γATP was the chemical shift difference between PCr and γATP and was fixed at 2.4 ppm. The remaining 4 parameters, , and LW, were set at 120 ms, 16 ms, 0.8 s, and 15 Hz respectively based on pilot data. value was corrected to compensate for nuclear Overhauser effect (NOE)6,27 from αATP and βATP.
Parameter Matching
Matching was performed in the frequency domain to reduce memory load. Each of the 320 FIDs, for all acquired data and simulated dictionary entries, was Fourier transformed, and the complex-valued data points corresponding to PCr or γATP resonances in these spectra were selected. This resulted in a time course signal, the fingerprint, showing the evolution of PCr and γATP peaks. The inner products between the normalized fingerprint and all entries of the normalized dictionary were computed. The dictionary entry that produced the largest magnitude of the inner product was considered to be the best match. From this match, the values of , ωPCr, and were derived. Subsequently, the spin density of γATP ( ) was computed as the scale factor between the fingerprint and its matched dictionary entry. All data processing and parameter estimation were fully automated.
Conventional MT-MRS
Conventional MT-MRS method was used for validation and comparison. MT-MRS acquisition consisted of 9 spectra: 7 spectra acquired after γATP saturation, with saturation times of 0.4, 0.9, 1.3, 2.2, 3.5, 5.3 and 7 s, respectively; a control spectrum with contralateral saturation; and a conventional spectrum without saturation19. All spectra were acquired using 90° hard pulses (130-μs duration) and a 16-s TR. Saturation was accomplished by applying continuous wave RF to the frequency of saturation. Post-processing consisted of 15 Hz line broadening, Fourier transform, and correction of phase and baseline. For phase correction, zero- and first-order phase correction values were obtained manually from spectrum with 12 signal averages and no γATP saturation. These phase correction values were applied to all the spectra acquired from the same animal. The phase correction was followed by automated baseline correction. The signal intensity from PCr was quantified by integrating the area under the PCr peak. Subsequently, , and were determined by fitting the explicit solution of the Bloch-McConnell equation to the experimental data28. Effects of RF spillover were corrected using the method outlined by Kingsley and Monahan29.
FAST Method
The reproducibility and efficiency of the CK-MRF measurements were also compared with the FAST method. The FAST acquisition consisted of 4 spectra acquired with either 15° or 60° FA, and with either γATP or control saturation16. A BIR-4 pulse was used for excitation. All the spectra were acquired after five dummy scans with a TR of 1 s. Parameter estimation of , and for FAST data was performed using the established closed-form derivation.
Simulations Studies
Performance of Parameter Quantification using Dictionary-Based Approach
Simulations were performed to assess the potential errors in parameter quantification caused by using a finite dictionary resolution. A total of 1000 sets of , ωPCr, and values were randomly generated with upper and lower bounds consistent with the dictionary’s ranges. The remaining 5 input parameters, i.e., ωγATP, , and LW were fixed, with ωγATP constrained to (ωPCr – 2.4) ppm. Test fingerprints were generated by simulation of the CK-MRF pulse sequence for each set of parameter values and were matched against the dictionary. The matching errors were calculated as the difference between the matched parameters and the parameters used in simulation.
Sensitivity of Parameter Quantification to Fixed Parameter Values
Since five parameters (ΔωPCr−γATP, , and LW) were not varied in the dictionary, errors in their values may affect the accuracy of the matched parameters. Simulations were performed to assess how incorrect selection of the fixed parameters could influence the matched parameters. In addition to these five parameters, the impact of a constant B1 scale error, resulting in a consistent error in flip angles, was also evaluated. First, a test parameter set (800, 3700, 16 and 120 ms for , and , −389 and 0 Hz for ωγATP and ωPCr, 0.42 s−1 for , 4.1 for , and 15 Hz LW, respectively) was chosen to evaluate how errors in the fixed parameters could alter dictionary matching results. To assess the impact of using the wrong values for fixed parameters, test fingerprints were generated by varying the values of a fixed parameter and subsequently matched to the dictionary generated using the test parameter set. The potential impact of each fixed parameter was assessed by calculating the difference between the matched parameters and the true test parameter values. Error calculations for were performed by varying each parameter between 50% and 150% of its test value. Error calculations for ΔωPCr−γATP used a range of −430 to −349 Hz. Error calculations for B1 were performed by scaling all flip angles to between 50% and 150% of their nominal values.
In addition to error analyses, the effect of Pi-to-ATP exchange on parameter estimation, as well as the errors associated with using contralateral saturation to correct for the spillover effect of the γATP saturation on PCr, were also evaluated by simulation (See Supplemental Methods and Figures).
In Vivo Study Protocol
In vivo studies were performed to assess the accuracy of the CK-MRF measurements in rat hindlimb. Details of the experimental setup have been described previously30. Briefly, three-month-old Sprague-Dawley rats (n=21) were anesthetized and positioned laterally in a cradle. The hindlimb was secured within a 15-mm 31P saddle coil placed within a 1H volume coil and positioned at the isocenter of a 9.4T MRI scanner (Bruker Biospin Co., Billerica, MA). An air pressure cuff was placed proximal to the coil. Body temperature was maintained at above 35°C via a feedback control system (SA Instruments, Stony Brook, New York, USA). The respiratory rate was maintained between 45 and 60 breaths per minute by manually adjusting the anesthesia level. The animal protocol was approved by the Institutional Animal Care and Use Committee of Case Western Reserve University.
Following initial stabilization, shimming, and B1 power calibrations, CK-MRF and MT-MRS data were acquired at baseline. Due to their substantially different acquisition times for a single-average dataset (20 s for CK-MRF versus 150 s for MT-MRS), 24 repetitions of CK-MRF data (8 min acquisition) and 4 repetitions of MT-MRS data (10 min acquisition) were acquired in an interleaved manner. A total of 96 repetitions of CK-MRF data and 12 repetitions of MT-MRS data were acquired. 14 rats subsequently underwent two rounds of ischemia/reperfusion (IR) before a second data collection session. Ischemia was induced by inflating the cuff to above 200 mmHg and lasted for 17 min. The ischemic period was followed by 17 minutes of reperfusion. At the end of the IR protocol, another session of data collection started, in which a total of 48 repetitions of CK-MRF data and 8 repetitions of MT-MRS data were acquired.
High SNR signals were obtained by averaging all repetitions from a data acquisition session in data analysis. For CK-MRF, this amounted to 96 and 48 averages for data acquired at baseline and post-IR, corresponding to a total acquisition time of 32 and 16 min, respectively. For MT-MRS, the number of signal averages was 12 and 8 at baseline and post-IR, corresponding to 30- and 20-min acquisition, respectively.
Three rats were used as the controls. They underwent the same data collection sessions, separated by a 70-min period, during which CK-MRF and FAST data were collected. An additional 4 rats were also used for the comparison between CK-MRF and FAST methods. Acquisition of 24 repetitions of CK-MRF data and 120 repetitions of FAST data were interleaved, corresponding to approximately 8-min acquisition for each method. A total of 96 and 480 repetitions were collected for the CK-MRF and FAST methods, respectively.
Statistical Analysis
All data processing, simulations, and statistical analysis were performed by custom-built software written in Matlab (Mathworks, Natick, MA). All results are presented as mean ± SD. Bland-Altman plot was used to compare CK-MRF and MT-MRS measurements with high SNR. The coefficient of variation (CV) of an estimated parameter, calculated as the ratio of the standard deviation to the mean, was used to assess the reproducibility. Two-tailed paired Student’s t-test was used to determine the significance of any observed differences between the CK-MRF and MT-MRS or FAST methods, or before and after IR. Two-tailed unpaired Student’s t-test were used to determine the significance of differences observed following IR compared to controls, as well as the differences between coefficients of variation in reproducibility study. A p value less than 0.05 was considered significant.
Results
Performance of Parameter Quantification using Dictionary Based Approach
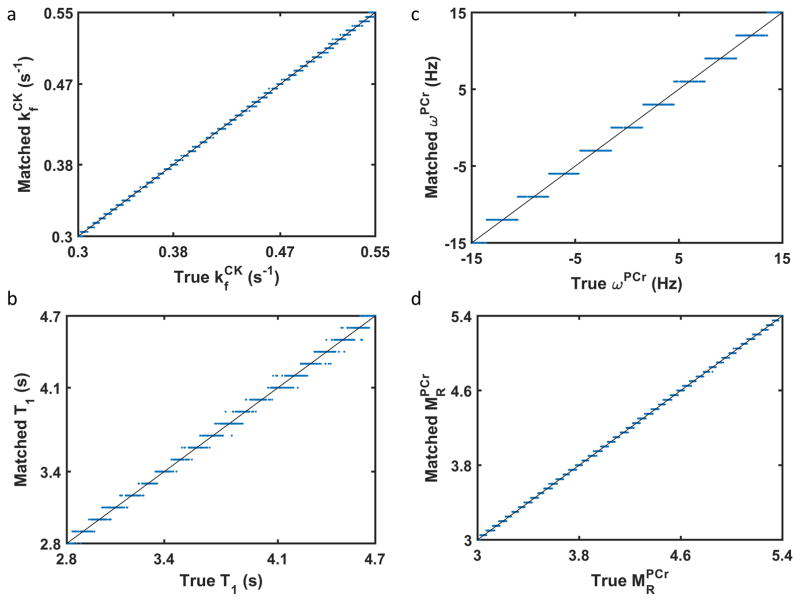
Figure 2 shows the performance of the dictionary approach for parameter quantification. The average errors for matched parameters were 0.0014 s−1 for the forward rate constant of CK ( ), 0.03 s for T1 of PCr ( ), 0.74 Hz for chemical shift of PCr (ωPCr), and 0.014 for PCr-to-ATP ratio ( ). The worst case error for each parameter was 0.006 s−1 for , 0.129 s for , 1.55 Hz for ωPCr, and 0.049 for . With the exception of , these errors were approximately one half of the dictionary step for each parameter.
Figure 2. Comparison of dictionary matched values with the ground truth values.
For each fingerprint generated using a random set of values for the four parameters to be determined, its dictionary matched parameter value for (a), (b), ωPCr (c), and (d) is plotted against its corresponding true value. Lines of identity are included in each plot.
Sensitivity of Parameter Quantification to Fixed Parameter Values
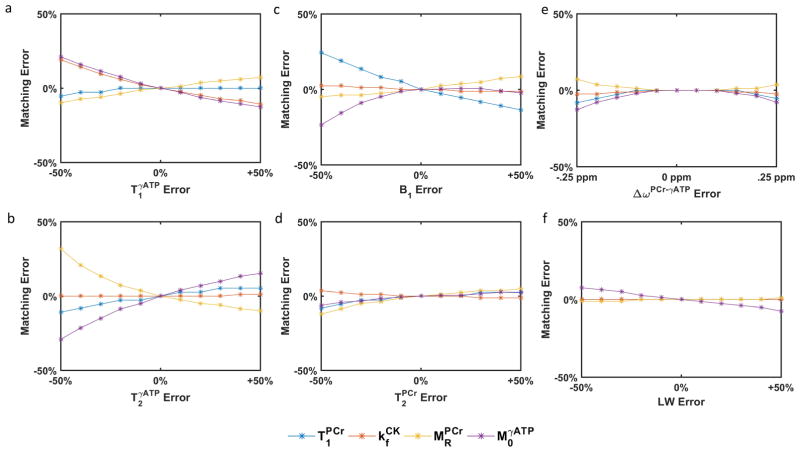
Figure 3 shows the effects of discrepancies in fixed parameters on the accuracy of the estimation of , and . No error in ωPCr was observed in any of the tested ranges. Discrepancies in , and B1 resulted in errors with various degrees in the matched parameters. Specifically, overestimation of caused underestimation of and and overestimation of (Figure 3a). Errors in led to less than 5% error in matched for the range investigated but resulted in errors primarily in and (Figure 3b). A miscalibration in B1 power resulted in significant errors in matched and but minimally affected and (Figure 3c). Finally, errors in ΔωPCr−γATP, and LW caused relatively small errors in all matched parameters (Figure 3d–f).
Figure 3.
Errors in matched parameters , and caused by using values for fixed parameters that differ from those assumed when generating the dictionary: (a), (b), B1 (c), (d), ΔωPCr−γATP (e), and LW (f).
Sensitivity of Parameters Quantification to Pi-to-ATP Exchange
Figure 1S shows the matching errors caused by using a two-pool exchange model. The effects of Pi-to-ATP exchange on the accuracy of the matched parameters were evaluated by increasing both the forward rate constant of Pi-to-ATP ( , Figure 1Sa) and the Pi-to-ATP concentration ratio ( , Figure 1Sb). At the current dictionary resolution, parameter matching using the two-pool exchange model produced no detectable errors until surpassed 0.17 s−1. An increase in from 0.17 to 0.4 s−1 resulted in errors in the estimation of , and by −1.2, 1.2, and 2.7% respectively (i.e. one dictionary step). Similarly, increase in Pi-to-ATP ratio produced no detectable errors until it surpassed 0.35. As increased to 2.0, errors in , and increased, but remained below 5%. No errors in ωPCr were observed in any cases.
Sensitivity of Quantification to Selective Saturation Power
The errors introduced by not fully modeling the spillover effect of the saturation pulses are shown in Figure 2S. Each investigated method showed a power-dependent error in quantification. For CK-MRF and MT-MRS, an “optimal” saturation power was available that could obtain error-free quantification. Using a lower than “optimal” saturation power for both methods would lead to underestimation of , due to incomplete saturation of γATP. Using a higher than “optimal” saturation power led to overestimation of due to incomplete correction of the spillover on PCr. Errors in estimation by CK-MRF were comparable to conventional MT-MRS, while the FAST method showed a ~6% underestimation of throughout the range of RF power investigated. MT-MRS using the Kingsley-Monahan correction method showed least errors comparing to the other methods.
In Vivo Results
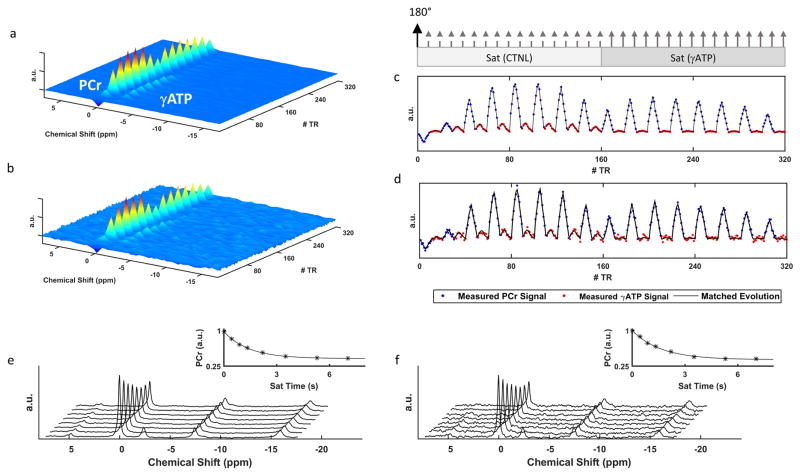
Representative spectra acquired in vivo using CK-MRF and conventional MT-MRS methods are shown in Figure 4. The corresponding fingerprints and their matched dictionary entries are also shown. For a 96-average CK-MRF acquisition, SNR of PCr in Fourier-transformed spectra typically varied from 3 to 270 from the lowest to highest flip angles (from 2.6° to 82°), and SNR of ATP varied from 0.2 to 51. In comparison, for MT-MRS measurements, SNR of PCr from a 12-average acquisition was 294 and 118 in spectra acquired without saturation and with 7-s saturation, respectively. SNR of ATP was 42 in spectra acquired without saturation. With 96 signal averages, the average inner product between an acquired fingerprint and its matching dictionary entry was 0.998 ± 0.001. The inner product between a single-averaged fingerprint and its matching dictionary entry was 0.981 ± 0.008.
Figure 4. Representative in vivo CK-MRF spectra and fingerprints.
a and b. 31P spectra with 96 (a) and single (b) signal average(s). c and d. The corresponding fingerprints and their dictionary matches from 96 (c) and single (d) signal average(s). Blue and red data points represent PCr and γATP peaks, respectively. Relative timings for inversion and saturation pulses are indicated at the top. Dashed and solid arrows indicate contralateral and γATP saturation pulses, respectively. e and f. 31P spectra from 12 (e) and single (f) signal average(s) by MT-MRS. Results of the corresponding curve fitting to PCr signal are shown in the insets.
Comparison of In Vivo CK-MRF
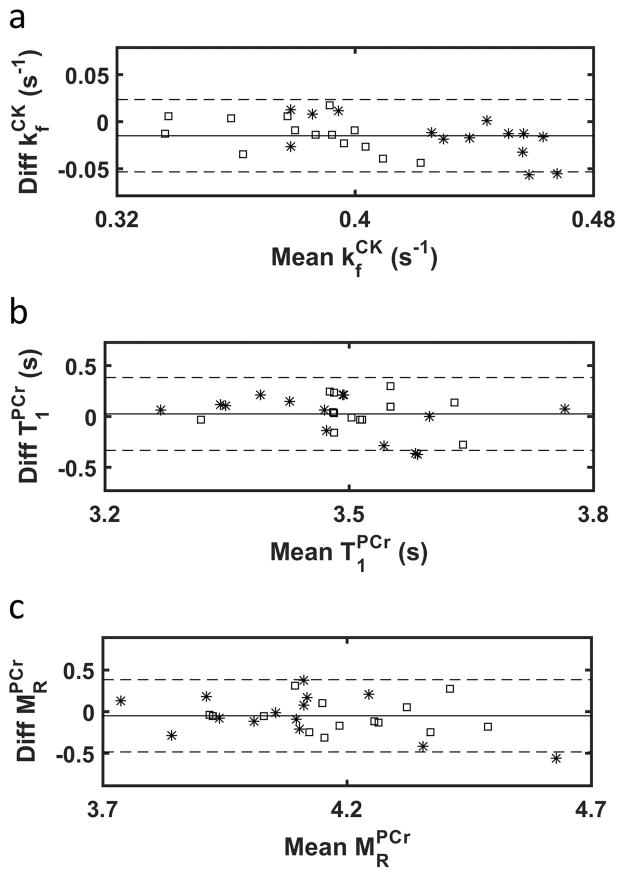
Figure 5 shows the Bland-Altman comparison of , and estimation obtained from high SNR data for both CK-MRF and MT-MRS, with group statistics summarized in Table 1. The use of CK-MRF led to a slight underestimation of with a difference of (−3.6±4.8)% (p<0.05). Differences in and estimation were insignificant with values of (0.7±5.3)% and (−1.2±5.3)%, respectively.
Figure 5. Comparison between parameter measurements by CK-MRF and MT-MRS.
Bland-Altman plots are shown for (a), (b), and (c). Squares indicate pre-IR data and stars indicate post-IR data. Solid lines indicate mean differences and dashed lines indicate limits of agreement.
Table 1.
Summary of Estimated Parameter Values Pre-IR and Post-IR (n=17)
| Acq Time (min) | Signal Averages | (s−1) | (s) |
|
|||
|---|---|---|---|---|---|---|---|
| Pre-IR | MT-MRS | 30 | 12 | 0.39 ± 0.03 | 3.49 ± 0.11 | 4.22 ± 0.20 | |
| CK-MRF | 32 | 96 | 0.38 ± 0.02* | 3.54 ± 0.11 | 4.16 ± 0.19 | ||
|
| |||||||
| Post-IR | MT-MRS | 20 | 8 | 0.44 ± 0.04† | 3.48 ± 0.19 | 4.11 ± 0.30 | |
| CK-MRF | 16 | 48 | 0.42 ± 0.03*† | 3.49 ± 0.13 | 4.07 ± 0.19† | ||
p<0.05, MT-MRS versus CK-MRF
p<0.05, Pre-IR versus Post IR
Compared to baseline values, both methods detected a significant post-IR increase in of ~13% (p<0.05). This increase was also significant compared to changes observed in control animals. Additionally, a decrease in was observed in post-IR data from both CK-MRF and MT-MRS methods. However, only the differences detected by CK-MRF were found to be significant.
Reproducibility of In Vivo CK-MRF vs MT-MRS
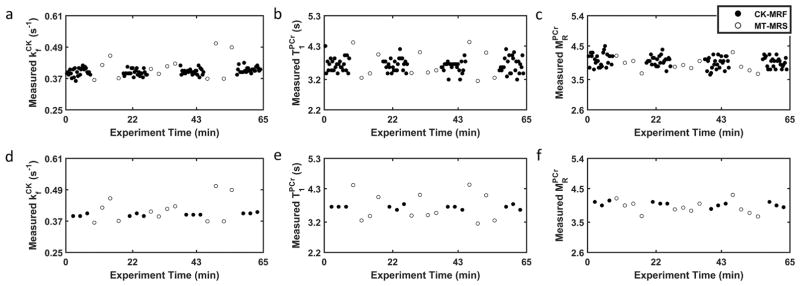
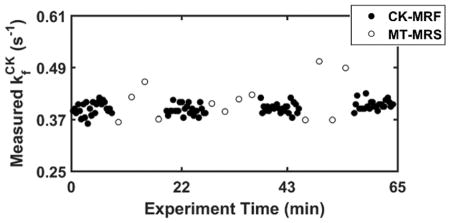
Representative time courses of repeated parameter measurements by CK-MRF and MT-MRS during a data collection session at baseline are shown in Figure 6. The difference in measurement density for single-average data (Figures 6a–c) is due to the difference in acquisition time between the two methods (20 versus 150 s). Comparison between measurements made with approximately equal acquisition time (140 versus 150 s), i.e. seven averages for CK-MRF, are shown in Figures 6d–f. Parameter values obtained from 20-, 140-, and 150-s acquisition are presented in Table 2. These values did not differ significantly from those obtained from ~30-min acquisition (Table 1).
Figure 6. Repeated parameter measurements for reproducibility assessment.
Sequentially acquired CK-MRF (filled circles) and MT-MRS (open circles) measurements during a data collection session are shown. a–c. (a), (b), and (c) estimation obtained from single-average data for both CK-MRF (20-s acquisition) and MT-MRS (150-s acquisition). d–f. (d), (e), and (f) estimation obtained from 7 signal averages for CK-MRF (140-s acquisition) and single average for MR-MRS (150-s acquisition).
Table 2.
Estimated Parameters in Reproducibility Study
| Acq Time (s) | Signal Averages | (s−1) | (s) |
|
|||
|---|---|---|---|---|---|---|---|
| CK-MRF versus MT-MRS (n=17) | MT-MRS | 150 | 1 | 0.40 ± 0.04 | 3.53 ± 0.44 | 4.22 ± 0.38 | |
| CK-MRF | 20 | 1 | 0.38 ± 0.03 | 3.57 ± 0.25 | 4.17 ± 0.25 | ||
| CK-MRF | 140 | 7 | 0.38 ± 0.02 | 3.57 ± 0.13 | 4.16 ± 0.19 | ||
|
| |||||||
| CK-MRF Versus FAST (n=7) | FAST | 20 | 5 | 0.38 ± 0.11 | 2.63 ± 0.34 | 4.52 ± 0.85 | |
| CK-MRF | 20 | 1 | 0.38 ± 0.02 | 3.57 ± 0.21 | 4.20 ± 0.20 | ||
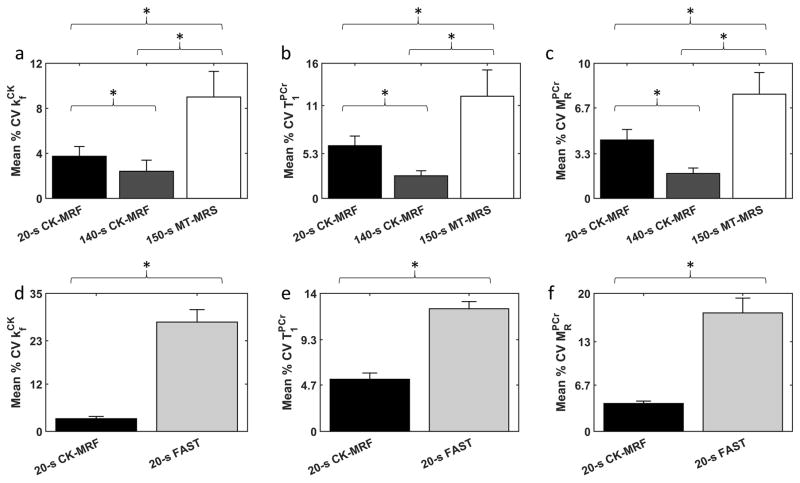
To separate the effects of inter-animal variations, the coefficient of variation (CV) for each parameter was calculated for each animal (Figure 7). Average CV of from 20-s CK-MRF acquisition was 42% of the size of the CV from 150-s MT-MRS acquisition (p<0.05, Figure 7a). With equal acquisition time, the CV of estimated by CK-MRF further reduced to 26% of the CV by MT-MRS. The CV of and estimated by CK-MRF were also significantly smaller than by MT-MRS for both 20-s and 140-s acquisition (Figure 7b–c). Finally, the CV of parameters estimated by CK-MRF was significantly smaller than that generated using FAST (p<0.05, Figure 7d–f). Specifically, CV of from CK-MRF was 12% of that by FAST for 20-s acquisitions.
Figure 7. Reproducibility of parameter estimation.
Coefficient of variation (CV, defined as SD divided by the mean of the measurements) was compared between CK-MRF and MT-MRS methods (a–c) and between CK-MRF and FAST methods (d–f), for parameters (a, b), (c, d), and (e, f). Acquisition times denoted represent time spent for a single measurement, including all signal averages but excluding dummy and control scans. Column height and error bars represent mean and SD of CV across animals. All comparisons are statistically significant (p<0.05).
Discussion
In this work, a novel 31P CK-MRF method to quantify CK rate based on the MRF framework has been proposed. Simulation studies were used to characterize the sensitivity of CK-MRF measurements to several potential sources of errors. The accuracy and reproducibility of the CK-MRF method was evaluated in vivo against a conventional MT-MRS method. Previously, it has been shown in 31P spectroscopic imaging that bSSFP-based approach offers a high gain of SNR per unit time with preserved coherence of magnetization24. In the current study, a bSSFP-type pulse sequence was used with a unique RF and acquisition scheme. While the interleaved saturation and acquisition scheme gave rise to MT-modulated signal evolution, the MT effect was further enhanced by the use of bSSFP-like acquisition that allowed the history of signal evolution to be preserved throughout data acquisition. In addition, the combination of inversion recovery and saturation transfer also allowed greater separation between dictionary entries. As a result, the CK-MRF method showed improved acquisition time and reproducibility for quantification of CK rate, as demonstrated by in vivo experiments.
It is worth noting that acquisition time and reproducibility must be considered together when evaluating the efficiency of a method. In the current study, the CK-MRF method was able to quantify in vivo in 20 s with a coefficient of variation of only 3.7%. Compared to the MT-MRS method, this demonstrated both an improvement in measurement reproducibility (CV for of 3.7 versus 9% for CK-MRF and MT-MRS, respectively), as well as a reduction in acquisition time (20 s versus 150 s for CK-MRF and MT-MRS, respectively). Although acquisition parameters for MT-MRS used in the current study were not optimized, it is unlikely that its acquisition time can be significantly reduced without compromising the reproducibility. The reproducibility of CK-MRF was also benchmarked in the context of equal acquisition time. CK-MRF also showed significantly reduced CV in quantification with the same acquisition time when compared to MT-MRS and FAST methods. Acquisition time for conventional MT methods can be further reduced by using a fixed value18,19, which was not investigated in the current study. Future investigation comparing these approaches is warranted.
The CK-MRF method may provide the potential for spatially localized CK measurement with improved efficiency. Spatial localization is a long-standing challenge for MT-MRS methods due to the additional SNR penalty for spatial encoding. Using CK-MRF, more signal averages can be achieved within the same acquisition time. Furthermore, since CK-MRF data are acquired using spectrally selective excitation, it has the advantage of allowing spatial encoding to be performed using imaging methods rather than the more time-consuming CSI methods. A previous study using conventional MT-MRS method in combination with spectrally selective excitation has demonstrated feasibility of mapping on a 7T clinical system in less than 60 min31. CK-MRF combined with spatial encoding may allow further reduction of the acquisition time.
The baseline and PCr-to-ATP ratio ( ) obtained in this work are consistent with those reported previously32. The slight decrease in after two rounds of IR is also consistent with a previous study in pig muscle subject to three rounds of IR33. In conjunction with the decrease in PCr, an increase in post-IR was detected by both MT-MRS and CK-MRF methods. While this increase has not been reported previously, it might be a result of the decreased PCr concentration or concentration changes in other high-energy phosphate metabolites such as ADP. Previously, McFarland et al observed increased with decreased PCr content in stimulated perfused soleus muscle34, which was attributed to the concurrent increase in ADP concentration based on the Michaelis-Menten kinetics35,36. However, studies using longer ischemic duration have observed decrease in both and PCr concentration3,37. The mechanisms and the relationship between ischemia duration and subsequent changes in creatine kinase kinetics need further investigation.
In the current study, several parameters, including , ΔωPCr−γATP, linewidth, and B1, used fixed values instead of being matched to reduce computation time and memory requirements. Insensitivity to these fixed parameters is a desirable quality for pulse sequence design for several reasons. First, it allows accurate measurement of the matched parameters without precise pilot measurements of these fixed parameters. Second, it allows a single dictionary to be computed for a particular study, despite minor inter-subject and inter-measurement variations such as in metabolite T2 values38. Robustness to B1 errors is of particular importance as many 31P MRS studies are performed using surface coils with significant B1 inhomogeneity. Our simulation results show that errors in measurement was less than 3% in the presence of ±50% error in B1 flip angle. Further, in vivo measurements of also showed strong agreement with both MT-MRS and FAST measurements. However, our current study was performed using a saddle coil. Whether this robustness to B1 miscalibration is sufficient for measurements using surface coils needs further investigation.
CK-MRF also showed tolerance to physiological variations such as Pi exchange rate with γATP. Simulations using values associated with resting rat skeletal muscle39 showed no detectable errors. While Pi exchange rates with ATP may be higher in other organs or physiological conditions, simulations showed less than 5% error in measurement even with over a fivefold increase in either the rate of Pi to ATP or the concentration of Pi compared to that of resting skeletal muscle.
A limitation of the current study is that the value of was fixed rather than matched to reduce the computation time and memory requirements during parameter estimation. Unlike MT-MRS method in which does not affect the kinetics of PCr signal, in CK-MRF method, errors in fixed parameter do have the potential to cause significant errors in measurement. This error is approximately 30% the size of the error in . Hence, variations in under pathophysiological conditions need to be carefully evaluated. In vivo measurement of is nontrivial, especially for the current CK-MRF method because the magnetization of αATP and βATP is not disturbed. Hence, the intramolecular NOE effects between γATP and αATP and between γATP and βATP also need to be considered. While this may be addressed by expanding the Bloch-McConnell equation to include these effects through additional exchanging pools6, substantial validation of such an approach would be needed to evaluate its potential accuracy and robustness.
Another limitation of the proposed CK-MRF method is that the data acquisition scheme using selective RF excitation only samples PCr and γATP magnetization. As a result, other information that are available in conventional 31P MT-MRS methods, such as Pi-to-ATP exchange, pH and PDE and ADP concentrations, cannot be obtained from CK-MRF data. While pH and metabolite concentrations can be obtained from a conventional 31P spectrum, the quantification of Pi-to-ATP exchange is much more challenging due to the low concentration of Pi. On the other hand, it has been shown that the Pi-to-ATP exchange is more relevant in diseases that affect skeletal muscle9. The development of a fast and robust MRF method that also enables the quantification of the Pi-to-ATP exchange should be a priority for future work.
Continuous wave RF pulses were used in the CK-MRF method to perform selective saturation. The spillover effect on PCr was partially accounted for by applying contralateral saturation pulses. Simulations show that the errors introduced by such an approach were power dependent, and the errors were comparable to those observed in conventional MT-MRS method. The observed 3.6% underestimation in by CK-MRF is consistent with the bias expected between the two methods for a saturation power between 11 to 14 Hz. With improved mapping of the B1 field, these errors may be correctable by using explicit methods29, or by building saturation power into the dictionary as an additional fixed or matched parameter. Alternatively, continuous wave RF may be replaced by another saturation pulse such as BISTRO40 with reduced spillover effect.
To reduce computation time and memory requirements, the current dictionary choice of matched parameters and parameter resolution was selected as an acceptable tradeoff between potential errors size and dictionary computation and memory size. Simulation results showed that the current dictionary resolution resulted in the nearest-neighbor match for matched parameters, with the exception of , where the next-nearest-neighbor may also be matched. This result implies that the accuracy of parameter match can be further improved by using a dictionary resolution with a finer resolution.
In conclusion, this work is a first step towards quantifying phosphate metabolism using the MRF framework. CK-MRF was able to significantly increase measurement reproducibility compared to the conventional 31P MT-MRS method while exhibiting robustness to several error sources. The improvement in measurement efficiency may be leveraged in several ways, such as more accurate measurements made in equivalent experimental time, or reduced experimental time with equivalent measurement accuracy, allowing for new applications of 31P studies on tissue metabolism.
Supplementary Material
Acknowledgments
Sponsors: This work was supported by grants from the National Institute of Health R21-HL126215, R01-HL73315, F30-HL124894, T32-EB007509, TL1-TR000441, T32-GM007250, R01-HL94557, R01-DK98503, and from the National Science Foundation CBET1553441.
This work made use of the High Performance Computing Resource in the Core Facility for Advanced Research Computing at Case Western Reserve University.
Abbreviations
- 31P
phosphorus-31
- ACQ-PCr
acquisition block with PCr excitation
- ACQ-γATP
acquisition block with γATP excitation
- ADP
adenosine diphosphate
- ATP
adenosine triphosphate
- bSSFP
balanced steady-state free precession
- CK
creatine kinase
- CK-MRF
creatine kinase encoded magnetic resonance fingerprinting
- CSI
chemical shift imaging
- CV
coefficient of variation
- FAST
four angle saturation transfer
- FID
free induction decay
- LW
linewidth
- NOE
nuclear Overhauser effect
- MRF
magnetic resonance fingerprinting
- MT
magnetization transfer
- MT-MRS
magnetization-transfer encoded magnetic resonance spectroscopy
- PCr
phosphocreatine
- Pi
inorganic phosphate
- SAT-γATP
selective saturation block applied on γATP resonance
- SAT-CNTL
selective saturation block applied contralateral to γATP resonance relative to phosphocreatine resonance
- SD
standard deviation
- TR
repetition time
Appendix
Signal evolutions in response to a pulse sequence were simulated using the Bloch-McConnell equations16,26. The matrix form of the Bloch-McConnell equations can be expressed as:
| [A1] |
where M is a vector that describes the evolution of the transverse and longitudinal magnetization. For two exchanging species PCr and γATP, M is defined as:
| [A2] |
C is a vector that describes the steady-state magnetization weighted by the longitudinal relaxation, i.e.,
| [A3] |
where and are the steady-state magnetization and and are the longitudinal relaxation time for PCr and γATP, respectively. A is a matrix that describes the precession, relaxation, and magnetization exchange between PCr and γATP. For PCr and γATP with resonance frequencies ωPCrand ωγATP observed in a rotating frame of frequency ω, A matrix can be expressed as:
| [A4] |
where and are the transverse relaxation time of PCr and γATP, respectively. ΔωPCr and ΔωγATP are the difference between the resonance frequency of PCr (ωPCr ) and γATP (ωγATP ) from the frequency of the rotating frame (ω.), i.e., ΔωPCr = ωPCr − ω and ΔωγATP = ωγATP − ω. Δω0 is the frequency dispersion term used to account for B0 field inhomogeneity. and are the forward and reverse exchange rate from PCr to γATP, respectively. Chemical equilibrium was assumed for all simulations such that:
| [A5] |
Starting from a fully relaxed spin system, signal evolutions in response to a pulse sequence were simulated by iteratively solving for M in discrete time steps (Δt) using the discrete time solution for Equation A1:
| [A6] |
where MN and MN+1 are magnetization vectors before and after an iteration.
RF pulses were modeled as discretized instantaneous rotations about the x- and y-axis of the rotating frame:
| [A7] |
where M− and M+ are the magnetization vector before and after the RF pulse, and Rx(αx) and Ry(αy) are the rotation matrix about the x- and y-axis with flip angles αx and αy, respectively, i.e.,
| [A8] |
| [A9] |
Once M is solved, the FID signal, i.e., the transverse magnetization M⊥, was computed as
| [A10] |
To account for the effects of B0 inhomogeneity, simulations were repeated with 51 different values of Δω0 ranging from −75 to 75 Hz with a uniform resolution of 3 Hz. The total signal, S(t), was calculated as the weighted sum of 51 simulations:
| [A11] |
where W(Δω0) is the corresponding weight for a frequency component derived from a Lorentzian lineshape with a linewidth LW:
| [A12] |
References
- 1.El-Sharkawy A-MM, Gabr RE, Schär M, Weiss RG, Bottomley PA. Quantification of human high-energy phosphate metabolite concentrations at 3 T with partial volume and sensitivity corrections. NMR Biomed. 2013;26(11):1363–1371. doi: 10.1002/nbm.2961. [DOI] [PMC free article] [PubMed] [Google Scholar]
- 2.Neubauer S, Horn M, Cramer M, Harre K, Newell JB, Peters W, Pabst T, Ertl G, Hahn D, Ingwall JS, Kochsiek K. Myocardial phosphocreatine-to-ATP ratio is a predictor of mortality in patients with dilated cardiomyopathy. Circulation. 1997;96(7):2190–2196. doi: 10.1161/01.cir.96.7.2190. [DOI] [PubMed] [Google Scholar]
- 3.Bittl JA, Balschi JA, Ingwall JS. Contractile failure and high-energy phosphate turnover during hypoxia: 31P-NMR surface coil studies in living rat. Circ Res. 1987;60(6):871–878. doi: 10.1161/01.res.60.6.871. [DOI] [PubMed] [Google Scholar]
- 4.Koretsky AP, Wang S, Murphy-Boesch J, Klein MP, James TL, Weiner MW. 31P NMR spectroscopy of rat organs, in situ, using chronically implanted radiofrequency coils. Proc Natl Acad Sci U S A. 1983;80(24):7491–7495. doi: 10.1073/pnas.80.24.7491. [DOI] [PMC free article] [PubMed] [Google Scholar]
- 5.Bittl JA, Ingwall JS. Reaction rates of creatine kinase and ATP synthesis in the isolated rat heart. A 31P NMR magnetization transfer study. J Biol Chem. 1985;260(6):3512–3517. [PubMed] [Google Scholar]
- 6.Ren J, Yang B, Sherry aD, Malloy CR. Exchange kinetics by inversion transfer: integrated analysis of the phosphorus metabolite kinetic exchanges in resting human skeletal muscle at 7 T. Magn Reson Med. 2015;73(4):1359–1369. doi: 10.1002/mrm.25256. [DOI] [PMC free article] [PubMed] [Google Scholar]
- 7.Degani H, Laughlin M, Campbell S, Shulman RG. Kinetics of creatine kinase in heart: a 31P NMR saturation- and inversion-transfer study. Biochemistry. 1985;24(20):5510–5516. doi: 10.1021/bi00341a035. [DOI] [PubMed] [Google Scholar]
- 8.Leibfritz D, Dreher W. Magnetization transfer MRS. NMR Biomed. 2001;14(2):65–76. doi: 10.1002/nbm.681. [DOI] [PubMed] [Google Scholar]
- 9.Befroy DE, Rothman DL, Petersen KF, Shulman GI. 31P-magnetization transfer magnetic resonance spectroscopy measurements of in vivo metabolism. Diabetes. 2012;61(11):2669–2678. doi: 10.2337/db12-0558. [DOI] [PMC free article] [PubMed] [Google Scholar]
- 10.Balaban RS, Kantor HL, Ferretti JA. In vivo flux between phosphocreatine and adenosine triphosphate determined by two-dimensional phosphorous NMR. J Biol Chem. 1983;258(21):12787–12789. [PubMed] [Google Scholar]
- 11.Kingsley-Hickman PB, Sako EY, Mohanakrishnan P, Robitaille PM, From AH, Foker JE, Uđurbil K. 31P NMR studies of ATP synthesis and hydrolysis kinetics in the intact myocardium. Biochemistry. 1987;26(23):7501–7510. doi: 10.1021/bi00397a045. [DOI] [PubMed] [Google Scholar]
- 12.Robitaille PM, Merkle H, Sako E, Lang G, Clack RM, Bianco R, From AH, Foker J, Uđurbil K. Measurement of ATP synthesis rates by 31P-NMR spectroscopy in the intact myocardium in vivo. Magn Reson Med. 1990;15(1):8–24. doi: 10.1002/mrm.1910150103. [DOI] [PubMed] [Google Scholar]
- 13.Kingsley-Hickman PB, Sako EY, Uđurbil K, From AH, Foker JE. 31P NMR measurement of mitochondrial uncoupling in isolated rat hearts. J Biol Chem. 1990;265(3):1545–1550. [PubMed] [Google Scholar]
- 14.Ingwall JS. Phosphorus nuclear magnetic resonance spectroscopy of cardiac and skeletal muscles. Am J Physiol. 1982;242(5):H729–44. doi: 10.1152/ajpheart.1982.242.5.H729. [DOI] [PubMed] [Google Scholar]
- 15.Lei H, Zhu X, Zhang X, Ugurbil K, Chen W. In vivo 31P magnetic resonance spectroscopy of human brain at 7 T: an initial experience. Magn Reson Med. 2003;49(2):199–205. doi: 10.1002/mrm.10379. [DOI] [PubMed] [Google Scholar]
- 16.Bottomley PA, Ouwerkerk R, Lee RF, Weiss RG. Four-angle saturation transfer (FAST) method for measuring creatine kinase reaction rates in vivo. Magn Reson Med. 2002;47(5):850–863. doi: 10.1002/mrm.10130. [DOI] [PMC free article] [PubMed] [Google Scholar]
- 17.Schär M, El-Sharkawy A-MM, Weiss RG, Bottomley PA. Triple repetition time saturation transfer (TRiST) 31P spectroscopy for measuring human creatine kinase reaction kinetics. Magn Reson Med. 2010;63(6):1493–1501. doi: 10.1002/mrm.22347. [DOI] [PMC free article] [PubMed] [Google Scholar]
- 18.Schär M, Gabr RE, El-Sharkawy A-MM, Steinberg A, Bottomley PA, Weiss RG. Two repetition time saturation transfer (TwiST) with spill-over correction to measure creatine kinase reaction rates in human hearts. J Cardiovasc Magn Reson. 2015;17(1):70. doi: 10.1186/s12968-015-0175-4. [DOI] [PMC free article] [PubMed] [Google Scholar]
- 19.Xiong Q, Du F, Zhu X, Zhang P, Suntharalingam P, Ippolito J, Kamdar FD, Chen W, Zhang J. ATP production rate via creatine kinase or ATP synthase in vivo: a novel superfast magnetization saturation transfer method. Circ Res. 2011;108(6):653–663. doi: 10.1161/CIRCRESAHA.110.231456. [DOI] [PMC free article] [PubMed] [Google Scholar]
- 20.Ma D, Gulani V, Seiberlich N, Liu K, Sunshine JL, Duerk JL, Griswold MA. Magnetic resonance fingerprinting. Nature. 2013;495(7440):187–192. doi: 10.1038/nature11971. [DOI] [PMC free article] [PubMed] [Google Scholar]
- 21.Jiang Y, Ma D, Seiberlich N, Gulani V, Griswold Ma. MR fingerprinting using fast imaging with steady state precession (FISP) with spiral readout. Magn Reson Med. 2015;74(6):1621–1631. doi: 10.1002/mrm.25559. [DOI] [PMC free article] [PubMed] [Google Scholar]
- 22.Chen Y, Jiang Y, Pahwa S, Ma D, Lu L, Twieg MD, Wright KL, Seiberlich N, Griswold MA, Gulani V. MR Fingerprinting for Rapid Quantitative Abdominal Imaging. Radiology. 2016;279(1):278–286. doi: 10.1148/radiol.2016152037. [DOI] [PMC free article] [PubMed] [Google Scholar]
- 23.Hamilton JI, Jiang Y, Chen Y, Ma D, Lo WC, Griswold M, Seiberlich N. MR fingerprinting for rapid quantification of myocardial T1, T2, and proton spin density. Magn Reson Med. 2016:0. doi: 10.1002/mrm.26216. [DOI] [PMC free article] [PubMed] [Google Scholar]
- 24.Speck O, Scheffler K, Hennig J. Fast 31P chemical shift imaging using SSFP methods. Magn Reson Med. 2002;48(4):633–639. doi: 10.1002/mrm.10279. [DOI] [PubMed] [Google Scholar]
- 25.Deshpande VS, Chung Y-C, Zhang Q, Shea SM, Li D. Reduction of transient signal oscillations in true-FISP using a linear flip angle series magnetization preparation. Magn Reson Med. 2003;49(1):151–157. doi: 10.1002/mrm.10337. [DOI] [PubMed] [Google Scholar]
- 26.Deoni SCL, Rutt BK, Jones DK. Investigating exchange and multicomponent relaxation in fully-balanced steady-state free precession imaging. J Magn Reson Imaging. 2008;27(6):1421–1429. doi: 10.1002/jmri.21079. [DOI] [PubMed] [Google Scholar]
- 27.Nabuurs C, Huijbregts B, Wieringa B, Hilbers CW, Heerschap A. 31P saturation transfer spectroscopy predicts differential intracellular macromolecular association of ATP and ADP in skeletal muscle. J Biol Chem. 2010;285(51):39588–39596. doi: 10.1074/jbc.M110.164665. [DOI] [PMC free article] [PubMed] [Google Scholar]
- 28.Bashir A, Gropler R. Reproducibility of creatine kinase reaction kinetics in human heart: a (31) P time-dependent saturation transfer spectroscopy study. NMR Biomed. 2014;27(6):663–671. doi: 10.1002/nbm.3103. [DOI] [PMC free article] [PubMed] [Google Scholar]
- 29.Kingsley PB, Monahan WG. Corrections for off-resonance effects and incomplete saturation in conventional (two-site) saturation-transfer kinetic measurements. Magn Reson Med. 2000;43(6):810–819. doi: 10.1002/1522-2594(200006)43:6<810::aid-mrm6>3.0.co;2-j. [DOI] [PubMed] [Google Scholar]
- 30.Liu Y, Mei X, Li J, Lai N, Yu X. Mitochondrial function assessed by 31P MRS and BOLD MRI in non-obese type 2 diabetic rats. Physiol Rep. 2016;4(15):e12890. doi: 10.14814/phy2.12890. [DOI] [PMC free article] [PubMed] [Google Scholar]
- 31.Parasoglou P, Xia D, Chang G, Convit A, Regatte RR. Three-dimensional mapping of the creatine kinase enzyme reaction rate in muscles of the lower leg. NMR Biomed. 2013;26(9):1142–1151. doi: 10.1002/nbm.2928. [DOI] [PMC free article] [PubMed] [Google Scholar]
- 32.Shoubridge EA, Bland JL, Radda GK. Regulation of creatine kinase during steady-state isometric twitch contraction in rat skeletal muscle. BBA - Mol Cell Res. 1984;805(1):72–78. doi: 10.1016/0167-4889(84)90038-7. [DOI] [PubMed] [Google Scholar]
- 33.Pang CY, Neligan P, Xu H, He W, Zhong A, Hopper R, Forrest CR. Role of ATP-sensitive K+ channels in ischemic preconditioning of skeletal muscle against infarction. Am J Physiol. 1997;273(1 Pt 2):H44–51. doi: 10.1152/ajpheart.1997.273.1.H44. [DOI] [PubMed] [Google Scholar]
- 34.McFarland EW, Kushmerick MJ, Moerland TS. Activity of creatine kinase in a contracting mammalian muscle of uniform fiber type. Biophys J. 1994;67(5):1912–1924. doi: 10.1016/S0006-3495(94)80674-5. [DOI] [PMC free article] [PubMed] [Google Scholar]
- 35.Morrison JF, Cleland WW. Isotope exchange studies of the mechanism of the reaction catalyzed by adenosine triphosphate: creatine phosphotransferase. J Biol Chem. 1966;241(3):673–683. [PubMed] [Google Scholar]
- 36.Schimerlik MI, Cleland WW. Inhibition of creatine kinase by chromium nucleotides. J Biol Chem. 1973;248(24):8418–8423. [PubMed] [Google Scholar]
- 37.Neubauer S, Hamman BL, Perry SB, Bittl JA, Ingwall JS. Velocity of the creatine kinase reaction decreases in postischemic myocardium: a 31P-NMR magnetization transfer study of the isolated ferret heart. Circ Res. 1988;63(1):1–15. doi: 10.1161/01.res.63.1.1. [DOI] [PubMed] [Google Scholar]
- 38.Bogner W, Chmelik M, Schmid AI, Moser E, Trattnig S, Gruber S. Assessment of (31)P relaxation times in the human calf muscle: a comparison between 3 T and 7 T in vivo. Magn Reson Med. 2009;62(3):574–582. doi: 10.1002/mrm.22057. [DOI] [PubMed] [Google Scholar]
- 39.van den Broek NM, Ciapaite J, Nicolay K, Prompers JJ. Comparison of in vivo postexercise phosphocreatine recovery and resting ATP synthesis flux for the assessment of skeletal muscle mitochondrial function. AJP Cell Physiol. 2010;299(5):C1136–C1143. doi: 10.1152/ajpcell.00200.2010. [DOI] [PubMed] [Google Scholar]
- 40.Luo Y, de Graaf RA, DelaBarre L, Tannús A, Garwood M. BISTRO: an outer-volume suppression method that tolerates RF field inhomogeneity. Magn Reson Med. 2001;45(6):1095–1102. doi: 10.1002/mrm.1144. [DOI] [PubMed] [Google Scholar]
Associated Data
This section collects any data citations, data availability statements, or supplementary materials included in this article.


