Abstract
The purpose of this study was to assess the influence of different reconstruction factors in N-ω-fluoropropyl-2β-carbomethoxy-3β-(4-I-123 iodophenyl)nortropane (I-123 FP-CIT) single-photon emission computed tomography (SPECT) images for the diagnosis of dopaminergic system neurodegeneration (DSND).
Seventy-three patients (38 females, 35 males) suspected of DSND were included in this study. The patients were divided into 3 groups on the basis of their final clinical diagnoses; patients with Parkinson disease (group 1, n = 36), patients with other DSND (group 2, n = 19), patients without DSND (group 3, n = 18). FP-CIT accumulation in the striata was evaluated visually and semiquantitatively. SPECT images were classified visually as normal or abnormal based on the previous report. For semiquantitative analysis, we used DaTView software (Aze Corporation), and specific binding ratios (SBR) and asymmetry indices (AI) were calculated. Visual and semiquantitative evaluations for different reconstruction factors were compared among the 3 groups.
In the visual evaluation, there were no differences among DSND diagnostic capabilities of attenuation and scatter correction by computed tomography attenuation correction scatter correction, computed tomography attenuation correction, Chang attenuation correction, and non-attenuation and -scatter correction. In the semiquantitative evaluation, receiver operating characteristic analysis of SBR and AI for clinical DSND diagnostic ability (group 1+2 vs 3) showed no significant difference among the reconstruction factors by multiple comparisons.
Although the values of SBR and AI were changed and image quality could be improved when attenuation correction and/or scatter correction were applied, the clinical impact of these reconstruction factors for the diagnosis of DSND was negligible.
Keywords: attenuation correction, dopaminergic system neurodegeneration, I-123 FP-CIT SPECT, reconstruction factor, scatter correction
1. Introduction
N-ω-fluoropropyl-2β-carbomethoxy-3β-(4-I-123 iodophenyl)nortropane (I-123 FP-CIT) single-photon emission computed tomography (SPECT) imaging is now widely used for the diagnosis and/or follow-up of Parkinsonian diseases (PD) and for the differentiation between diffuse Lewy body dementia (DLB) and Alzheimer disease (AD).[1,2] Besides visually evaluating the accumulation of I-123 FP-CIT in the striata, an objective quantification of the tracer uptake, which detects even a subtle reduction of radioisotope (RI) activity, could improve this imaging method's diagnostic potential. Because absolute quantification of the tracer accumulation requires invasive arterial blood sampling and dynamic SPECT scanning, several semiquantitative methods have been developed for the clinical setting.[3,4]
Tossici-Bolt et al[4] proposed an automated procedure measuring the specific binding ratio (SBR), or the ratio of the specific radioactivity in the striata divided by the nonspecific activity throughout the brain, using a geometrical volume of interest (VOI) technique. Although high intra- and interoperator reproducibility (the coefficients of variation were 3% and 4% respectively) and high diagnostic accuracy for PD or Parkinsonian syndromes (PS) (95%) were obtained by their technique, it was originally based on images reconstructed only with the attenuation correction (AC) of the Chang method, and neither a scatter nor a septal penetration correction was applied.[4]
Currently, United States[5] and European[6] guidelines recommend the use of AC in image processing of I-123 FP-CIT SPECT. The correction method provides better SPECT image quality[7] and might achieve more accurate diagnostic performance for discriminating dopaminergic system neurodegeneration (DSND) from non-DSND cases. On the other hand, with recent increasing availability of hybrid SPECT/computed tomography (CT) scanners, several studies have compared a conventional uniform AC method like Chang with a nonuniform AC method like CT attenuation correction (CTAC).[8–11] Although the phantom data indicated that CTAC improved recovery of the tracer accumulation in the striata, increased the SBR, and enhanced the image quality of I-123 FP-CIT SPECT,[8,9] the utility of these corrections in clinical practice is still under debate.[10,11]
The purpose of this study was to address the clinical value of CTAC, Chang AC, and scatter correction (SC) of I-123 FP-CIT SPECT for the diagnosis of DSND.
2. Materials and methods
2.1. Patients
This retrospective study was approved by the institutional review board and the requirement of written informed consent was waived.
Seventy-three patients who were clinically suspected having DSND underwent I-123 FP-CIT SPECT/CT. The patients comprised 38 females and 35 males and their ages ranged from 26 to 92 years (mean ± SD, 69.0 ± 12.2 years). They were divided into 3 groups based on their final clinical diagnoses determined by experienced neurologists after at least 6 months of follow-up: 36 patients with PD (group 1); 19 patients with other DSND including 6 corticobasal degeneration (CBD), 6 multiple system atrophy (MSA), 5 DLB, and 2 progressive supranuclear palsy (PSP) (group 2); and 18 patients without DSND including 6 essential tremor (ET), 3 vascular parkinsonism (VP), 3 drug-induced parkinsonism, 2 AD, 2 frontotemporal dementia (FTD), 1 normal pressure hydrocephalus, and 1 depression (group 3). Groups 1, 2, and 3 included 15 females and 21 males, 12 females and 7 males, and 11 females and 7 males, respectively, and the mean age ± SD of each group was 65.3 ± 9.7, 74.4 ± 10.1, and 70.4 ± 15.3, respectively.
2.2. I-123 FP-CIT SPECT
All SPECT/CT images were obtained with the Bright View X with an XCT system (Philips Medical Systems Inc, Cleveland, OH) equipped with a dual-head γ-camera and a low-dose cone-beam CT with a high-resolution flat-panel x-ray detector rotating within the same gantry. Patients were intravenously administrated 167 MBq of I-123 FP-CIT (4.51 mCi) 3 hours before data acquisition.
SPECT images were acquired in a continuous mode with 7 min/rotation × 4 rotations using a cardiac high resolution (CHR) collimator (FWHM 4.33 mm) in a 128 × 128 matrix. Images were reconstructed using 3-dimensional ordered subset expectation maximization (3D-OSEM) (iteration, 4; subset, 8) and Butterworth filter (cutoff: 0.2 cycle/s). Attenuation correction was performed by a flat-panel based cone-beam CT, and the effective source scatter estimation (ESSE) method[12] was employed for SC.
2.3. Data analysis
For visual evaluation, I-123 FP-CIT SPECT images were classified into 5 types according to the previous study with modification[10] (Fig. 1). We categorized normal and abnormal I-123 FP-CIT accumulations in the striata as follows: type 0, symmetrical and clear demarcated comma-like RI accumulation in the whole striatum on both the sides; type 1, certain reduction of RI uptake in the putamen on one side and normal accumulation in the striatum on the other side; type 2, definite reduction of RI uptake in the putamen on both the sides; type 3, almost total distinctive reduction of RI uptake in both striata; and type 4, decreased RI accumulation in both striata with normal shape. Visual evaluation of the laterality of I-123 FP-CIT accumulation in the striata was simply judged as to whether there was asymmetrical tracer uptake in the bilateral striata or not, without considering the results of the above type classification. Two nuclear medicine physicians with 26 and 21 years’ experience performed this categorization visually, and the final judgments were made by their mutual consent when their initial decisions disagreed.
Figure 1.

Reference I-123 FP-CIT SPECT images for visual evaluation. I-123 FP-CIT accumulations in the striata were categorized into 5 types (0–4). Type 0 was considered normal and types 1 to 4 were abnormal. FP-CIT = N-ω-fluoropropyl-2β-carbomethoxy-3β-(4-I-123 iodophenyl)nortropane, SPECT = single-photon emission computed tomography.
For semiquantitative evaluation, we used DaTView software (AZE Corporation, Tokyo, Japan) developed on the basis of the quantitative measurement method proposed by Tossici-Bolt et al[4] in which geometrical VOIs were drawn on the bilateral whole striata, and the ratio between each striatal count and the count of the whole brain except for the bilateral striata was calculated as SBR. We also calculated an asymmetry index (AI), which was obtained by the following formula:
 |
where SBR left and SBR right are the calculated SBR for the left and the right striatum, respectively.
The clinical impacts of CTAC + SC (CTACSC), CTAC, Chang AC, and non-ACSC on visual and semiquantitative assessment were compared among the 3 groups.
2.4. Statistics
We evaluated the differences between reconstruction factors (CTACSC, CTAC, Chang AC, and non-ACSC) using the Friedman test. Receiver operating characteristic (ROC) analysis was used for the assessment of the diagnostic ability of SBR and AI for each reconstruction factor. Differences among the diagnostic powers of the reconstruction factors were evaluated by multiple comparisons. Statistical significance was considered achieved for a value of P < .05.
3. Results
3.1. Visual evaluation
Figure 2 shows the distribution of the I-123 FP-CIT accumulation pattern in each group. The vast majority of patients in group 1, the PD group, showed a type 2 accumulation pattern (Fig. 2, left graph). Most of the patients in group 3, non-DSND, understandably showed normal I-123 FP-CIT accumulation in the striata (Fig. 2, right graph). On the other hand, the patients in group 2 showed a mixed I-123 FP-CIT accumulation pattern, reflective of this group's heterogeneous disease population. Although the dominant I-123 FP-CIT accumulation pattern was different for each group, no significant difference in the striatal I-123 FP-CIT accumulation pattern was observed among the various reconstruction factors, CTACSC, CTAC, Chang AC, and non-ACSC.
Figure 2.
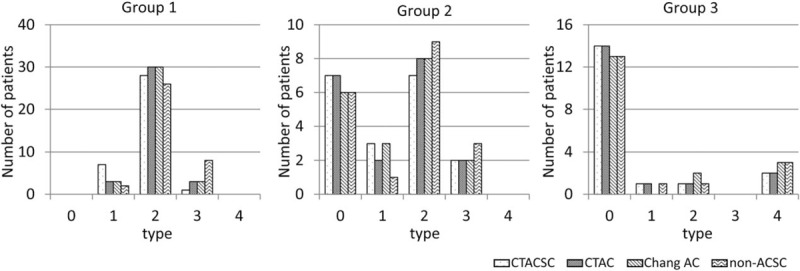
Visual categorization of I-123 FP-CIT SPECT images. The numbers of patients of various visual categories according to I-123 FP-CIT SPECT image reconstruction factor are indicated by disease group. FP-CIT = N-ω-fluoropropyl-2β-carbomethoxy-3β-(4-I-123 iodophenyl)nortropane, SPECT = single-photon emission computed tomography.
Almost half of the patients in groups 1 and 2 showed asymmetrical I-123 FP-CIT accumulation in the bilateral striata (Fig. 3, left and middle graphs). On the other hand, most of the patients in group 3 presented symmetrical I-123 FP-CIT uptake as might be expected (Fig. 3, right graph). With respect to the reconstruction factors, there was a tendency that the judgement of asymmetrical tracer accumulation was easier in the order of CTACSC > CTAC > Chang AC ≒ non-ACSC.
Figure 3.
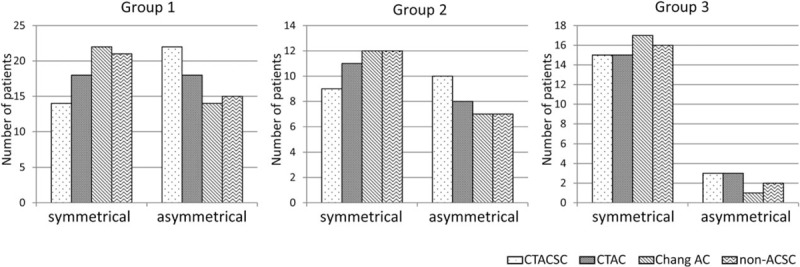
Comparison of visual evaluation of the laterality of I-123 FP-CIT accumulation in the striata. Sown are the numbers of patients in the various groups whose I-123 FP-CIT SPECT images reconstructed with each factor demonstrated laterality of I-123 FP-CIT accumulation in the striata. FP-CIT = N-ω-fluoropropyl-2β-carbomethoxy-3β-(4-I-123 iodophenyl)nortropane, SPECT = single-photon emission computed tomography.
3.2. Semiquantitative evaluation
SBR was determined for each group using SPECT images reconstructed with several reconstruction factors (Fig. 4). The Friedman test demonstrated that SBRs calculated for images reconstructed without any ACSC were significantly lower than those calculated for images reconstructed with CTACSC, CTAC, and Chang AC in groups 1 and 2, and lower than those calculated for images reconstructed with CTACSC and Chang AC in group 3. Next, we performed ROC analysis to compare the various methods’ abilities to discriminate between groups 1 + 2 and group 3. As shown in Fig. 5A, there was no significant difference of the area under the curve (AUC) among SBRs calculated for images reconstructed with CTACSC, CTAC, Chang AC, and non-ACSC.
Figure 4.
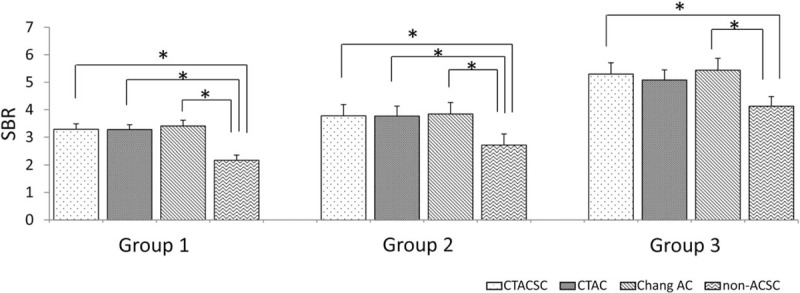
Comparison of SBRs. SBRs given were calculated by I-123 FP-CIT SPECT images reconstructed with different factors for each group. ∗P < .01 by Freedman test. FP-CIT = N-ω-fluoropropyl-2β-carbomethoxy-3β-(4-I-123 iodophenyl)nortropane, SBR = specific binding ratio, SPECT = single-photon emission computed tomography.
Figure 5.
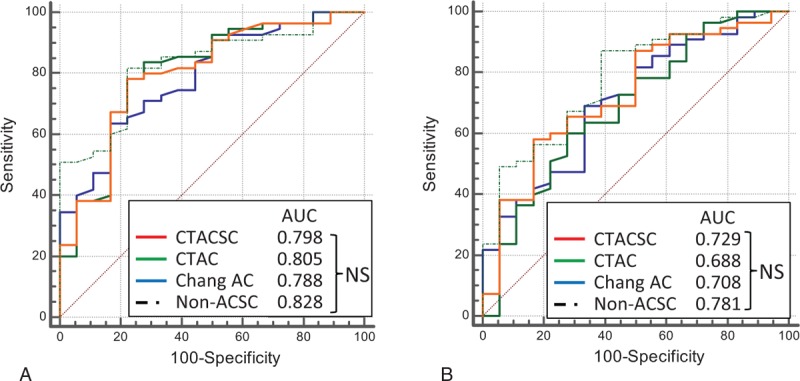
ROC analysis for the differentiation between group 1+2 and 3. ROC curves for the differentiation between groups 1+2 and 3 were drawn and the AUC were calculated for each reconstruction factor in terms of (A) SBR and (B) AI. AI = asymmetry index, AUC = area under the curve, NS = not significant by multiple comparison, ROC = receiver operating characteristic, SBR = specific binding ratio.
We further evaluated the influence of these reconstruction factors on AI values and the ability to distinguish groups 1 + 2 from group 3. Figure 6 shows that AI determined by the SPECT images reconstructed without any ACSC were significantly higher than those with CTAC and Chang AC in group1, and those with CTAC in group 2. In group 3, there was no significant difference of AI calculated by the images reconstructed with CTACSC, CTAC, Chang AC, and non-ACSC. The diagnostic ability of AI (group 1 +2 vs 3) was also determined by ROC analysis and again there was no significant difference among these 4 reconstruction factors (Fig. 5B).
Figure 6.
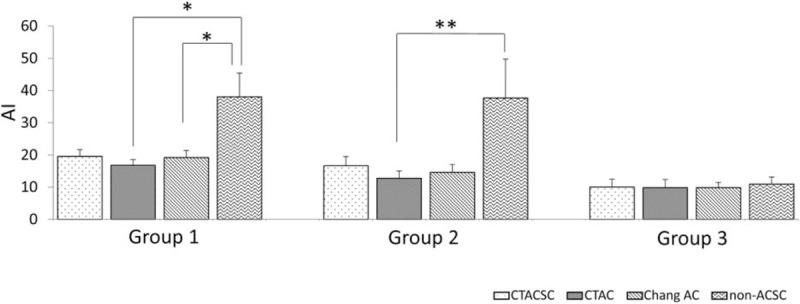
Comparison of AI. AIs were calculated for different I-123 FP-CIT SPECT images reconstructed methods, are shown by disease group. ∗P < .01; ∗∗P < .05 by Freedman test. AI = asymmetry index, FP-CIT = N-ω-fluoropropyl-2β-carbomethoxy-3β-(4-I-123 iodophenyl)nortropane, SPECT = single-photon emission computed tomography.
Representative cases are shown in Figs. 7 and 8. In Fig. 7, a group 1 patient with PD shows a definite reduction of I-123 FP-CIT accumulation in the putamen on both sides, or a type 2 visual classification (Fig. 7). Although the intensities of I-123 FP-CIT accumulation in the bilateral striata differ in some degree according to the reconstruction factors, the diagnostic ability for PD was not greatly affected according to these SPECT images. Figure 8 demonstrates I-123 FP-CIT SPECT images of a patient who was initially suspected as PD, but ultimately diagnosed as ET. He belongs to group 3, and the I-123 FP-CIT uptake patterns of SPECT images were visually evaluated as type 0. Again, the quality of SPECT images differed somewhat depending on the reconstruction factor. However, it seemed easy to identify that all of group 3 SPECT images had normal accumulation in the striata.
Figure 7.
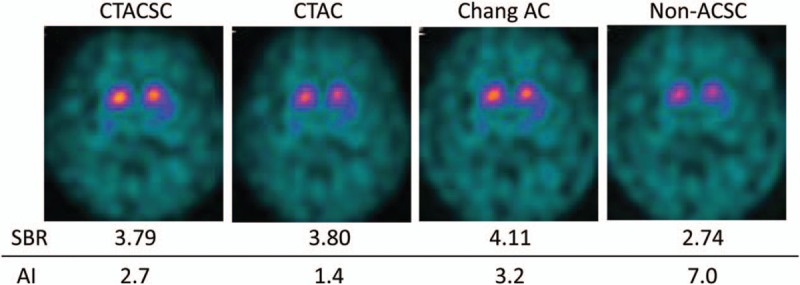
I-123 FP-CIT SPECT images of a 73-year-old female with PD. FP-CIT = N-ω-fluoropropyl-2β-carbomethoxy-3β-(4-I-123 iodophenyl)nortropane, PD = Parkinsonian disease, SPECT = single-photon emission computed tomography.
Figure 8.
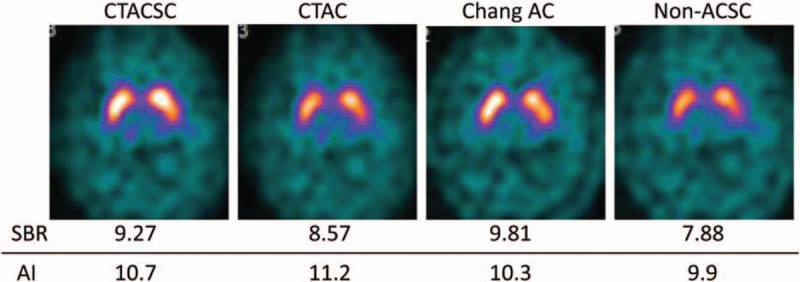
I-123 FP-CIT SPECT images of a 26-year-old male with ET. ET = essential tremor, FP-CIT = N-ω-fluoropropyl-2β-carbomethoxy-3β-(4-I-123 iodophenyl)nortropane, SPECT = single-photon emission computed tomography.
4. Discussion
Image quality and quantitative capacity of the tracer accumulation on SPECT images depend on many factors including AC and SC. Pareto et al[13] found that the striatal/background uptake ratio in the putamen and the caudate increased 34% and 45%, respectively when AC, SC, and correction of the spatially variant collimator response were included in the reconstruction algorithm. For dopamine transporter SPECT imaging with I-123 FP-CIT, improvement of the image quality and accuracy of quantification might result in a more accurate diagnosis of DSND. We studied the impact of the reconstruction factors on the accuracy of DSND diagnosis by I-123 FP-CIT SPECT.
The present study showed that the SBRs calculated by images without ACSC reconstruction were lower than those calculated by images reconstructed with CTACSC, CTAC, or Chang AC, which is in accordance with the results of the previous studies.[8–11] Matsutomo et al[8] reported that the quality of the SPECT images reconstructed by OSEM with CTACSC was superior to that reconstructed by filtered back projection (FBP) with Chang AC, and the diagnostic ability of DSND by the former appeared to be superior to the latter even though the difference was not statistically significant. Lange et al[10] compared the effect of OSEM with CTAC, Chang AC, and no AC on the SBRs. They found that the SBRs with Chang AC or CTAC were larger than those without AC. They also found that SBRs with Chang AC were larger than those with CTAC and speculated that Chang AC would overestimate the attenuation of photons from the striata compared with that from the surrounding reference regions.[10] With respect to the effect of SC, another previous study demonstrated that it increased the uptake of a dopamine D2 receptor ligand, I-123 epidepride, in the striata as compared with no SC, and that SC was essential for accurate quantification of the tracer uptake in the striata.[14] It would be reasonable that AC accurately increased SBRs because photons from the deep brain parenchyma like the striata should have been attenuated. SC could also increase SBRs because it might enhance the contrast between the striata and the surrounding reference brain parenchyma.
As well as SBR, AI is a useful semiquantitative index to differentiate VP[15] or other non-PD[16] from PD, and is a predictive indicator for the responsiveness to l-dopa treatment in patients with PD.[17] In the present study, AIs calculated from the images reconstructed with non-ACSC were significantly higher than those with CTAC and Chang AC in group1, and those with CTAC in group 2, though no significant difference was observed among AIs for CTACSC, CTAC, and Chang AC reconstructions in groups 1 and 2, or among those for CTACSC, CTAC, Chang AC, and non-ACSC in group 3. Attenuated photons from striata in non-ACSC SPECT images are assumed to increase the background noise content, causing increased variability of photon count, resulting in high AIs in groups 1 and 2.
Although each group showed a propensity for a distinct I-123 FP-CIT accumulation pattern visually and semiquantitatively, there was no statistical significant difference in the DSND diagnostic ability among ATACSC, CTAC, Chang AC, and non-ACSC. Indeed, the intensities of I-123 FP-CIT accumulation in striata and background brain parenchyma, and the contrasts between both accumulations seemed to vary in only subtle ways, and SBRs and AIs were changed when the different sets of the reconstruction factors were applied to SPECT images (Figs. 7 and 8). However, the diagnosis of PD versus ET seemed to be easily made. It is not clear why this study found no significant difference of DSND diagnostic ability for images reconstructed with several reconstruction factors, CTACSC, CTAC, Chang AC, and non-ACSC. Lange et al[10] conducted a phantom study and demonstrated that the SBR calculated by the SPECT images reconstructed with CTAC, Chang AC and without AC strongly underestimated by 47.6 ± 2.8%, 52.3 ± 2.4%, 43.0 ± 2.9%, respectively, compared with the actual SBR; this underestimation could be explained by partial volume effects. It is plausible that the effect of photon attenuation and scattering on the visual evaluation and on the measurement of SBR is much less than that of the partial volume effect, especially for such a small structure of striata, though AC or ACSC could certainly increase SBR and improve image quality. That could be why we did not observe any significant difference of diagnostic ability for DSND among several reconstruction factors.
There are several limitations in the present study. First, the number of patients was relatively small and the retrospective nature of this study could lead to a certain selection bias. Second, although the final diagnoses were clinically made by experienced neurologists based on the established consensus diagnostic criteria of each disease, pathologically accurate diagnoses were unavailable unless brain autopsies were conducted. Prospective and larger studies are needed for the validation of the present results. Third, the reconstruction methods compared in this study utilized the only commercially available technique, Astonish (Philips Medical Systems Inc, Cleveland, OH). SC is performed with the ESSE method, in which the scatter data obtained by CT images are used in an iterative reconstruction loop. Because this technique was developed based on a totally different concept from conventional SC methods like the triple energy window (TEW) method,[18] our results might not be generalizable for other reconstruction techniques. However, Seret et al[19] compared different SC techniques and obtained approximately identical results in their phantom experiments.
5. Conclusion
Although the values of SBR and AI were changed and image quality could be improved when AC and/or SC were applied, the impact of these reconstruction factors in I-123 FP-CIT SPECT for the clinical diagnosis of DSND was found to be negligible.
Footnotes
Abbreviations: AC = attenuation correction, AD = Alzheimer disease, AI = asymmetry index, AUC = area under the curve, CBD = corticobasal degeneration, CHR = cardiac high resolution, CT = computed tomography, DAT = dopamine transporter, DLB = diffuse Lewy body dementia, DSND = dopaminergic system neurodegeneration, ESSE = effective source scatter estimation, ET = essential tremor, FBP = filtered back projection, FP-CIT = N-ω-fluoropropyl-2β-carbomethoxy-3β-(4-I-123 iodophenyl)nortropane, FTD = frontotemporal dementia, MSA = multiple system atrophy, PD = Parkinsonian disease, PS = Parkinsonian syndrome, PSP = progressive supranuclear palsy, RI = radioisotope, ROC = receiver operating characteristic, SBR = specific binding ratio, SC = scatter correction, SPECT = single-photon emission computed tomography, TEW = triple energy window, 3D-OSEM = 3-dimensional ordered subset expectation maximization, VOI = volume of interest, VP = vascular parkinsonism.
The authors have no conflicts of interest to disclose.
References
- [1].Tatsch K, Poepperl G. Nigrostriatal dopamine terminal imaging with dopamine transporter SPECT: an update. J Nucl Med 2013;54:1331–8. [DOI] [PubMed] [Google Scholar]
- [2].Garibotto V, Montandon ML, Viaud CT, et al. Regions of interest-based discriminant analysis of DaTSCAN SPECT and FDGPET for the classification of dementia. Clin Nucl Med 2013;38:e112–7. [DOI] [PubMed] [Google Scholar]
- [3].Booij J, Hemelaar TG, Speelman JD, et al. One-day protocol for imaging of the nigrostriatal dopaminergic pathway in Parkinson's disease by [123I]FPCIT SPECT. J Nucl Med 1999;40:753–61. [PubMed] [Google Scholar]
- [4].Tossici-Bolt L, Hoffmann SM, Kemp PM, et al. Quantification of [123I]FP-CIT SPECT brain images: an accurate technique for measurement of the specific binding ratio. Eur J Nucl Med Mol Imaging 2006;33:1491–9. [DOI] [PubMed] [Google Scholar]
- [5].Djang DS, Janssen MJ, Bohnen N, et al. SNM practice guideline for dopamine transporter imaging with 123I-ioflupane SPECT 1.0. J Nucl Med 2012;53:154–63. [DOI] [PubMed] [Google Scholar]
- [6].Darcourt J, Booij J, Tatsch K, et al. EANM procedure guidelines for brain neurotransmission SPECT using (123)I-labelled dopamine transporter ligands, version 2. Eur J Nucl Med Mol Imaging 2010;37:443–50. [DOI] [PubMed] [Google Scholar]
- [7].Zaidi H, El Fakhri G. Is absolute quantification of dopaminergic neurotransmission studies with 123I SPECT ready for clinical use? Eur J Nucl Med Mol Imaging 2008;35:1330–3. [DOI] [PMC free article] [PubMed] [Google Scholar]
- [8].Matsutomo N, Nagaki A, Yamao F, et al. Optimization of iterative reconstruction parameters with 3-dimensional resolution recovery, scatter and attenuation correction in 123I-FP-CIT SPECT. Ann Nucl Med 2015;29:636–42. [DOI] [PubMed] [Google Scholar]
- [9].Warwick JM, Rubow S, du Toit M, et al. The role of CT-based attenuation correction and collimator blurring correction in striatal SPECT quantification. Int J Mol Imaging 2011;2011:195037. [DOI] [PMC free article] [PubMed] [Google Scholar]
- [10].Lange C, Seese A, Schwarzenböck S, et al. CT-based attenuation correction in I-123-ioflupane SPECT. PLoS One 2014;30:e108328. [DOI] [PMC free article] [PubMed] [Google Scholar]
- [11].Bieńkiewicz M, Górska-Chrzastek M, Siennicki J, et al. Impact of CT based attenuation correction on quantitative assessment of DaTSCAN ((123)I-Ioflupane) imaging in diagnosis of extrapyramidal diseases. Nucl Med Rev Cent East Eur 2008;11:53–8. [PubMed] [Google Scholar]
- [12].Frey E, Tsui C, BM W. A new method for modeling the spatially-variant, object-dependent scatter response function in SPECT. IEEE 1996;2:1082–6. [Google Scholar]
- [13].Pareto D, Cot A, Pavía J, et al. Iterative reconstruction with correction of the spatially variant fan-beam collimator response in neurotransmission SPET imaging. Eur J Nucl Med Mol Imaging 2003;30:1322–9. [DOI] [PubMed] [Google Scholar]
- [14].Fujita M, Varrone A, Kim KM, et al. Effect of scatter correction on the compartmental measurement of striatal and extrastriatal dopamine D2 receptors using [123I]epidepride SPET. Eur J Nucl Med Mol Imaging 2004;31:644–54. [DOI] [PubMed] [Google Scholar]
- [15].Benítez-Rivero S, Marín-Oyaga VA, García-Solís D, et al. Clinical features and 123I-FP-CIT SPECT imaging in vascular parkinsonism and Parkinson's disease. J Neurol Neurosurg Psychiatry 2013;84:122–9. [DOI] [PubMed] [Google Scholar]
- [16].Sixel-Döring F, Liepe K, Mollenhauer B. et al The role of 123I-FP-CIT-SPECT in the differential diagnosis of Parkinson and tremor syndromes: a critical assessment of 125 cases. J Neurol 2011;258:2147–54. [DOI] [PubMed] [Google Scholar]
- [17].Contrafatto D, Mostile G, Nicoletti A, et al. Single photon emission computed tomography striatal asymmetry index may predict dopaminergic responsiveness in Parkinson disease. Clin Neuropharmacol 2011;34:71–3. [DOI] [PubMed] [Google Scholar]
- [18].Ichihara T, Ogawa K, Motomura N, et al. Compton scatter compensation using the triple-energy window method for single- and dual isotope SPECT. J Nucl Med 1993;34:2216–21. [PubMed] [Google Scholar]
- [19].Seret A, Nguyen D, Bernard C. Quantitative capabilities of four state-of-the-art SPECT-CT cameras. EJNMMI Res 2012;2:45. [DOI] [PMC free article] [PubMed] [Google Scholar]


