

Abstract
Obesity is associated with an increase in cancer-specific mortality in women with breast cancer. Elevated cholesterol, particularly low-density lipoprotein cholesterol (LDL-C) is frequently seen in obese women. Here, we aimed to determine the importance of elevated circulating LDL, and LDL receptor (LDLR) expression in tumor cells, on the growth of breast cancer using mouse models of hyperlipidemia. We describe two novel immunodeficient mouse models of hyperlipidemia (Rag1−/−/LDLR−/− and Rag1−/−/ApoE (apolipoprotein E)−/− mice), in addition to established immunocompetent LDLR−/− and ApoE−/− mice. The mice were used to study the effects of elevated LDL-C in human triple negative (MDA-MB-231) and mouse Her2/Neu overexpressing (MCNeuA) breast cancers. Tumors derived from MCNeuA and MDA-MB-231 cells had high LDLR expression and formed larger tumors in mice with high circulating LDL-C concentrations than in mice with lower LDL-C. Silencing the LDLR in the tumor cells led to decreased growth of Her2Neu overexpressing tumors in LDLR−/− and ApoE−/− mice, with increased Caspase 3 cleavage. Additionally, in vitro, silencing the LDLR led to decreased cell survival in serum-starved conditions, associated with Caspase 3 cleavage. Examining publically available human datasets, we found that high LDLR expression in human breast cancers was associated with decreased recurrence-free survival, particularly in patients treated with systemic therapies. Overall, our results highlight the importance of the LDLR in the growth of triple negative and HER2 overexpressing breast cancers in the setting of elevated circulating LDL-C, which may be important contributing factors to the increased recurrence and mortality in obese women with breast cancer.
Introduction
Obesity is associated with an increase in all-cause and cancer-specific mortality in women with breast cancer [1]. Many systemic metabolic abnormalities are associated with obesity, including hyperlipidemia. Increasing obesity is associated with increased total cholesterol, increased circulating low-density lipoprotein (LDL) cholesterol, increased triglycerides (TG) and decreased high-density lipoprotein (HDL) cholesterol [2, 3]. Although the risk of developing breast cancer has, in general, not been associated with high cholesterol levels, prospective studies have reported an increase in breast cancer recurrence in women with elevated total cholesterol levels [4], and higher serum concentrations of low-density lipoprotein (LDL) cholesterol are associated with reduced disease-free survival [5]. Conversely cholesterol-lowering statins have been reported to decrease breast cancer recurrence and mortality [6]. Therefore, elevated cholesterol may be an important contributing factor to breast cancer recurrence, and decreased survival.
The mechanisms through which cholesterol contributes to breast cancer progression are incompletely understood [7]. Previous mouse models examining the role of cholesterol in breast cancer progression have largely used immunocompetent or immunodeficient mice on high cholesterol diets [8, 9]. High cholesterol diets increase total serum cholesterol levels in mice; however, due to a deficiency of cholesteryl ester transfer protein (CETP), their circulating cholesterol is composed mostly of high-density lipoprotein (HDL) cholesterol [10, 11]. In contrast, in humans with elevated cholesterol, the main components are LDL and VLDL cholesterol [11]. Specific mouse models that have been used to examine the effects of hyperlipidemia that more closely resembles human hyperlipidemia on breast cancer progression include the apolipoprotein E (ApoE) knockout mice, the human ApoE3 expressing mice, and the adiponectin knockout mice [12–14]. In these studies, tumors were derived from murine breast cancer cell lines (ApoE knockout and ApoE3 expressing mice), or a murine transgene (adiponectin knockout mice). To date, to our knowledge, there are no published studies using immunodeficient mice modeling human hyperlipidemia to study the effect of LDL cholesterol on human breast cancer xenografts.
Cells internalize cholesterol from circulating LDL through the LDLR on the cell surface [15]. Previous in vitro studies have found that the LDLR is expressed in human breast cancer cell lines. These studies reported that expression of the LDLR in the human triple negative (estrogen receptor, progesterone receptor and HER2 negative) cell line MDA-MB-231 cells was higher than in the estrogen receptor positive MCF7, or the non-tumorigenic MCF-10A cell lines [16, 17]. One clinical study, from before cholesterol-lowering statins were in clinical use, reported that the LDLR content of human breast cancers was inversely correlated with survival [18]. Therefore, we hypothesized that increased circulating LDL cholesterol in hyperlipidemia promotes breast cancer growth through the LDLR expressed on cancer cells.
We aimed to determine whether tumors from aggressive mouse and human (HER2 overexpressing and triple negative) breast cancer cells with high LDLR expression grow larger in mice with high serum LDL concentrations. Additionally, we sought to ascertain whether the LDLR on the triple negative and HER2 expressing breast cancer cells plays a significant role in the growth of tumors in the hyperlipidemic mice. In order to perform these studies, we generated two novel immunodeficient mouse models of hyperlipidemia by crossing the recombination-activating gene 1 (Rag1) knockout mice [19] with the ApoE knockout mice [20], and the LDLR knockout mice [21]. We found that tumors with high LDLR expression grew larger in mice with high serum LDL cholesterol levels. Additionally, silencing the LDLR on tumor cells led to decreased tumor growth in vivo and decreased survival in vitro.
Results
Immunodeficient ApoE and LDLR knockout mice maintain the hyperlipidemic profile of immunocompetent mice
Immunodeficient mouse lines may have different metabolic characteristics then their immunocompetent counterparts [22–24]. Generation and breeding of the immunodeficient Rag1−/−, Rag1−/−/LDLR−/− and Rag1−/−/ApoE−/− mice is described in the Materials and Methods section. We examined the lipid profiles of the immunocompetent wild type (WT), LDLR−/− and ApoE−/− mice, and the immunodeficient Rag1−/−, Rag1−/−/LDLR−/− and Rag1−/−/ApoE−/− mice. In the immunocompetent model, LDLR−/− and ApoE−/− mice were found to have significantly higher total cholesterol levels (783±32.6 mg/dL, 1642±73.0 mg/dL, respectively) than the WT mice (149.5±8.7 mg/dL, p<0.01) fed a Western diet for 8 weeks (Figure 1A). ApoE−/− mice had significantly higher total cholesterol levels than the LDLR−/− mice (p<0.01). Examining the lipoprotein composition revealed that the low-density lipoprotein (LDL) and very low-density lipoprotein (VLDL) cholesterol levels were also significantly higher in the LDLR−/− (463.1±69.8.0 mg/dL) and ApoE−/− (626.2±114.2 mg/dL) mice compared with the WT mice (28.8±1.0 mg/dL, p<0.01, Figure 1B). After generating the homozygous Rag1−/−/LDLR−/− and Rag1−/−/ApoE−/− we first examined their lipid profiles. Total serum cholesterol concentrations of the Rag1−/−/LDLR−/− (657.8±49.7 mg/dL) and Rag1−/−/ApoE−/− (1323.3±258.1 mg/dL) mice were significantly higher than the Rag1−/− control mice (161.1±13.8 mg/dL, p<0.01 vs Rag1−/−/ApoE−/−, p<0.05 vs Rag1−/−/LDLR−/−, Figure 1C). Similar to the immunocompetent mice, the total cholesterol levels were significantly higher in the Rag1−/−/ApoE−/− compared with the Rag1−/−/LDLR−/− mice (p<0.05). Rag1−/− control mice had significantly lower concentrations (25.3±2.9 mg/dL), than the Rag1−/−/LDLR−/− (354.7±137.6 mg/dL), and Rag1−/−/ApoE−/− (731.7±47.2 mg/dL) mice (p<0.05, Figure 1D).
Figure 1.
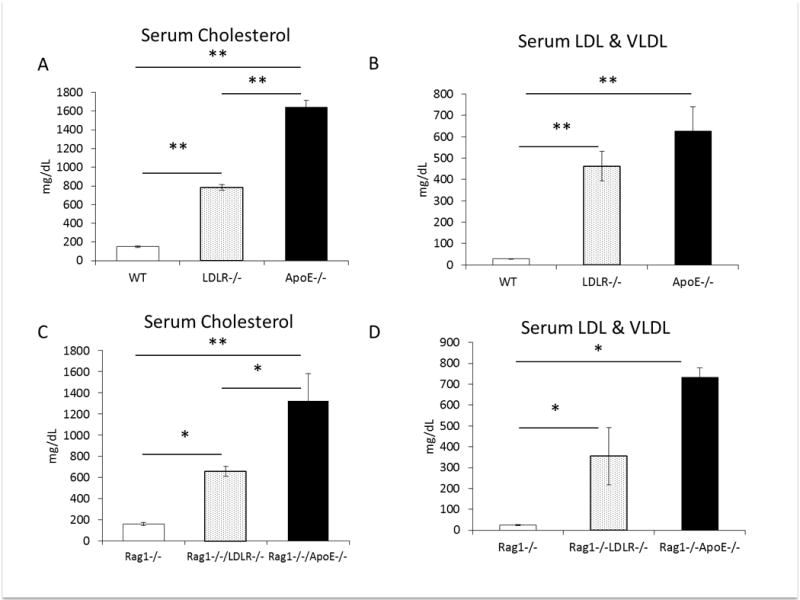
(A) Non-fasting serum total cholesterol and (B) serum low density and very low-density lipoprotein levels from wild type (WT) control, LDLR knockout (LDLR−/−) and ApoE knockout (ApoE−/−) mice on western diet. (C) Non-fasting serum total cholesterol and (D) low density and very low-density lipoprotein) levels from Rag1−/− control, Rag1−/−/LDLR−/− and Rag1−/−/ApoE−/− mice on western diet (n=4 (Rag1−/−/ApoE−/−), n=10 Rag1−/− and Rag1−/−/LDLR−/− per group). Graphs represent the mean of each group, error bars are SEM, *p value <0.05, ** p value <0.01 between groups as indicated.
Body weights of the immunocompetent ApoE−/− mice on high fat diet were greater than WT and LDLR−/− mice, consistent with previous studies (p<0.01, [20]). The body weights of the LDLR−/−, mice fed a western diet were consistently lower than the other mice (p<0.01, Figure 2A). In contrast, there were no statistically significant differences in the body weights of the Rag1−/−, Rag1−/−/LDLR−/− and Rag1−/−/ApoE−/− mice (Figure 2C). Rag1−/− and Rag1−/−/LDLR−/− mice were heavier than the immunocompetent WT and LDLR−/− mice, consistent with previous observations [25]. Insulin tolerance tests were performed in immunocompetent and immunodeficient animals and all mice were found to be insulin sensitive (Figure 2B, 2D). Therefore, the immunodeficient Rag1−/−/LDLR−/− and Rag1−/−/ApoE−/− mice maintained the dyslipidemic profile of the immunocompetent mice, with no difference in insulin sensitivity or body weights.
Figure 2.
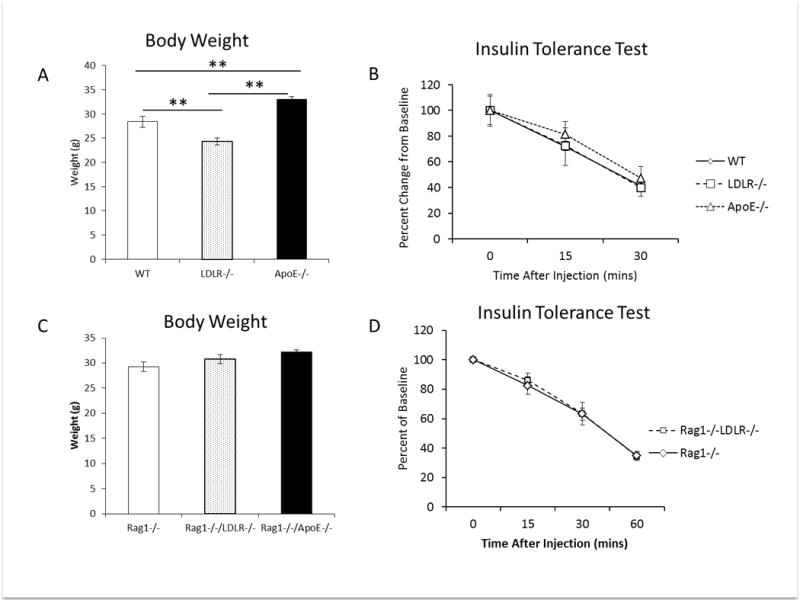
(A) Body weights of WT, LDLR−/− and ApoE−/− mice after 4 weeks of western diet feeding at start of tumor study (n=15 per group). (B, D) Insulin tolerance test performed on mice that were fasted for 2 hours prior to the injection of 0.75units/kg of regular human insulin (n=4 WT, LDLR−/−, ApoE−/− per group, n=5 Rag1−/−, Rag1−/−/LDLR−/− per group). (D) Body weights of Rag1−/−, Rag1−/−/LDLR−/− and Rag1−/−/ApoE−/− mice after 4 weeks of postpubertal western diet feeding, prior to tumor cell injection (n=Rag1−/−/ApoE−/−:4, Rag1−/− and Rag1−/−/LDLR−/−:10 per group). * p value <0.05, **p value <0.01 between groups as indicated. Graphs represent the mean of each group, error bars are SEM.
MDA-MB-231 cells and MCNeuA cells expressed high levels of the LDLR, compared with other cell lines and grew larger in hyperlipidemic mice
We hypothesized that circulating LDL would promote the growth of tumors with high LDLR expression. Therefore, we aimed to identify cell lines with high LDLR protein expression. Comparing human breast cancer cell lines, we found that MDA-MB-231 cells expressed high levels of the LDLR, compared with MCF7 and MDA-MB-468 cells (Figure 3A). Furthermore, we found that the murine MCNeuA cells express higher levels of the LDLR than the murine MVT1 breast cancer cell line (Figure 3B). We selected the MDA-MB-231 and MCNeuA tumor cell lines for in vivo studies.
Figure 3.
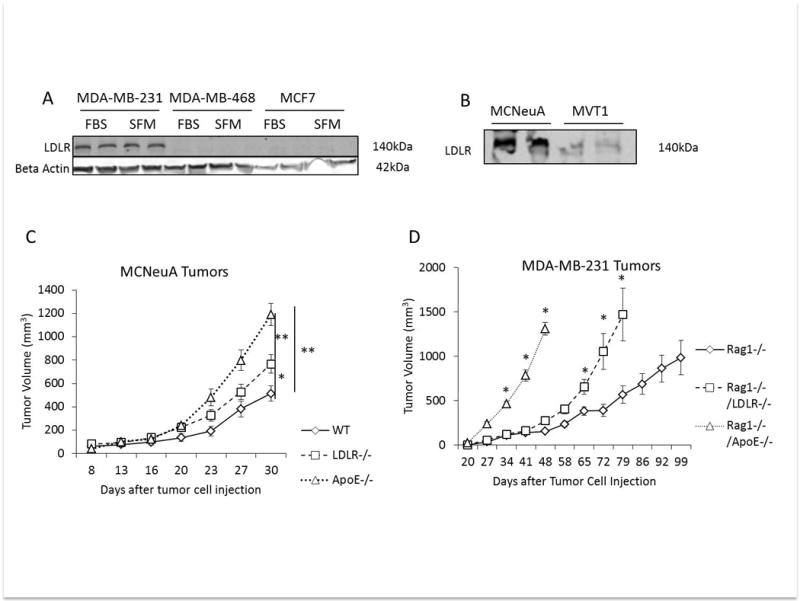
(A) Western blot of LDLR expression in protein lysates from human MDA-MB-231, MDA-MB-468 and MCF7 cells after growth in DMEM with 10% FBS and 1% penicillin streptomycin (FBS) or cells serum starved in DMEM with 0.1% BSA and 1% penicillin/streptomycin overnight (SFM). Beta actin was used as loading control (B) Western blot of LDLR expression in protein lysates from murine MCNeuA and MVT1 cell lines. (C) MCNeuA tumor volume in WT, LDLR−/− and ApoE−/− mice after orthotopic injection of 2 × 10⁶ cells on day 0 (n=7 (WT), n=10 per group (LDLR−/−, ApoE−/−)). (D) MDA-MB-231 tumor volume in Rag1−/−, Rag1−/−/LDLR−/− and Rag1−/−/ApoE−/− mice after tumor cell injection into the 4th mammary fat pad on day 0 (n=4 Rag1−/−/ApoE−/−, n=9 Rag1−/− and Rag1−/−/LDLR−/− per group). Graphs are the mean of each group, error bars represent SEM. * p value <0.05, ** p value <0.01 between groups as indicated.
2 × 10⁶ MCNeuA tumor cells were injected into the 4th mammary fat pad of WT, LDLR−/− and ApoE−/− mice fed a Western diet. Tumors were measured twice weekly. Both LDLR−/− and ApoE−/− mouse models of hypercholesterolemia developed larger tumors than the WT control mice (LDLR−/− 766.9±78.3 mm3; ApoE−/− 1189±94.5; WT: 513± 71.2 mm3) with the greatest increase in tumor growth being observed in the ApoE−/− mice with the highest serum LDL concentrations (p<0.01) (Figure 3C). Using our novel immunodeficient models of hypercholesterolemia, we next examined the effect of elevated circulating LDL on the MDA-MB-231 tumor xenografts. 5 × 10⁶ cells were injected into the 4th mammary fat pad of Rag1−/−, Rag1−/−/LDLR−/− and Rag1−/−/ApoE−/− mice and tumor volume was measured weekly. Both Rag1−/−/LDLR−/− and Rag1−/−/ApoE−/− developed more rapid tumor growth than Rag1−/− mice. Tumor volumes reached ≥ 1000mm3 48 days after cell injection in the Rag1−/−/ApoE−/− mice, 72 days after injection in the Rag1−/−/LDLR−/− and 99 days after injection in the Rag1−/− mice (Figure 3D).
MDA-MB-468 cells with low LDLR protein expression in vitro have high LDLR expression in xenografts
We hypothesized that MDA-MB-468 cells with low LDLR expression (Figure 3A) would not grow larger in the hyperlipidemic mice. We injected 5 × 10⁶ cells MDA-MB-468 cells into the 4th mammary fat pad of Rag1−/−/ApoE−/− and Rag1−/− mice on a Western diet. Surprisingly, we found that MDA-MB-468 tumors also grew more rapidly in the Rag1−/−/ApoE−/− mice than control mice, p<0.01 (Figure 4A). Tumors volumes were also measured by micro-ultrasound with 3D reconstruction (Figure 4B). Tumor volumes by 3D micro-ultrasound correlated with volume calculated by caliper measurements. We repeated the study in the Rag1−/−/LDLR−/− and Rag1−/− mice on regular chow (Supplementary Figure 2), and also found a significant increase in tumor volume in the Rag1−/−/LDLR−/− compared with control mice (p<0.05). We then examined the tumors for LDLR protein expression by western blot (Figure 4C) and immunohistochemistry (Figure 4D), and found that the tumor cells in xenografts had higher expression of the LDLR than tumor cells in vitro (Figure 4C, Figure 4D). Therefore, cells with low LDLR expression in vitro are capable of increasing LDLR expression in vivo.
Figure 4.
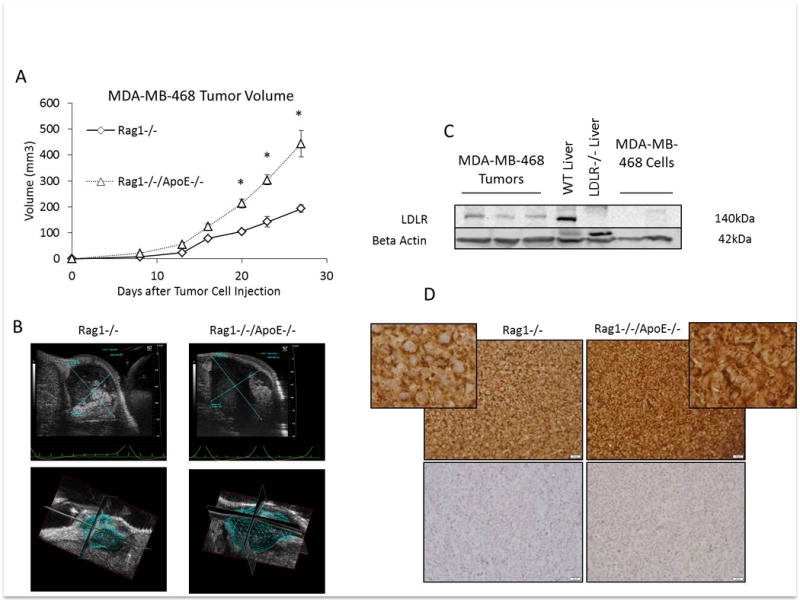
(A) MDA-MB-468 tumor volume in Rag1−/− and Rag1−/−/ApoE−/− mice after tumor cell injection into the 4th mammary fat pad on day 0 (n=5 per group). Graphs are the mean of each group, error bars represent SEM. * p value <0.05 between groups. (B) Representative micro ultrasound images of tumors from Rag1−/− and Rag1−/−/ApoE−/− with 3D reconstruction of tumors for volume measurement. (C) Western blot analysis of LDLR expression in protein lysates from MDA-MB-468 tumors from Rag1−/−/ApoE−/− mice, and MDA-MB-468 cells grown in complete growth media. Protein lysates from WT and LDLR knockout (LDLR−/−) liver were used as positive and negative controls for the LDLR, respectively. (D) Representative immunohistochemistry staining of MDA-MB-468 tumor xenografts from Rag1−/− and Rag1−/−/ApoE−/− mice. Positive staining is in the upper panels, negative controls (without primary antibody) are in the lower panels. Positive and negative images were taken at 40× objective. Inserts are cropped magnified images from upper panels.
Silencing the LDLR in cells with high LDLR expression led to decreased tumor growth in mouse models of hyperlipidemia
We next silenced the LDLR in MCNeuA cells using two different shRNA sequences (M1 and M2). After puromycin selection, LDLR knockdown was confirmed by western blot, showing an 80% (M1) and 75% (M2) reduction in LDLR expression (Figure 5A, Figure 5B). We injected MCNeuA cells transduced with control shRNA, and the two LDLR targeting shRNA (M1 and M2) into the hypercholesterolemic LDLR−/− mice and ApoE−/− mice. Silencing the LDLR led to significantly smaller tumors in both mouse models of hypercholesterolemia (Figure 5C, Figure 5D). Immunohistochemistry staining of the tumors revealed heterogenous LDLR staining in the M1 and M2 knockdown tumors, compared with more homogenous LDLR staining in the control shRNA tumors (Supplementary 3). This may explain the reduction but not complete abrogation of tumor growth in the LDLR silenced tumors. An increase in Caspase 3 cleavage was observed in the tumors with reduced LDLR expression in both mouse models (Figure 5E, Figure 5F). These data support that the LDLR on tumor cells is an important mediator of increased tumor growth in the setting of hypercholesterolemia.
Figure 5.
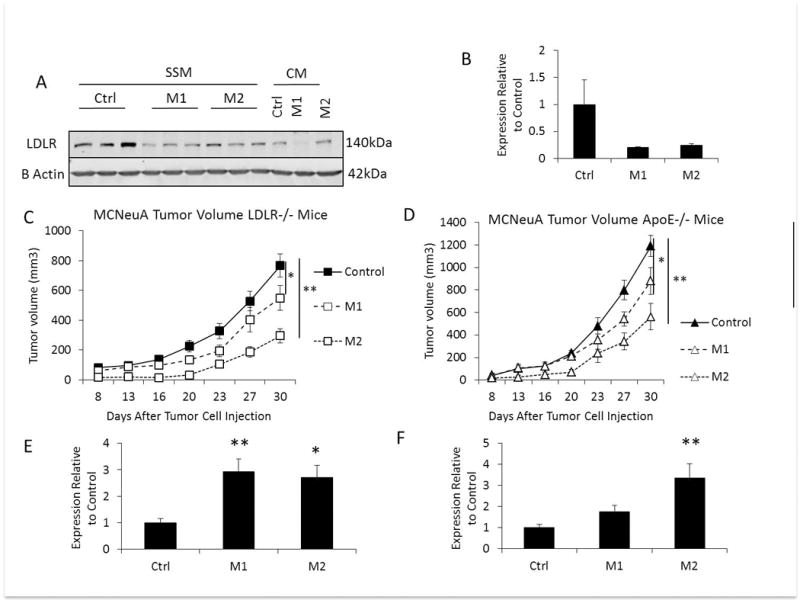
(A) Representative western blot comparing LDLR protein expression in MCNeuA control (Ctrl) cells, and cells transduced LDLR shRNA M1 and M2 sequences in serum starved medium (SSM) for 48 hours compared with cells grown in complete medium (CM). (B) Quantification of western blot of control, and M1, and M2 LDLR expression/beta actin by densitometry (n=3 per group). Expression is quantified relative to the LDLR/beta actin expression in the control cells. (C) The volume of MCNeuA tumors with control shRNA, or LDLR targeting shRNA (M1, M2) grown in hyperlipidemic LDLR−/− mice (n=10 control shRNA and M1, n=8 M2 shRNA per group). (D) The volume of MCNeuA tumors with control shRNA, or LDLR targeting shRNA (M1, M2) grown in hyperlipidemic ApoE−/− mice (n=10 per group). (E) Densitmetry quantification of cleaved Caspase 3/beta actin expression in control shRNA, M1, and M2 LDLR shRNA from tumor protein lysates from LDLR−/− mice. (F) Densitometry quantification of cleaved Caspase 3/beta actin expression in control shRNA, M1, and M2 LDLR shRNA in tumor protein lysates from LDLR−/− mice. All graphs are the mean of each group, error bars represent SEM. * p<0.05, ** p<0.01 between groups as indicated.
Failure of cells to increase LDLR expression in serum starved conditions led to increased cell death
To determine if upregulation of the LDLR was an important survival factor in human breast cancer cells, we also silenced the LDLR in MDA-MB-231 cells using two different shRNA sequences (H1 and H2) and achieved a 95% and 78% reduction in LDLR protein expression, respectively (Figure 6A, Figure 6B). We found that after 48 hours of low serum medium (0.3% charcoal stripped FBS) both MCNeuA and MDA-MB-231 control cells demonstrated increased LDLR protein expression, but cells transduced with LDLR shRNA were unable to upregulate the LDLR (Figure 5A, Figure 6A). No difference in cell proliferation was observed between control cells, and cells with LDLR knockdown when MCNeuA and MDA-MB-231 cells were cultured in complete medium (Figure 6C, Figure 6D). No differences were seen in 3D cell growth between control cells and cells with LDLR knockdown in either MCNeuA or MDA-MB-231 cell lines (Figure 6E, Figure 6F). However, prolonged serum starvation led to a significant increase in cell death (Figure 6G), and an increase in Caspase 3 cleavage (Figure 6H, 6I, 6J), consistent with the in vivo tumor data.
Figure 6.

(A) Western blot comparing LDLR protein expression in MDA-MB-231 control (Ctrl) cells, and cells transduced LDLR shRNA H1 and H2 sequences in serum starved medium (SSM) for 48 hours compared with cells grown in complete medium (CM). (B) Quantification of western blot of control, and M1, and M2 LDLR expression/beta actin by densitometry (n=3 per group). (C) Live cell count of MDA-MB-231 cells after 72 hours of proliferation in complete medium. White bars represent 15,000 cells that were plated on day 0. Black bars represent the mean cell count for each group after 72 hours. (D) Live cell count of MCNeuA cells after 96 hours of proliferation in complete medium. White bars represent 15,000 cells that were plated on day 0. Black bars represent the mean cell count for each group after 96 hours. (E) Representative images of 3D “on top” cultures of MDA-MB-231 cells and (F) of MCNeuA cells after 5 days. (G) MDA-MB-231 live cell counts after trypan blue exclusion after 96 hours of cell growth in serum deficient medium (DMEM with 0.3% charcoal stripped FBS). White bars represent the number of cells seeded per well in a 12 well plate black bars represent the number of cells present after 96 hours. (H) Representative Western blot analysis of cleaved Caspase 3 in MDA-MB-231 cells with control shRNA (Ctrl), and LDLR targeting shRNA (H1, H2) after 48 hours of serum starvation in DMEM, 0.3% charcoal stripped FBS, 1% penicillin/streptomycin. (I Densitometry quantification of cleaved Caspase 3/beta actin in MDA-MB-231 cells and (J) MCNeuA cells from Western blots of protein lysates from control (Ctrl) and LDLR shRNA infected cells (H1, H2; M1, M2, respectively) after 48 hours of serum starvation in DMEM 0.3% charcoal stripped FBS, 1% penicillin/streptomycin. Densitometry graphs are the mean of each group relative to the expression level of the control (Ctrl) group. Graphs are the mean of each group, error bars represent SEM. * p<0.05 between groups as indicated.
Higher LDLR in human breast cancers is associated with decreased recurrence free survival in women treated with systemic hormonal therapy
Using KMplot [26] and PROGgeneV2 [27], we then examined the effect of LDLR expression in human breast cancers on overall and recurrence free survival in publically available gene expression databases to determine the clinical relevance of our findings (Figure 7). High breast cancer LDLR expression was associated with lower overall survival, HR 1.8 (1.41–2.45, p1.21e-05, n=114), and recurrence-free survival, HR 2.1 (1.35–3.26, p0.000982, n=114) in a French cohort of women treated with tamoxifen and followed up for more than 5 years (GSE9893, Figure 7A, Figure 7B, [28]. Similarly, in a Canadian cohort of women treated with tamoxifen, high LDLR expression was associated with decreased recurrence free survival (Figure 7C), HR 2.75 (1.06–7.09, p=0.037, GSE9195, n=77) [29]. Analyzing estrogen receptor negative tumors that had high LDLR expression in a cohort from the UK who received systemic chemotherapy and had 10 years of follow up [30], the recurrence free survival was also significantly lower in the group with high LDLR expression (HR 1.87 (1.05–3.33, p=0.032, n=82, Figure 7D). In the TGCA dataset, we found that in patients who received systemic treatment with endocrine therapy with or without chemotherapy, those with high LDLR expression had decreased recurrence free survival (HR 1.5 (1.18–1.92, p=0.0011, n=1064, Figure 7E) [31]. These results suggest that higher expression of the LDLR is associated with resistance of cancer cells to systemic therapies.
Figure 7.

Overall survival and recurrence free survival (RFS) Kaplan Meier plots generated using PROGgene V2 (A–D) and KMplot (E). LDLR expression was divided into high and low expression by the median of the population. Red lines represent the group with high LDLR expression, green (A–D) or black (E) lines represent the group with low LDLR expression. Hazard ratios (HR), 95% confidence intervals and p values are shown below the graphs. GSE numbers are the National Center for Biotechnology Information (NCBI) Gene Expression Omnibus (GEO) accession numbers.
Discussion
The results of our studies show that in immunocompetent and novel immunodeficient mouse models of hyperlipidemia, tumors from breast cancer cells with high LDLR expression grow incrementally larger with increasing serum LDL concentrations. In addition, we show that breast cancer cells with shRNA-mediated knockdown of LDLR expression have reduced tumor growth in the setting of hyperlipidemia. Our in vitro studies show that breast cancer cells upregulate the LDLR in the setting of serum starvation, and cells that are unable to upregulate the LDLR have reduced survival, and increased Caspase 3 cleavage. Furthermore, we show that in human breast cancers from four international cohorts, higher LDLR expression is associated with a worse prognosis in patients who undergo systemic therapy. Overall, these data support a role for elevated circulating LDL and breast cancer expression of the LDLR in HER2 overexpressing and triple negative breast cancer progression and disease-free survival.
Previous animal studies have not examined the effect of the LDLR in breast cancer progression, or the role of the LDLR in breast cancer cell survival in vivo. From human studies, tumors that contain higher levels of esterified cholesterol have been reported to be more aggressive, and have higher LDLR mRNA expression [32]. A small study (n=16) that examined the effect of chemotherapy on LDLR expression by IHC found that after chemotherapy a subset of tumors had reduced LDLR expression, while others had increased LDLR expression [33]. Circulating lipid levels were not available for these cases, and the study was too small to determine if LDLR expression was related to resistance to chemotherapy or cancer recurrence. A previous mouse study of MMTV-polyoma virus middle T antigen (MMTV-PyVT) transgenic mice found that adiponectin deficiency increased circulating LDL concentrations, tumor LDLR expression and tumor growth [14]. However, adiponectin may also be a tumor suppressing adipokine [34]. In vitro studies have found other factors that may also increase LDLR expression in certain cell lines, including tamoxifen [35]. Our current results imply that expression of the LDLR in breast cancer cells confers a survival benefit to the cells, and the inability of cells to upregulate the LDLR leads to cell death in the setting of serum starvation.
These results are consistent with previously published studies examining the importance of the LDLR in the brain and liver. LDLR deficiency in the brain was found to be associated with decreased proliferation and apoptosis in the hippocampus of mice [36, 37]. Increased apoptosis in the liver was also observed in mice lacking the LDLR [38]. Previous in vitro studies on breast cancer cell lines have reported that inhibiting MEK and PKC leads to downregulation of the LDLR [16]. Therefore, if upregulating the LDLR is a mechanism of resistance to chemotherapy and endocrine therapy, also targeting specific pathways to downregulate the LDLR may increase the response to systemic therapy.
How exactly LDL cholesterol promotes breast cancer progression is not entirely clear. Cholesterol appears to have direct effects on tumor cells; it alters membrane fluidity, alters cell signaling, and it may be involved in driving the Warburg effect [39, 16, 40, 41]. Cholesterol is also converted to oxysterols, including 27-hydroxycholesterol, which acts as selective estrogen receptor modulators and ligand for liver × receptors (LXR) in estrogen receptor positive breast cancer cell lines and tumors [13]. Our current study focused on triple negative breast cancers and HER2 overexpressing cancers where LDLR expression was found to be high and alternative cholesterol-induced mechanisms may be involved. Cholesterol may also lead to increased tumor associated inflammation, as occurs in atherosclerotic lesions and in the liver in the setting of elevated LDL cholesterol [42].
Overall, our studies show that elevated LDL and high tumor cell LDLR expression are important for breast cancer growth, and that decreasing LDLR expression in triple negative and HER2 overexpressing breast cancer cells increases cell death and reduces the growth of tumors in the setting of hyperlipidemia. Through these mechanisms cholesterol may contribute to increased breast cancer recurrence and mortality in obese women.
Materials and Methods
Animal models
All animal procedures described in this paper were compliant with the current Guide of the Care and Use of Laboratory Animals and approval was obtained from the Icahn School of Medicine at Mount Sinai Institutional Animal Care and Use Committee. ApoE knockout (ApoE−/−) mice and LDLR knockout (LDLR−/−) mice on a Friend Virus B (FVB) background were provided by Dr. Jan Breslow (Rockefeller University, New York, NY) [43, 44]. The phenotype of the ApoE−/− mice on an FVB background have been previously described [12, 43]. LDLR−/− mice were re-derived at the Mount Sinai Mouse Genetics and Gene Targeting Core Facility using wild-type FVB mice and were crossed to homozygosity. The Rag1−/− mice on an FVB background were given to us by Dr. Lisa Coussens (Oregon Health and Science University, Portland, OR). Rag1−/− mice were crossbred with the ApoE−/− and LDLR−/− mice to generate homozygous Rag1−/−/ApoE−/− and Rag1−/−/LDLR−/− mice. Mouse genotype was confirmed using the following primers: ApoE primer 1: CTCTGTGGGCCGTGCTGTTGGTCACATTGCTGACA, ApoE primer 2: CGCCGCTCCCGATTCGCAGCGCATCGC, ApoE primer 3: CTCGAGCTGATCTGTCACCTCCGGCTCTCCC; LDLR primer 1: AATCCATCTTGTTCAATGGCCGATC, LDLR primer 2: CCATATGCATCCCCAGTCTT, LDLR primer 3: GCGATGGATACACTCACTGC. Rag1 primer 1: AGACACAACGGCTTGCAACACAG, Rag1 primer 2: TGCCGAGAAAGTCCTTCTGCCAG, Rag1 primer 3: GTGGAATGAGTGCGAGGCCAGA. DNA electrophoresis results are shown in Supplementary Figure 1.
Tumor studies were started in virgin female mice aged between 8 and 12 weeks. The mice were housed in the Mount Sinai Center for Comparative Medicine and Surgery (CCMS) facility. Mice were housed 4–5 per cage in the CCMS facility with a 7am–7pm light and 7pm to 7am dark cycle and were fed a standard mouse chow diet (PicoLab 5053, Brentwood, MO, USA), or a Western high-fat/high-cholesterol (HF/HC) diet which contains 1.25% cholesterol and 20% (gram%) fat (D12108C: Research Diets, New Brunswick, NJ, USA), as indicated in the studies. Animal numbers for tumor studies were based on the anticipated difference in growth of the tumors between the groups, and expected variance in the growth of the tumors in each group. Sample sizes for each experiment are detailed in the figure legends. For shRNA tumor studies, mice were randomly selected from the different genotypes of similar age assigned to the study (WT, LDLR−/− and ApoE−/−) to receive control, M1, or M2 shRNA MCNeuA tumor cells. No blinding of the investigator was performed.
Cell Culture
Human MDA-MB-231 and MDA-MB-468 were obtained from American Type Culture Collection (ATCC, Manassas, VA). Cell line authentication of MDA-MB-231 cells was performed by IDEXX Bioresearch (Columbia, MO) in October 2015. MDA-MB-468 cells were received from ATCC in August 2014 at passage 349. MCF7 cells originated from Dr. Kent Osborne at Baylor College of Medicine (Houston, TX) [45]. The MCNeuA mouse carcinoma cell line was established from MMTV-Neu (FVB/N) transgenic mouse tumors [46]. MDA-MB-231, MDA-MB-468 and MCNeuA cells were grown in Dulbecco’s Modified Eagles Medium (DMEM) supplemented with 10% Fetal Bovine Serum (FBS) (Invitrogen Life Technologies, Grand Island, NY), 100U/ml penicillin, 100μg/ml streptomycin (Mediatech, Manassas, VA). Serum starvation studies were performed using DMEM, 0.3% Charcoal Stripped FBS (Sigma-Aldrich, St. Louis, MO). Cells with lentiviral plasmid DNA were selected using puromycin and maintained in 1.5¼g/ml. Cells were cultured at 37C in 5% CO2. 3D culture was performed using the 3D “on-top” assay, as previously described (17396127 [47]).
LDLR shRNA
Glycerol stocks of lentiviral shRNA targeting LDLR were obtained from Sigma-Aldrich (St. Louis, MO). shRNA sequences were: control shRNA: CAACAAGATGAAGAGCACCAA, and LDLR shRNA human (H1) GATGAAGTTGGCTGCGTTAAT, human (H2) GGGCGACAGATGCGAAAGAAA, mouse (M1) AGTCGCCATTCTCCCTTAATA, mouse (M2) ACGGGTTCAGATGTGAATTTG. Plasmid DNA generation, HEK293FT transfection, and target cell lentiviral transduction were performed as previously described [48]. After the transduction, puromycin was used for selection of stable knockdown of the LDLR in the tumor cells. LDLR protein reduction was confirmed by Western Blot analysis.
Tumor Studies
2 × 10⁶ MCNeuA, or 5 × 10⁶ MDA-MB-231 cells or lentiviral transduced cells from these lines injected into mice after being resuspended in 100μL of sterile PBS. For MDA-MB-468 cell injection, 5 × 10⁶ cells were diluted 1:1 in PBS/Matrigel (Trevigen, Gaithersburg, MD). All cell lines were injected into the 4th mammary fat pad of 10–14 week old LDLR−/− and ApoE−/− mice and FVB control mice (MCNeuA) or Rag1−/−/LDLR−/−, Rag1−/−/ApoE−/− and Rag1−/− control mice (MDA-MB-231 and MDA-MB-468), as indicated. Mice were fed a Western diet as indicated. Tumor measurements were made by measuring 3 dimensions (anterior to posterior, cranial to caudal, and lateral). The following formula was used to calculate tumor volume: 4/3 × pi × (length/2) × (width/2) × (depth/2). Micro-ultrasound (US) was performed for 3D imaging and tumor volume analysis using the Vevo 2100 (Visual Sonics, Toronto, Canada) micro-ultrasound system at the Mount Sinai Translational and Molecular Imaging Core facility.
Proliferation and survival assays
15,000 MDA-MB-231 and MCNeuA cells were plated in each well of 12-well plates and were placed in the incubator to adhere overnight. The following morning, medium was then changed to either DMEM/10% FBS/1% penicillin/streptomycin, or DMEM containing 0.3% charcoal stripped FBS, 1% penicillin/streptomycin. Cells were then cultured for 72 hours (MDA-MB-231 cells) or 96 hours (MCNeuA cells). Medium with non-adherent cells was collected and the adherent cells were detached using TrypLE express (Invitrogen, Carlsbad, CA), collected in PBS, and were added to the non-adherent cells from the same well. Cells were centrifuged at 1200rpm for 5 minutes. Cell pellets were resuspended in 50–100ul of PBS, diluted in trypan blue (1:1) and were counted using TC20 automated cell counter (Bio-Rad, Hercules, CA).
Western Blotting
Protein isolation from cells and tumors for Western blot analysis, and the Western blot procedures were performed as previously described [49]. Western blot membrane images were captured using the Li-Cor infrared imaging system and were quantified using Licor Software (Li-Cor Biosciences, Lincoln, NE).
Histology and immunohistochemistry staining
Tumors were removed from the mice andfixed in 10% zinc formalin. They were paraffin embedded and sectioned at the Icahn School of Medicine Biorepository and Pathology Core Facility. Sections were deparaffinized, rehydrated, subjected to Tris-EDTA pH 9 or Sodium Citrate EDTA pH 6.0 antigen retrieval (microwave for 20 min). Blocking was performed in TBS with 0.1% Tween20 for 1 hour at room temperature, and primary antibody (LDLR 1:500 dilution; Abcam, Cambridge, MA) was diluted in Signal Stain diluent (Cell Signaling Technology, Danvers, MA) and incubated overnight at 4 C. The following day sections were incubated with secondary antibody (SignalStain Boost Rabbit, HRP, Cell Signaling Technology, Danvers, MA) for 1 hour, and DAB (Immpact DAB Peroxidase substrate, VectorLabs, Burlingame, CA) for 5 minutes. Nuclei were stained with Harris Hematoxylin (Sigma-Aldrich, St. Louis, MO). Tumor sections were then washed in tap water, and briefly dipped in acid alcohol, followed by ammonium hydroxide. They were dehydrated in ethanol and xylene washes and mounted using Eukitt mounting medium (Electron microscopy sciences, Hatfield, PA). Images of the stained tumor sections were captured using an Olympus AX70 microscope.
Antibodies
Rrimary antibodies used for Western blotting and immunohistochemistry were as follows: LDLR (ab52818, Abcam, Cambridge, MA), cleaved Caspase 3 (#9664 Cell Signaling Technology, Danvers, CA), total caspase 3 (#9662 Cell Signaling Technology, Danvers, CA) and β-actin (A228, Sigma-Aldrich, St. Louis, MO).
Metabolic Studies
Weekly body weights were recorded once a week from 8-weeks of age. Insulin tolerance test was performed on 8-week old mice after a 2 hour fast. Insulin (0.75 units/kg) was administered by intraperitoneal injection. Blood glucose levels were measured using a Bayer Contour Next Glucometer (Bayer HealthCare, Mishawaka, IN) at time 0 (immediately before injection) and 15, 30, and 60 minutes after insulin injection. Total serum cholesterol levels were measured using the Pointe Scientific Liquid Cholesterol kit (Pointe Scientific, Canton, MI). Low-density lipoprotein levels were measured using the Biovision HDL and LDL/VLDL Quantification Colorimetric Kit (Biovision, Milpitas, CA).
Statistical analysis
All data are expressed as mean ± SEM. F-test was performed to determine if groups had equal variance prior to performing a Student’s t-test. Student’s 2 tailed t-test and, where appropriate, Kruskall Wallis H Test followed by Conover post-hoc test, were used with P value ≤ 0.05 considered statistically significant using SPSS Statistics (IBS, Armonk, NY).
Recurrence free survival and overall survival data from human breast cancer databases
LDLR gene expression data in human breast cancer was obtained from the following publically available prognostic databases: PROGgene V2 [27], and KM plot [26]. Analysis was performed by dividing the populations into high or low LDLR expression determined by the median of the population.
Supplementary Material
Acknowledgments
Research in this study was funded by NCI/NIH K08 CA190779 to EJG, NCI/NIH R01 CA200553 to DLR, Tisch Cancer Institute at Mount Sinai Junior Scientist Award to EJG. We would like to acknowledge the Icahn School of Medicine at Mount Sinai Mouse Genetics and Gene Targeting Core Facility, Translational and Molecular Imaging Core facility and the Biorepository and Pathology Core Facility.
Footnotes
Conflicts of Interest: The authors declare no conflicts of interest.
References
- 1.Demark-Wahnefried W, Platz EA, Ligibel JA, Blair CK, Courneya KS, Meyerhardt JA, et al. The role of obesity in cancer survival and recurrence. Cancer epidemiology, biomarkers & prevention : a publication of the American Association for Cancer Research, cosponsored by the American Society of Preventive Oncology. 2012;21(8):1244–59. doi: 10.1158/1055-9965.EPI-12-0485. [DOI] [PMC free article] [PubMed] [Google Scholar]
- 2.Chahil TJ, Ginsberg HN. Diabetic dyslipidemia. Endocrinol Metab Clin North Am. 2006;35(3):491–510. vii–viii. doi: 10.1016/j.ecl.2006.06.002. [DOI] [PubMed] [Google Scholar]
- 3.Alberti KG, Zimmet P, Shaw J. Metabolic syndrome–a new world-wide definition. A Consensus Statement from the International Diabetes Federation. Diabet Med. 2006;23(5):469–80. doi: 10.1111/j.1464-5491.2006.01858.x. [DOI] [PubMed] [Google Scholar]
- 4.Bahl M, Ennis M, Tannock IF, Hux JE, Pritchard KI, Koo J, et al. Serum lipids and outcome of early-stage breast cancer: results of a prospective cohort study. Breast cancer research and treatment. 2005;94(2):135–44. doi: 10.1007/s10549-005-6654-9. [DOI] [PubMed] [Google Scholar]
- 5.Rodrigues Dos Santos C, Fonseca I, Dias S, Mendes de Almeida JC. Plasma level of LDL-cholesterol at diagnosis is a predictor factor of breast tumor progression. BMC cancer. 2014;14:132. doi: 10.1186/1471-2407-14-132. [DOI] [PMC free article] [PubMed] [Google Scholar]
- 6.Mansourian M, Haghjooy-Javanmard S, Eshraghi A, Vaseghi G, Hayatshahi A, Thomas J. Statins Use and Risk of Breast Cancer Recurrence and Death: A Systematic Review and Meta-Analysis of Observational Studies. Journal of pharmacy & pharmaceutical sciences : a publication of the Canadian Society for Pharmaceutical Sciences, Societe canadienne des sciences pharmaceutiques. 2016;19(1):72–81. doi: 10.18433/J3202B. [DOI] [PubMed] [Google Scholar]
- 7.Kuzu OF, Noory MA, Robertson GP. The Role of Cholesterol in Cancer. Cancer research. 2016;76(8):2063–70. doi: 10.1158/0008-5472.CAN-15-2613. [DOI] [PMC free article] [PubMed] [Google Scholar]
- 8.Pelton K, Coticchia CM, Curatolo AS, Schaffner CP, Zurakowski D, Solomon KR, et al. Hypercholesterolemia induces angiogenesis and accelerates growth of breast tumors in vivo. The American journal of pathology. 2014;184(7):2099–110. doi: 10.1016/j.ajpath.2014.03.006. [DOI] [PMC free article] [PubMed] [Google Scholar]
- 9.Llaverias G, Danilo C, Mercier I, Daumer K, Capozza F, Williams TM, et al. Role of cholesterol in the development and progression of breast cancer. The American journal of pathology. 2011;178(1):402–12. doi: 10.1016/j.ajpath.2010.11.005. [DOI] [PMC free article] [PubMed] [Google Scholar]
- 10.Hogarth CA, Roy A, Ebert DL. Genomic evidence for the absence of a functional cholesteryl ester transfer protein gene in mice and rats. Comparative biochemistry and physiology Part B, Biochemistry & molecular biology. 2003;135(2):219–29. doi: 10.1016/s1096-4959(03)00046-0. [DOI] [PubMed] [Google Scholar]
- 11.Yin W, Carballo-Jane E, McLaren DG, Mendoza VH, Gagen K, Geoghagen NS, et al. Plasma lipid profiling across species for the identification of optimal animal models of human dyslipidemia. Journal of lipid research. 2012;53(1):51–65. doi: 10.1194/jlr.M019927. [DOI] [PMC free article] [PubMed] [Google Scholar]
- 12.Alikhani N, Ferguson RD, Novosyadlyy R, Gallagher EJ, Scheinman EJ, Yakar S, et al. Mammary tumor growth and pulmonary metastasis are enhanced in a hyperlipidemic mouse model. Oncogene. 2013;32(8):961–7. doi: 10.1038/onc.2012.113. [DOI] [PMC free article] [PubMed] [Google Scholar]
- 13.Nelson ER, Wardell SE, Jasper JS, Park S, Suchindran S, Howe MK, et al. 27-Hydroxycholesterol links hypercholesterolemia and breast cancer pathophysiology. Science. 2013;342(6162):1094–8. doi: 10.1126/science.1241908. [DOI] [PMC free article] [PubMed] [Google Scholar]
- 14.Liu J, Xu A, Lam KS, Wong NS, Chen J, Shepherd PR, et al. Cholesterol-induced mammary tumorigenesis is enhanced by adiponectin deficiency: role of LDL receptor upregulation. Oncotarget. 2013;4(10):1804–18. doi: 10.18632/oncotarget.1364. [DOI] [PMC free article] [PubMed] [Google Scholar]
- 15.Brown MS, Goldstein JL. Expression of the familial hypercholesterolemia gene in heterozygotes: mechanism for a dominant disorder in man. Science. 1974;185(4145):61–3. doi: 10.1126/science.185.4145.61. [DOI] [PubMed] [Google Scholar]
- 16.Antalis CJ, Uchida A, Buhman KK, Siddiqui RA. Migration of MDA-MB-231 breast cancer cells depends on the availability of exogenous lipids and cholesterol esterification. Clinical & experimental metastasis. 2011;28(8):733–41. doi: 10.1007/s10585-011-9405-9. [DOI] [PubMed] [Google Scholar]
- 17.Stranzl A, Schmidt H, Winkler R, Kostner GM. Low-density lipoprotein receptor mRNA in human breast cancer cells: influence by PKC modulators. Breast cancer research and treatment. 1997;42(3):195–205. doi: 10.1023/a:1005754026205. [DOI] [PubMed] [Google Scholar]
- 18.Rudling MJ, Stahle L, Peterson CO, Skoog L. Content of low density lipoprotein receptors in breast cancer tissue related to survival of patients. British medical journal. 1986;292(6520):580–2. doi: 10.1136/bmj.292.6520.580. [DOI] [PMC free article] [PubMed] [Google Scholar]
- 19.Mombaerts P, Iacomini J, Johnson RS, Herrup K, Tonegawa S, Papaioannou VE. RAG-1-deficient mice have no mature B and T lymphocytes. Cell. 1992;68(5):869–77. doi: 10.1016/0092-8674(92)90030-g. [DOI] [PubMed] [Google Scholar]
- 20.Plump AS, Smith JD, Hayek T, Aalto-Setala K, Walsh A, Verstuyft JG, et al. Severe hypercholesterolemia and atherosclerosis in apolipoprotein E-deficient mice created by homologous recombination in ES cells. Cell. 1992;71(2):343–53. doi: 10.1016/0092-8674(92)90362-g. [DOI] [PubMed] [Google Scholar]
- 21.Ishibashi S, Brown MS, Goldstein JL, Gerard RD, Hammer RE, Herz J. Hypercholesterolemia in low density lipoprotein receptor knockout mice and its reversal by adenovirus-mediated gene delivery. The Journal of clinical investigation. 1993;92(2):883–93. doi: 10.1172/JCI116663. [DOI] [PMC free article] [PubMed] [Google Scholar]
- 22.Winer S, Chan Y, Paltser G, Truong D, Tsui H, Bahrami J, et al. Normalization of obesity-associated insulin resistance through immunotherapy. Nature medicine. 2009;15(8):921–9. doi: 10.1038/nm.2001. [DOI] [PMC free article] [PubMed] [Google Scholar]
- 23.Weitman ES, Aschen SZ, Farias-Eisner G, Albano N, Cuzzone DA, Ghanta S, et al. Obesity impairs lymphatic fluid transport and dendritic cell migration to lymph nodes. PloS one. 2013;8(8):e70703. doi: 10.1371/journal.pone.0070703. [DOI] [PMC free article] [PubMed] [Google Scholar]
- 24.Lamas B, Nachat-Kappes R, Goncalves-Mendes N, Mishellany F, Rossary A, Vasson MP, et al. Dietary fat without body weight gain increases in vivo MCF-7 human breast cancer cell growth and decreases natural killer cell cytotoxicity. Molecular carcinogenesis. 2015;54(1):58–71. doi: 10.1002/mc.22074. [DOI] [PubMed] [Google Scholar]
- 25.Liu X, Huh JY, Gong H, Chamberland JP, Brinkoetter MT, Hamnvik OP, et al. Lack of mature lymphocytes results in obese but metabolically healthy mice when fed a high-fat diet. International journal of obesity. 2015;39(10):1548–57. doi: 10.1038/ijo.2015.93. [DOI] [PMC free article] [PubMed] [Google Scholar]
- 26.Szasz AM, Lanczky A, Nagy A, Forster S, Hark K, Green JE, et al. Cross-validation of survival associated biomarkers in gastric cancer using transcriptomic data of 1,065 patients. Oncotarget. 2016;7(31):49322–33. doi: 10.18632/oncotarget.10337. [DOI] [PMC free article] [PubMed] [Google Scholar]
- 27.Goswami CP, Nakshatri H. PROGgene: gene expression based survival analysis web application for multiple cancers. Journal of clinical bioinformatics. 2013;3(1):22. doi: 10.1186/2043-9113-3-22. [DOI] [PMC free article] [PubMed] [Google Scholar]
- 28.Chanrion M, Negre V, Fontaine H, Salvetat N, Bibeau F, Mac Grogan G, et al. A gene expression signature that can predict the recurrence of tamoxifen-treated primary breast cancer. Clinical cancer research : an official journal of the American Association for Cancer Research. 2008;14(6):1744–52. doi: 10.1158/1078-0432.CCR-07-1833. [DOI] [PMC free article] [PubMed] [Google Scholar]
- 29.Loi S, Haibe-Kains B, Desmedt C, Wirapati P, Lallemand F, Tutt AM, et al. Predicting prognosis using molecular profiling in estrogen receptor-positive breast cancer treated with tamoxifen. BMC genomics. 2008;9:239. doi: 10.1186/1471-2164-9-239. [DOI] [PMC free article] [PubMed] [Google Scholar]
- 30.Buffa FM, Camps C, Winchester L, Snell CE, Gee HE, Sheldon H, et al. microRNA-associated progression pathways and potential therapeutic targets identified by integrated mRNA and microRNA expression profiling in breast cancer. Cancer research. 2011;71(17):5635–45. doi: 10.1158/0008-5472.CAN-11-0489. [DOI] [PubMed] [Google Scholar]
- 31.Gyorffy B, Lanczky A, Eklund AC, Denkert C, Budczies J, Li Q, et al. An online survival analysis tool to rapidly assess the effect of 22,277 genes on breast cancer prognosis using microarray data of 1,809 patients. Breast cancer research and treatment. 2010;123(3):725–31. doi: 10.1007/s10549-009-0674-9. [DOI] [PubMed] [Google Scholar]
- 32.de Gonzalo-Calvo D, Lopez-Vilaro L, Nasarre L, Perez-Olabarria M, Vazquez T, Escuin D, et al. Intratumor cholesteryl ester accumulation is associated with human breast cancer proliferation and aggressive potential: a molecular and clinicopathological study. BMC cancer. 2015;15:460. doi: 10.1186/s12885-015-1469-5. [DOI] [PMC free article] [PubMed] [Google Scholar]
- 33.Pires LA, Hegg R, Freitas FR, Tavares ER, Almeida CP, Baracat EC, et al. Effect of neoadjuvant chemotherapy on low-density lipoprotein (LDL) receptor and LDL receptor-related protein 1 (LRP-1) receptor in locally advanced breast cancer. Brazilian journal of medical and biological research = Revista brasileira de pesquisas medicas e biologicas. 2012;45(6):557–64. doi: 10.1590/S0100-879X2012007500068. [DOI] [PMC free article] [PubMed] [Google Scholar]
- 34.Grossmann ME, Nkhata KJ, Mizuno NK, Ray A, Cleary MP. Effects of adiponectin on breast cancer cell growth and signaling. British journal of cancer. 2008;98(2):370–9. doi: 10.1038/sj.bjc.6604166. [DOI] [PMC free article] [PubMed] [Google Scholar]
- 35.Suarez Y, Fernandez C, Gomez-Coronado D, Ferruelo AJ, Davalos A, Martinez-Botas J, et al. Synergistic upregulation of low-density lipoprotein receptor activity by tamoxifen and lovastatin. Cardiovascular research. 2004;64(2):346–55. doi: 10.1016/j.cardiores.2004.06.024. [DOI] [PubMed] [Google Scholar]
- 36.Mulder M, Koopmans G, Wassink G, Al Mansouri G, Simard ML, Havekes LM, et al. LDL receptor deficiency results in decreased cell proliferation and presynaptic bouton density in the murine hippocampus. Neuroscience research. 2007;59(3):251–6. doi: 10.1016/j.neures.2007.07.004. [DOI] [PubMed] [Google Scholar]
- 37.Wang SH, Huang Y, Yuan Y, Xia WQ, Wang P, Huang R. LDL receptor knock-out mice show impaired spatial cognition with hippocampal vulnerability to apoptosis and deficits in synapses. Lipids in health and disease. 2014;13:175. doi: 10.1186/1476-511X-13-175. [DOI] [PMC free article] [PubMed] [Google Scholar]
- 38.Bieghs V, Van Gorp PJ, Wouters K, Hendrikx T, Gijbels MJ, van Bilsen M, et al. LDL receptor knock-out mice are a physiological model particularly vulnerable to study the onset of inflammation in non-alcoholic fatty liver disease. PloS one. 2012;7(1):e30668. doi: 10.1371/journal.pone.0030668. [DOI] [PMC free article] [PubMed] [Google Scholar]
- 39.Zhao W, Prijic S, Urban BC, Tisza MJ, Zuo Y, Li L, et al. Candidate Antimetastasis Drugs Suppress the Metastatic Capacity of Breast Cancer Cells by Reducing Membrane Fluidity. Cancer research. 2016;76(7):2037–49. doi: 10.1158/0008-5472.CAN-15-1970. [DOI] [PMC free article] [PubMed] [Google Scholar]
- 40.Badana A, Chintala M, Varikuti G, Pudi N, Kumari S, Kappala VR, et al. Lipid Raft Integrity Is Required for Survival of Triple Negative Breast Cancer Cells. Journal of breast cancer. 2016;19(4):372–84. doi: 10.4048/jbc.2016.19.4.372. [DOI] [PMC free article] [PubMed] [Google Scholar]
- 41.Ribas V, Garcia-Ruiz C, Fernandez-Checa JC. Mitochondria, cholesterol and cancer cell metabolism. Clinical and translational medicine. 2016;5(1):22. doi: 10.1186/s40169-016-0106-5. [DOI] [PMC free article] [PubMed] [Google Scholar]
- 42.Choudhury RP, Rong JX, Trogan E, Elmalem VI, Dansky HM, Breslow JL, et al. High-density lipoproteins retard the progression of atherosclerosis and favorably remodel lesions without suppressing indices of inflammation or oxidation. Arteriosclerosis, thrombosis, and vascular biology. 2004;24(10):1904–9. doi: 10.1161/01.ATV.0000142808.34602.25. [DOI] [PubMed] [Google Scholar]
- 43.Dansky HM, Charlton SA, Sikes JL, Heath SC, Simantov R, Levin LF, et al. Genetic background determines the extent of atherosclerosis in ApoE-deficient mice. Arteriosclerosis, thrombosis, and vascular biology. 1999;19(8):1960–8. doi: 10.1161/01.atv.19.8.1960. [DOI] [PubMed] [Google Scholar]
- 44.Teupser D, Persky AD, Breslow JL. Induction of atherosclerosis by low-fat, semisynthetic diets in LDL receptor-deficient C57BL/6J and FVB/NJ mice: comparison of lesions of the aortic root, brachiocephalic artery, and whole aorta (en face measurement) Arteriosclerosis, thrombosis, and vascular biology. 2003;23(10):1907–13. doi: 10.1161/01.ATV.0000090126.34881.B1. [DOI] [PubMed] [Google Scholar]
- 45.Zeng X, Sachdev D, Zhang H, Gaillard-Kelly M, Yee D. Sequencing of type I insulin-like growth factor receptor inhibition affects chemotherapy response in vitro and in vivo. Clinical cancer research : an official journal of the American Association for Cancer Research. 2009;15(8):2840–9. doi: 10.1158/1078-0432.CCR-08-1401. [DOI] [PMC free article] [PubMed] [Google Scholar]
- 46.Campbell MJ, Wollish WS, Lobo M, Esserman LJ. Epithelial and fibroblast cell lines derived from a spontaneous mammary carcinoma in a MMTV/neu transgenic mouse. In vitro cellular & developmental biology Animal. 2002;38(6):326–33. doi: 10.1290/1071-2690(2002)038<0326:EAFCLD>2.0.CO;2. [DOI] [PubMed] [Google Scholar]
- 47.Lee GY, Kenny PA, Lee EH, Bissell MJ. Three-dimensional culture models of normal and malignant breast epithelial cells. Nature methods. 2007;4(4):359–65. doi: 10.1038/nmeth1015. [DOI] [PMC free article] [PubMed] [Google Scholar]
- 48.Zelenko Z, Gallagher EJ, Tobin-Hess A, Belardi V, Rostoker R, Blank J, et al. Silencing vimentin expression decreases pulmonary metastases in a pre-diabetic mouse model of mammary tumor progression. Oncogene. 2016 doi: 10.1038/onc.2016.305. [DOI] [PMC free article] [PubMed] [Google Scholar]
- 49.Ferguson RD, Novosyadlyy R, Fierz Y, Alikhani N, Sun H, Yakar S, et al. Hyperinsulinemia enhances c-Myc-mediated mammary tumor development and advances metastatic progression to the lung in a mouse model of type 2 diabetes. Breast cancer research : BCR. 2012;14(1):R8. doi: 10.1186/bcr3089. [DOI] [PMC free article] [PubMed] [Google Scholar]
Associated Data
This section collects any data citations, data availability statements, or supplementary materials included in this article.