Abstract
Background
A limitation to the expanded use of high-resolution pharyngeal manometry in clinical practice is the lack of useful pharyngeal parameters that are easy to interpret, generalizable between patients and do not require specialized software. In this study we sought to test the relationship between the pharyngeal contractile integral with videofluoroscopic abnormalities as assessed with the Modified Barium Swallow Impairment Profile©™.
Methods
Adult dysphagic patients were recruited to undergo simultaneous high-resolution pharyngeal manometry and videofluoroscopy during a standardized swallowing protocol.
Key Results
36 patients were included in the study. The mean pharyngeal contractile integral was 247 mmHg-sec-cm (range 2–488 mmHg-s-cm). The lower pharyngeal total group (N=20; mean PT=3.9) had a mean pharyngeal contractile integral of 299 mmHg-s-cm while the higher pharyngeal total group (N = 16; mean PT=12.7) had a mean pharyngeal contractile integral score of 188 mmHg-s-cm (p=0.01). There was also a significant negative correlation between normalized pharyngeal contractile integral to pharyngeal total scores (r=−0.47, p=0.004). Patients with higher pharyngeal contractile integrals exhibited less severe penetration-aspiration scores on thin liquids (1.44 versus 3.78; p=0.03) and all consistencies combined (1.21 versus 1.99; p=0.03).
Conclusions & Inferences
The pharyngeal contractile integral is a useful indicator of the presence of pharyngeal swallowing impairment and is technically simple to calculate with currently available software programs. Advancement of software is necessary to refine the clinical value of this parameter. High-resolution pharyngeal manometry has the potential to be a valuable adjunct procedure for the evaluation and treatment of dysphagic individuals.
Keywords: manometry, dysphagia, pharynx
Graphical Abstract
Videofluoroscopic imaging is considered the gold standard for the evaluation of oropharyngeal swallowing function. Videofluoroscopy (VFS) permits the visualization of bolus flow in relation to structural movement throughout the upper aerodigestive tract in real-time. It also detects the presence and timing of aspiration and assists in identifying the underlying physiologic manifestations of swallowing impairment. Pressures generated by structural movements during swallowing are critical for bolus transport and airway protection, yet VFS does not provide this type of pressure assessment.
High-resolution pharyngeal manometry (HRPM) is an instrumental evaluation that permits measurement of intraluminal pressure activity in the pharynx. HRPM has the advantage over previous manometry methodology in that circumferential pressure sensors are spaced at 1cm intervals, providing a more accurate representation of pharyngeal contractility. The benefits of HRPM over VFS are its relative portability, automated scoring potential that facilitates rapid interpretation and avoidance of exposure to radiation. These benefits may allow HRPM to be utilized as a screening examination of pharyngeal function, in treatment sessions as biofeedback and/or to evaluate the efficacy of targeted interventions. HRPM could also serve as an adjuvant to other diagnostic modalities such as VFS or endoscopy.
A limitation to the expanded use of HRPM in clinical practice is the lack of useful pharyngeal parameters that are easy to interpret, generalizable between patients and do not require specialized software. In this study, we evaluated a pharyngeal contractile integral (PhCI), which is analogous to the distal contractile integral (DCI) of the esophagus, a well characterized parameter used for the description of esophageal motility disorders.1 PhCI is a measure of the “vigor” of the pharyngeal contraction, taking into consideration the pressure amplitude, duration and length of the pharyngeal contraction. Nativ-Zelter et al2 evaluated PhCI in normal subjects and found an average PhCI of 308 ± 111 (162–504) for 5 ml thin liquids, 305 ± 94 (191–480) for 3 ml pudding, and 296 ± 99 (148–500) for cookie swallows. Interestingly, they found some age-related differences, reporting that older subjects (age ≥ 60) exhibited higher average PhCI (351 mmHg-s-cm) as compared to younger subjects (age ≤ 40) who had an average PhCI of 264 mmHg-s-cm.2 This higher PCI may be in compensation for higher upper esophageal sphincter pressures, which were also found in their study.2 No significant consistent gender differences were found.
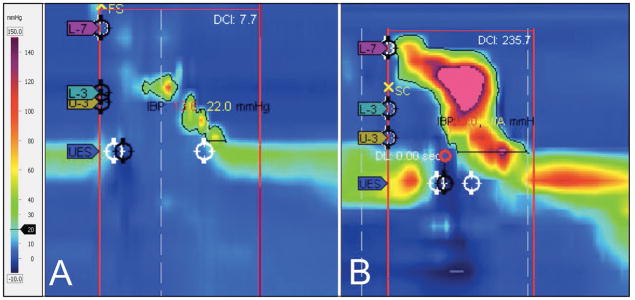
PhCI has the potential to provide an objective representation of pharyngeal muscular function (Fig. 1) that can be related to findings obtained from validated and reliable modified barium swallow study (MBSS) measures known to indicate swallowing impairment. We therefore sought to test the relationship between the PhCI with videofluoroscopic abnormalities as assessed with the Modified Barium Swallow Impairment Profile© (MBSImP™, Northern Speech Services, Gaylord, MI) pharyngeal overall impression (OI) scores in dysphagic individuals.
Figure 1.
Comparison of lower versus higher PhCI pharyngeal swallows. (A) represents an example of poor contractility with a PhCI of 7.7 while (B) represents more robust pharyngeal contraction with a PhCI of 235.7. Visually, it is clear that there is a distinction between the swallows but PhCI allows an objective comparison to be made. (PhCI, Pharyngeal Contractile Integral)
MATERIALS AND METHODS
Patient Selection
We recruited subjects consecutively from patients presenting for MBSS at our outpatient voice and swallowing center. Inclusion criteria included age ≥18 years, complaint of dysphagia, physician order indicating medical necessity for MBSS and appropriate level of cognitive function to participate in the study procedures. Patients with a history of esophagectomy or laryngectomy, known esophageal obstruction, bleeding disorder, allergy to barium or pregnancy were excluded. The Medical University of South Carolina Institutional Review Board approved this study and all participants provided informed written consent.
Equipment and Procedures
We used a solid-state high-resolution catheter (Medtronic, Sunnyvale, CA) that was 2.7mm in diameter with 36 circumferential pressure sensors spaced at 1cm intervals. Prior to each study, the catheter pressure transducers were calibrated from 0 and 300mmHg using externally applied pressure in the pressure chamber. Thermal calibration was completed on each probe according to manufacturer’s specifications.
The most patent nasal cavity was anesthetized and vasoconstricted with oxymetazoline/lidocaine solution applied on a cotton pledget. Care was taken to not oversaturate the pledget to minimize spillage into the pharynx. The catheter was passed through the nasal cavity and introduced into the esophagus while the subject performed sequential water swallows. Placement of the catheter was confirmed by VFS and manometric recordings. Once the catheter was spanning the velopharynx and the upper esophageal sphincter, it was taped in place to the nasal skin. Participants were given time to acclimate to the catheter based on their individual needs. Acclimation was defined as the absence of excessive swallowing or gagging and the ability to easily follow provider instructions. In addition, patients were required to be able to suppress swallowing for a 30 second “landmark” period when baseline measure of upper and lower sphincter pressures are evaluated. If patients were not able to easily complete this task, additional time for acclimation was given. Studies were performed in the seated upright position.
The MBSImP protocol was followed during each MBSS and includes twelve swallows of commercially prepared barium contrast agents in graduated bolus volumes and consistencies (Varibar® E-Z-EM, Bracco Imaging, Melville, NY).3 Each MBSS was recorded at 30 frames per second and synchronized with manometry signals using the Manoscan™ 2.0.1 software program (Metronic, Sunnyvale, CA), which allowed digital capture of the videofluoroscopic feed. The VFS signal was also recorded on the KayPentax Digital Swallowing Workstation™ model 7100 (KayPentax, Lincoln Park, NJ) for offline analysis.
Two independent judges evaluated the swallows for HRPM (AO) and MBS findings (MBSImP and Penetration – Aspiration Scoring) (KH) and were blinded to the alternate modality results during analysis. Inter- and Intra-rater reliability correlations were completed on a subset of the HRPM data (10 subjects; 120 swallows) to ensure reproducibility of PhCI measurements.
Data Analysis
OI scores, representing the worst score across all bolus consistencies and volumes, were calculated for the 10 physiologic components of swallowing included in the pharyngeal domain of the MBSImP. These are: soft palate elevation, laryngeal elevation, anterior hyoid excursion, epiglottic movement, laryngeal vestibular closure, pharyngeal stripping wave, pharyngeal contraction, pharyngoesophageal segment opening, tongue base retraction and pharyngeal residue. Given that PhCI is a representative overview of the entire pharyngeal swallow and there is evidence that the pharyngeal musculature contributes to hyolaryngeal mechanics, we evaluated PhCI against all of the pharyngeal components that are summed to derive the MBSImP Pharyngeal Total (PT).3, 12 Higher PT scores represent greater impairment.
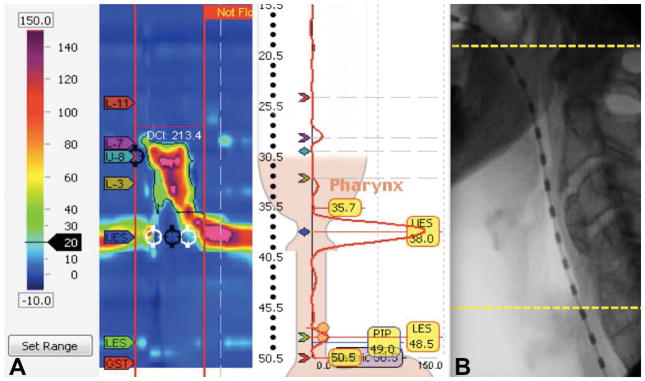
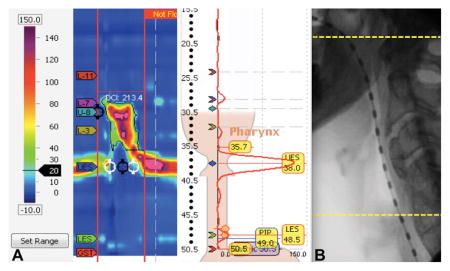
The Manoview 3.0.1 software program (Medtronic, Sunnyvale, CA) was used to calculate the PhCI after the clinician manually identified pertinent landmarks. The lower esophageal sphincter (LES) upper border sensor was used as a surrogate for the upper esophageal sphincter (UES) border, thus allowing the software to calculate a PhCI instead of the pre-programmed DCI (Fig. 2). PhCI is derived by multiplying pharyngeal pressure amplitudes > 20mmHg by the length of the pharynx by the duration in seconds of the contraction. Higher PhCI measurements indicate more robust pharyngeal contractility. A basal threshold of 20mmHg was selected to capture pharyngeal contraction (versus artifact). The length of the pharyngeal contraction was defined as the region between the superior margin of the velopharyngeal contraction to the superior border of the UES pressure band at rest. Although the catheter does move proximally during swallowing, the UES upper border was defined from the resting position. Therefore, the PhCI includes some small degree of contractility measurement of the UES for all patients.
Figure 2.
(A) The Manoview Analysis version 3.0.1 software program automatically calculated the PhCI (labeled here by the software program as DCI: 213.4) when the investigator set the LES upper border sensor (yellow 35.7 label) at the upper border of the UES. (B) Fluorographic representation of the pharyngeal regions included in PhCI from the superior margin of the velopharyngeal contraction (top yellow line) to the superior border of the UES pressure band at rest (bottom yellow line). (PhCI, Pharyngeal Contractile Integral; DCI, Distal Contractile Integral; LES, Lower Esophageal Sphincter; UES, Upper Esophageal Sphincter)
Our primary outcome measures were PhCI and PT. PhCI and PT data were averaged across all bolus volumes and consistencies presented to each patient. Secondary outcomes included UES basal pressure, relaxation nadir pressure, and relaxation duration. In addition, the Penetration Aspiration Scale (PAS) was utilized to evaluate the presence, depth and patient response to airway invasion.4 We utilized the worst PAS score overall (across all consistencies and volumes) as well as within each consistency for data analysis. Statistical analysis was completed using Students T-Test for Independent Means or the Mann Whitney U test if data failed Shapiro-Wilk normality testing. Patients were dichotomized a priori into low PT versus high PT groups and low PhCI versus high PhCI groups based on median values for comparison. In addition, we used the Spearman Correlation to evaluate the relationship between the variables as continuous data. Intra-class correlations (ICC) were completed to evaluate inter- and intra-rater reliability. ICC results are reported with 95% confidence intervals. SPSS Statistics Version 24 software was used for calculations. Significance was accepted as p ≤ 0.05.
To ensure that PhCI was comparable across individuals, we calculated a “normalized” PhCI by dividing each subject’s average PhCI by his or her pharyngeal length. Pharyngeal length was defined as the distance from the anterior superior edge of the first cervical (C1) vertebra to the anterior superior edge of the fifth cervical (C5) vertebra. These landmarks were selected because they are constant and were readily identifiable for all subjects. Use of these landmarks also avoids the inherit problem of using the pharyngeal contractile length as recorded on HRPM, which can vary based on an individual’s potential contractile deficits. Image J software (National Institute of Health, https://imagej.nih.gov) was used to complete the anatomical length measurements with a penny placed on the patient’s neck establishing an accurate scale.
RESULTS
Thirty-six patients were included in the study, 21 females and 15 males with a mean age of 59.3 years (range 18–86). Primary presenting diagnoses included pulmonary disease (N=10), esophageal pathology (N=9), cervical spine surgery (N=6), cricopharyngeal dysfunction (N=5), radiation induced fibrosis (N=2) and one patient each with stroke, meningioma, neurosarcoidosis and unknown etiology of dysphagia. Esophageal pathology included esophageal dysmotility (4 patients), gastroesophageal reflux disease (3 patients), esophageal spasm (1 patient), and non-obstructive esophageal web (1 patient).
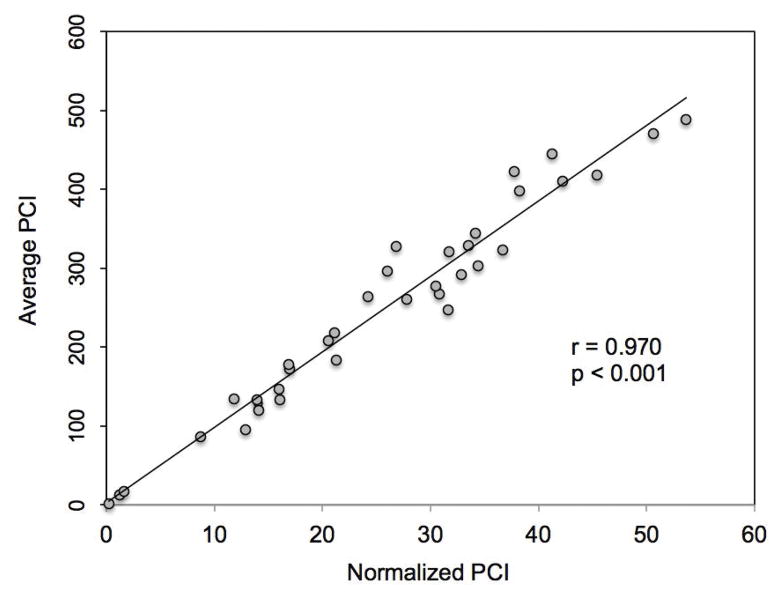
The average pharyngeal length in our subjects was 9.7 cm (range 7.4–12.2). Normalized PhCI was tightly correlated with the original average PhCI value, suggesting that pharyngeal length is fairly constant over the range of observed PhCI (r=0.97, p<0.0001) (Fig. 3). Concordance between PhCI measures was high for both inter-rater (0.978; 0.749 – 0.996) and intra-rater (0.999; 0.995 – 1.000) assessments.
Figure 3.
Comparison of normalized PhCI to original average PhCI. PhCI was “normalized” by dividing average PhCI by pharyngeal length. This normalized PhCI was very highly correlated to the original average PhCI calculated automatically by the software program (p < 0.001). (PhCI, Pharyngeal Contractile Integral)
The overall mean PhCI was 247 mmHg-sec-cm (range 1.9–488.4mmHg-s-cm) across all bolus volumes and consistencies. Low versus high PhCI groups were dichotomized based on the median score of 263 mmHg-s-cm. The low PhCI group (n=19) had an average PhCI of 137.7 mmHg-s-cm. The high PhCI group (n=17) had an average PhCI of 356 mmHg-s-cm. The average age of the lower PhCI group was 56.5 years compared to 62.1 years in the higher PhCI group.
The overall mean PT score was 8.1 (range 0–24) across all bolus volumes and consistencies. Low versus high PT groups were dichotomized based on the median score of 7. The low PT group (N=20) had an average PT score of 3.9. The high PT group had an average score of 12.7. The average age of the lower PT group was 55.8 years compared to 63.0 years in the higher PT group.
Significant differences in PhCI were seen when comparing patients with lower versus higher PT scores (p=0.01). The low PT group had a mean PhCI of 299 mmHg-s-cm while the higher PT group had a mean PhCI score of 188 mmHg-s-cm (p=0.01). When evaluated as continuous variables, there was a significant negative correlation between normalized PhCI and PT (r=−0.47, p=0.004) (Fig 4). These results were similar to the comparison of non-normalized PhCI versus PT scores (r=−0.44, p=0.01).
Figure 4.
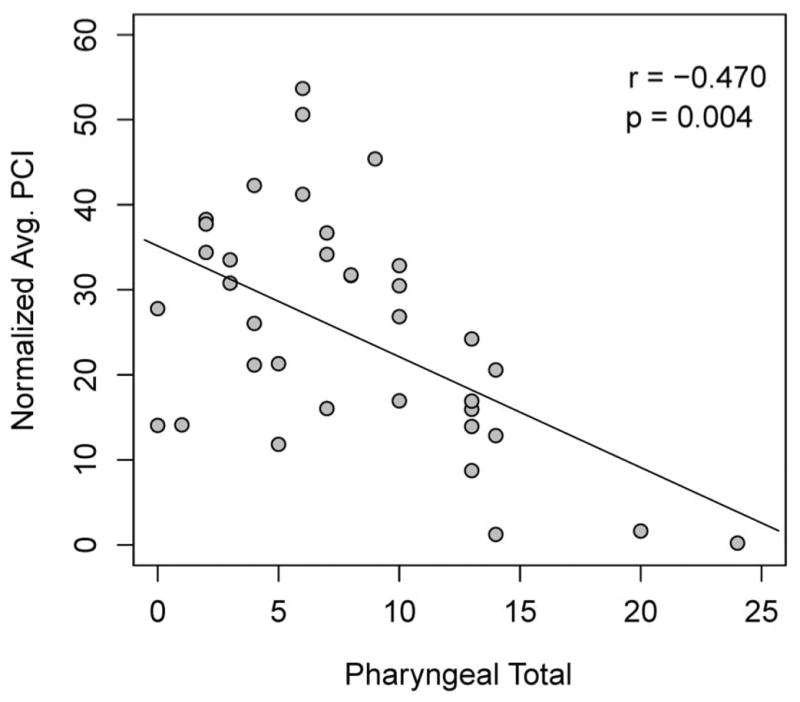
The relationship between normalized PhCI and PT scores. Spearman Correlation revealed a significant negative correlation between these variables, indicating that as pharyngeal total increased (became more impaired) pharyngeal contractility decreased. These results were similar to comparisons of non-normalized PhCI versus PT scores (r = −0.440, p = 0.010). (PhCI, Pharyngeal Contractile Integral; PT, Pharyngeal Total)
PhCI increased with bolus viscosity but there was a significant difference only between PhCI for thin liquids as compared to pudding (223 vs. 300 mmHg-s-cm; p=0.01). When comparing viscosity data between low versus high PT groups, there was a significant difference between the groups for thin (p=0.02), nectar (p=0.01), pudding (p=0.04), and solid (p=0.05) consistencies. There was no difference for honey consistency (p=0.33).
Basal UES pressure was slightly lower in the low PhCI grouping (34 versus 40 mmHg), but this finding was not significant (p=0.36). In addition, relaxation pressure and duration were not different between PhCI groups (Table 1). We found a significant difference in overall PAS scores between patients in the high versus low PhCI groups. Patients with better contractility exhibited less severe PAS scores (1.21 versus 1.99; p=0.03) (Table 2).
Table I.
Comparison of UES parameters in patients with lower versus higher PhCI.
| Basal Pressure (mmHg) | Relaxation Pressure (mmHg) | Relaxation Duration (ms) | |
|---|---|---|---|
| Low PhCI Group | 34 | −0.5 | 467 |
| High PhCI Group | 40 | 1.0 | 512 |
| p value | 0.36 | 0.54 | 0.33 |
PhCI, Pharyngeal Contractile Integral
Table II.
Comparison of PAS scores in patients with lower versus higher PhCI.
| Overall | Thin | Nectar | Honey | Pudding | Solid | |
|---|---|---|---|---|---|---|
| Higher PhCI Group | 1.21 | 1.44 | 1.28 | 1.11 | 1.11 | 1.11 |
| Lower PhCI Group | 1.99 | 3.78 | 2.29 | 1.27 | 1.00 | 1.07 |
| p value | 0.03 | 0.01 | 0.06 | 0.05 | 0.80 | 0.97 |
PAS, Penetration Aspiration Scale; PhCI, Pharyngeal Contractile Integral
Further analysis by specific consistency showed a significant difference for thin liquids, with the higher PhCI group having an average 1.44 PAS versus 3.78 PAS in the lower PhCI group (p=0.03). There was also a difference with honey consistency between the groups (p=0.05). While nectar trended towards differences in PAS scores between the groups, this was not significant (p=0.06) and there was no difference in PAS scores between PhCI groups with pudding (p=0.80) and solid (p=0.97) consistencies. When evaluated as continuous data, there was a significant negative correlation between normalized PhCI and PAS (r=−0.41; p=0.01) (Fig. 5). Although the negative correlation persisted, these results were somewhat different from non-normalized PhCI versus PAS scores (r=−0.27, p=0.11).
Figure 5.
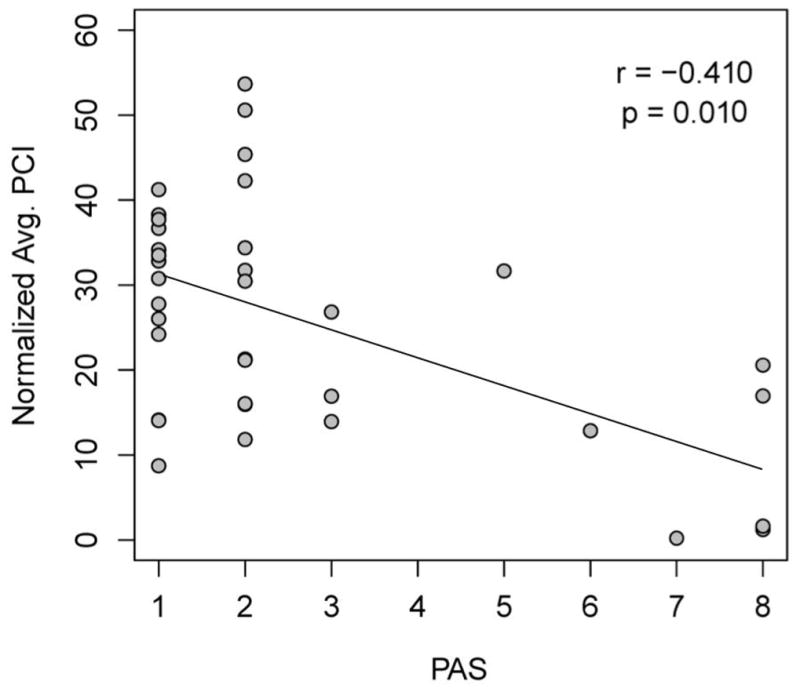
The relationship between normalized PhCI and PAS Scores. Spearman Correlation revealed a significant negative correlation between these variables (r = −0.410, p = 0.010). These results were somewhat different from non-normalized PhCI versus PAS scores (r = −0.270, p = 0.110). (PhCI, Pharyngeal Contractile Integral; PAS, Penetration Aspiration Scale)
DISCUSSION
Other investigators have examined objective HRPM parameters and their relationship to deficits observed on MBSS and/or clinical interpretation of pharyngeal dysphagia.5–9 Park et al. showed that the majority of isolated, individual HRM pharyngeal parameters (e.g. maximal pressure of the tongue base and “low pharynx,” minimal UES pressure, duration of tongue base contraction) were not predictive of deficits seen on MBSS.5 In their study, only maximum pressure of the velopharynx was predictive of aspiration but this parameter gives limited information regarding mid to lower pharyngeal swallowing function and physiology. Ryu et al. detailed the precise timing of pressure events using HRPM during pharyngeal swallowing but these analyses are labor intensive and as such, have not been translated to clinical practice.6 Therefore, discrete manometric measurements of isolated pharyngeal regions are not likely to have widespread clinical utility to assist in quantifying overall pharyngeal physiology and related function.
The DCI is a well-characterized esophageal HRM parameter that revolutionized the classification of esophageal motility disorders.1 Despite the widespread clinical application of DCI, pharyngeal integrals have not been well-tested or translated to clinical practice. Some investigators have previously described contractile integrals related to the pharynx, however these studies were limited to pressure measures in multiple pharyngeal regions and require specialized software programs unique to the clinical laboratory.10 We believe that evaluating the entire pharynx as a continuum of interrelated temporal events is clinically meaningful as it takes into account velopharyngeal, tongue base and pharyngeal stripping wave pressures. Of course, as other authors have suggested2, while PhCI serves as an overview of pharyngeal swallowing pressure generation the clinician should further investigate individual regions of interest (e.g. tongue base area) to further identity deficits when abnormalities exist.
In the current pilot study, we demonstrate the association of physiologic swallowing impairment on MBSS and PhCI calculated from HRPM recordings. In addition, because our definition of PhCI includes the entire pharyngeal swallowing region, it also has potential for identifying and facilitating pharyngeal adaptation mechanisms to improve swallowing function in dysphagic patients.
Hoffman et al. utilized artificial neural network analyses to correlate certain pattern recognition profiles of HRPM data with deficits in pharyngeal swallowing seen on MBSS.9 They found that HRPM data was able to identify swallowing abnormalities that correlated with impairments noted on MBSS. Likewise, our study showed that patients in the low PhCI group had significantly worse PT scores indicating greater swallowing impairment. Additionally, individuals in the low PhCI group were more likely to aspirate or penetrate liquid consistencies. The strong negative correlation found between PAS and normalized PhCI implies that individuals with lower PhCI scores may have the potential for a greater risk for airway invasion during swallowing. We did not see a difference in PAS scores between high and low PhCI groups with pudding or solid consistencies. This is likely due to decreased risk of aspiration with more viscous boluses and the significant difference seen with thin liquid PAS scores between groups is arguably a more clinically relevant finding.
PhCI tended to increase slightly with viscosity and a significant difference was found between the PhCI for thin liquid versus pudding swallows. On the contrary, Yoon et al. found higher pharyngeal contractility for water swallows in asymptomatic volunteers whereas Ryu et al. found no difference in pharyngeal pressures (such as maximum velopharyngeal, tongue base or low pharynx pressures) between bolus consistency variations (liquid, yogurt and bread) in 10 healthy subjects.6,10 These discordant results may be explained in part by differences in patient groups and methodology.
We found no correlation between PhCI and UES parameters such as basal pressure, relaxation pressure, and opening duration on HRPM. This is an interesting finding because much of the literature regarding HRPM has focused on UES parameters. Our findings suggest that, while important, UES parameters alone may not serve as valid surrogates for pharyngeal swallowing physiology because pharyngeal contractility is not the sole determinant of UES function. Adequate UES opening is accomplished by a combination of cricopharyngeal muscle relaxation, anterior-superior movement of the hyoid and larynx, shortening of pharyngeal elevator muscles and bolus pressure forces.11,12
One critique of automated PhCI measurement may be the possible contribution of intrabolus pressure (IBP) to PhCI measurement. Walczak et al., evaluated pharyngeal pressures during bolus transit and found that the average mid-bolus pressure in the tongue base region in normal individuals was 25.82 mmHg (+/− 10.13). The average mid-bolus pressure in the hypopharyngeal region was much lower at 3.14 (+/− 1.36). 13 Given the range of approximately 15 – 35 mmHg for the highest region of mid-bolus pressure, we felt that a benchmark of 20 mmHg was appropriate and likely any pressures below that were not significant contributors to PhCI. The authors acknowledge that pharyngeal IBP could be increased in settings of outflow obstruction, such as seen in cricopharyngeal dysfunction. As such, PhCI should be evaluated in the context of UES parameters and not in isolation. A limitation of our study is that we did not measure the contribution of IBP within the regions defined by PhCI. Before widespread use of this potentially valuable parameter, more sophisticated software analysis methods need to be developed that may better account for these confounding factors. Until such software is clinically available, perhaps a higher basal threshold should be used (e.g. 30mm Hg) to account for IBP.
These preliminary data support the potential utility for incorporation of HRPM into laryngology and speech-language pathology practices to aid in assessment of pharyngeal swallowing and to identify physiologic targets for behavioral or surgical interventions. In this study, we describe a clinically practical HRPM parameter, the PhCI, which provides an objective measure of pharyngeal function. The process of calculating the PhCI based on readily identifiable landmarks assists in both reproducibility and efficiency of use.
Our normalized PhCI data were highly correlated with the original average PhCI values, which would suggest that it may not be necessary to measure the pharynx to account for differences in pharyngeal length when completing HRPM. However, there was some difference between results of PAS in comparison to PhCI when comparing normalized versus non-normalized PhCI data. The negative trend persisted, but the non-normalized data was not significant (p=0.11). This may be a function of our smaller sample size and should be evaluated further.
The normative age related PhCI differences suggested by Nativ et al. are interesting as they apply to our study.2 For categorical data analysis we dichotomized patients into low PhCI versus high PhCI groups based on median values. The median value of PhCI in our cohort was 263 mmHg-s-cm. This was similar to normative data from Nativ et al. that revealed young healthy subjects (age ≤ 40) had an average PhCI of 264 mmHg-s-cm.2 In addition, it is difficult to know if future PhCI calculations should be adjusted for age and more investigation is needed in this area. In our study, more impaired individuals (higher PT score) had a greater average age (63.0 years) than the less impaired group (53.8 years) so one could suppose that their PhCI could be falsely elevated. Our finding that PhCI remained significantly lower in this older cohort suggests that the differences may actually be greater than identified in our study.
This study does not advocate that HRPM is a replacement for other instrumental evaluations, such as MBSS or flexible endoscopic evaluation of swallowing. However, an integral such as the PhCI has the advantage of evaluating pharyngeal contractility in a multi-dimensional manner. It could be utilized as an indicator of the degree of swallowing impairment and the need for further diagnostic evaluation, but may not be an adequate tool to capture or describe the specific nature of swallowing physiology that is necessary to develop targeted treatment strategies. HRPM could additionally serve as an objective outcome measure of improvement, allowing the clinician to quantify improvement or efficacy of targeted interventions. Anecdotally, we have also found HRPM to be therapeutically helpful in providing biofeedback to patients with pharyngeal sensory deficits, such as those following anterior approach cervical spine surgery.
There are limitations to our study design. We did not include a normal control group, but rather evaluated PhCI in dysphagic individuals to become better informed about pharyngeal pressures and determine how useful PhCI may be in differentiating severity of swallowing function. Additional limitations also include a small sample size and the heterogeneity of dysphagia etiology in our subjects.
Preliminary data suggest that PhCI may be a useful indicator of the presence of pharyngeal swallowing impairment. Lower PhCI scores correlated with higher degrees of impairment and increased risk for aspiration or penetration. PhCI is technically simple to calculate with currently available software programs. Further study is needed to validate the clinical utility of this parameter. However, HRPM has the potential to be a valuable adjunct procedure for the dysphagia clinician in the evaluation and treatment of dysphagic individuals.
KEY POINTS.
A limitation to the expanded use of high-resolution pharyngeal manometry in clinical practice is the lack of useful pharyngeal parameters that are easy to interpret and do not require specialized software. In this study we sought to test the relationship between a clinically practical high-resolution pharyngeal manometry parameter, the pharyngeal contractile integral, with videofluoroscopic observations.
Lower pharyngeal contractile integral scores correlated with higher degrees of impairment and increased risk for aspiration or penetration. Concordance between pharyngeal contractile integral measures was high for both inter-rater and intra-rater assessments.
These preliminary data support the potential utility for incorporation of high-resolution pharyngeal manometry to aid in assessment of pharyngeal swallowing and to identify physiologic targets for behavioral or surgical interventions.
Acknowledgments
FUNDING AND DISCLOSURES
AK and KH performed the research; AK, KH and AL analyzed the data; AK, KH and BMH wrote the paper. This work was supported by a grant from the National Institutes of Health (1K24DC12801 to BMH) and a one-time equipment grant provided by Given Imaging (Covidien Inc.). AK and KH are consultants and continuing education speakers for Covidien Inc.
References
- 1.Bredenoord AJ, Fox M, Kahrilas PJ, Pandolfino JE, Schwizer W, Smout AJ International High Resolution Manometry Working Group. Chicago classification criteria of esophageal motility disorders defined in high resolution esophageal pressure topography. Neurogastroenterol Motil. 2012;1:57–65. doi: 10.1111/j.1365-2982.2011.01834.x. [DOI] [PMC free article] [PubMed] [Google Scholar]
- 2.Nativ-Zeltzer N, Logemann JA, Zecker SG, Kahrilas PJ. Pressure topography metrics for high-resolution pharyngeal-esophageal manofluorography – a normative study of younger and older adults. Neurogastroenterol Motil. 2016;28:721–731. doi: 10.1111/nmo.12769. [DOI] [PMC free article] [PubMed] [Google Scholar]
- 3.Martin-Harris B, Brodsky MB, Michel Y, et al. MBS measurement tool for swallow impairment—MBSImp: establishing a standard. Dysphagia. 2008;23(4):392–405. doi: 10.1007/s00455-008-9185-9. [DOI] [PMC free article] [PubMed] [Google Scholar]
- 4.Rosenbek JC, Robbins J, Roecker EV, Coyle JL, Woods JL. A Penetration-Aspiration Scale. Dysphagia. 1996;11:93–98. doi: 10.1007/BF00417897. [DOI] [PubMed] [Google Scholar]
- 5.Park D, Oh Y, Ryu JS. Findings of abnormal videofluoroscopic swallowing study identified by high-resolution manometry parameters. Arch Phys Med Rehabil. 2016;97(3):421–8. doi: 10.1016/j.apmr.2015.10.084. [DOI] [PubMed] [Google Scholar]
- 6.Ryu JS, Park D, Kang JY. Application and interpretation of high-resolution manometry for pharyngeal dysphagia. J Neurogastroenterol Motil. 2015;21(2):283–7. doi: 10.5056/15009. [DOI] [PMC free article] [PubMed] [Google Scholar]
- 7.Ryu JS, Park D, Oh Y, Lee ST, Kang JY. The effects of bolus volume and texture on pharyngeal pressure events using high-resolution manometry and its comparison with videofluoroscopic swallowing study. J Neurogastroenterol Motil. 2016;22(2):231–9. doi: 10.5056/jnm15095. [DOI] [PMC free article] [PubMed] [Google Scholar]
- 8.Matsubara K, Kumai Y, Samejima Y, Yumoto E. Swallowing pressure and pressure profiles in young healthy adults. Laryngoscope. 2014;124(3):711–7. doi: 10.1002/lary.24311. [DOI] [PubMed] [Google Scholar]
- 9.Hoffman MR, Jones CA, Geng Z, et al. Classification of high-resolution manometry data according to videofluoroscopic parameters using pattern recognition. Otolaryngol Head Neck Surg. 2013;149(1):126–33. doi: 10.1177/0194599813489506. [DOI] [PMC free article] [PubMed] [Google Scholar]
- 10.Yoon KJ, Park JH, Park JH, Jung IS. Videofluoroscopic and manometric evaluation of pharyngeal and upper esophageal sphincter function during swallowing. J Neurogastroenterol Motil. 2014;20(3):352–61. doi: 10.5056/jnm14021. [DOI] [PMC free article] [PubMed] [Google Scholar]
- 11.Cook IJ, Dodds WJ, Dantas RO, et al. Opening mechanisms of the human upper esophageal sphincter. The American journal of physiology. 1989;257(5):G748–59. doi: 10.1152/ajpgi.1989.257.5.G748. [DOI] [PubMed] [Google Scholar]
- 12.Pearson WG, Langmore SE, Yu LB, Zumwalt AC. Structural analysis of muscles elevating the hyolaryngeal complex. Dysphagia. 2012;27(4):445–51. doi: 10.1007/s00455-011-9392-7. [DOI] [PMC free article] [PubMed] [Google Scholar]
- 13.Walczak CC, Jones CA, McCulloch TM. Pharyngeal Pressure and Timing During Bolus Transit. Dysphagia. 2017;32:104–14. doi: 10.1007/s00455-016-9743-5. [DOI] [PMC free article] [PubMed] [Google Scholar]


