

Abstract
Deformable image registration (DIR) and interobserver variation inevitably introduce uncertainty into the treatment planning process. The purpose of the current work was to measure deformable image registration (DIR) errors and interobserver variability for regions of interest (ROIs) in the head and neck and pelvic regions. Measured uncertainties were combined to examine planning margin adequacy for contours propagated for adaptive therapy and to assess the trade‐off of DIR and interobserver uncertainty in atlas‐based automatic segmentation. Two experienced dosimetrists retrospectively contoured brainstem, spinal cord, anterior oral cavity, larynx, right and left parotids, optic nerves, and eyes on the planning CT () and attenuation‐correction CT of diagnostic PET/CT () for 30 patients who received radiation therapy for head and neck cancer. Two senior radiation oncology residents retrospectively contoured prostate, bladder, and rectum on the postseed‐implant CT () and planning CT () for 20 patients who received radiation therapy for prostate cancer. Interobserver variation was measured by calculating mean Hausdorff distances between the two observers' contours. was deformably registered to via commercially available multipass B‐spline DIR. contours were propagated and compared with contours via mean Hausdorff distances. These values were summed in quadrature with interobserver variation for margin analysis and compared with interobserver variation for statistical significance using two‐tailed t‐tests for independent samples (). Combined uncertainty ranged from 1.5‐5.8 mm for head and neck structures and 3.1‐3.7 mm for pelvic structures. Conventional 5 mm margins may not be adequate to cover this additional uncertainty. DIR uncertainty was significantly less than interobserver variation for four head and neck and one pelvic ROI. DIR uncertainty was not significantly different than interobserver variation for four head and neck and one pelvic ROI. DIR uncertainty was significantly greater than interobserver variation for two head and neck and one pelvic ROI. The introduction of DIR errors may offset any reduction in interobserver variation by using atlas‐based automatic segmentation.
PACS number(s): 87.57.nj, 87.55.D‐
Keywords: interobserver variation, deformable image registration, B‐spline, contour propagation
I. INTRODUCTION
Deformable image registration (DIR) is increasingly being incorporated into radiation therapy. Applications include multimodality image registration, (1) atlas‐based automatic segmentation, (2) dose summation, (3) and contour propagation for online, 4 , 5 and offline 4 , 6 adaptive radiation therapy. Unlike conventional “rigid” registration, DIR does not assume spatial invariance between all voxels of both image sets. By using complex mathematical models, such as optical flow 7 , 8 or B‐splines, 2 , 9 DIR stretches one image set to match another at a local (often voxel‐by‐voxel) level. This is useful in anatomical regions that have many degrees of freedom, such as the neck, or that are prone to change over time. Such changes could occur in daily cycles (e.g., the bladder or rectum) or progressively over the course of treatment (e.g., soft tissue in the head and neck that change with weight loss).
In radiation therapy planning, DIR is often applied to two CT image sets. The first CT is usually the CT “simulation” acquired in the treatment position. The second CT could be a diagnostic or prior simulation CT. Deformable image registration between CTs can sometimes be useful in itself (diagnostic CT with intravenous contrast, for example), but when the second CT is DICOM‐linked to secondary data, such as the PET portion of a PET/CT or a prior treatment plan, data can be transformed with the deformation vector field just like the CT to which they are linked. This process enables contour propagation from one CT to another. Clinically, physician‐drawn contours are often propagated from simulation CT to cone‐beam CT or resimulation CT to adapt treatment (6) or from a multipatient CT “atlas” for automatic segmentation. (2) For atlas‐based automatic segmentation, CTs and their associated clinical contours are added to the CT atlas. When a new patient is to be segmented automatically, the algorithm searches the atlas for a CT which best matches the clinical CT, DIR is performed, and atlas contours are propagated to the new CT.
Studies have assessed the accuracy of DIR algorithms using digital phantoms, (10) physically deforming phantoms, (11) mathematical descriptors, 12 , 13 and clinical CT scans. 14 , 15 , 16 Digital (10) or physically deforming phantom studies, (11) while useful, may lack clinical complexity. Mathematical descriptors, such as curl and the Jacobian, have been proposed as useful metrics to quantify the deformation vector field. 12 , 13 Though such descriptors could be beneficial in the future, they are untested clinically and lack intuitive clinical meaning. Landmark‐based quality assurance from clinical CT currently represents the most robust quantification of DIR accuracy. Castillo et al. (14) demonstrate the efficacy of landmark pairs to assess DIR quality in thoracic CT imaging and suggest the technique could be used for routine DIR quality assurance. In a large multi‐institutional study, Brock et al. (16) measure DIR error for intra‐ and intermodality DIR using landmarks and found DIR errors on the order of voxel size.
Though much attention has been justifiably focused on DIR accuracy, the influence of interobserver variation on DIR uncertainty in regard to landmark identification is nonnegligible. (17) The same may be true for contour propagation in adaptive therapy or atlas‐based automatic segmentation. For adaptive therapy, where contour propagation is used to reduce the contouring burden on the physician and dosimetrist, propagated volumes would presumably include uncertainties associated with both DIR and interobserver contouring variability. Currently, neither is commonly included in planning target volume (PTV) or planning organ‐at‐risk volume (PRV) margins. For atlas‐based automatic segmentation where the use of DIR has been reported to reduce interoberver contouring variation, (18) the trade‐off between this benefit and the uncertainty introduced by DIR error has not been quantified.
The purpose of the current work was to evaluate the influence of interobserver variation in contours propagated by deformable image registration. Two analyses were performed. First, the uncertainties associated with interobserver variation and DIR were measured for normal tissue contours in a sample of patients in two anatomical sites and a potential margin expansion was evaluated; second, the magnitude of DIR uncertainty was compared with interobserver variation.
II. MATERIALS AND METHODS
Thirty (30) head and neck and 20 prostate cancer patients who received radiation therapy at our institution were retrospectively included in the study. Site‐specific methodology is described in the next sections.
A. Head and neck
Head‐and‐neck patients were retrospectively included if CT simulation was accompanied by diagnostic PET/CT used for treatment planning. Per our standard clinical CT simulation protocol, patients were immobilized using five‐point thermoplastic masks (Orfit Industries, Wijnegem, Belgium) and scanned with the Philips Brilliance Big Bore CT scanner (Philips Medical Systems, Milpitas, CA). Simulation CT scans employed helical acquisition, 120 kVp, 3 mm slice thickness, and 65–70 cm reconstructed field of view. Images were reconstructed using filtered back‐projection. PET/CT scanning was performed within the institution for 18 of 30 patients with 120 kVp, 3.75 mm slice thickness, and 50 cm reconstructed field of view. The remaining scans were acquired from outside institutions with tube voltages between 120–140 kVp, slice thicknesses ranging from 3–5 mm, and reconstructed fields of view ranging from 244 cm to 700 cm. All CT scans utilized automatically modulated tube current and 512 by 512 image matrices. No immobilization was used for any diagnostic PET/CT scan and a curved tabletop was utilized for all patients.
Two dosimetrists with substantial head and neck planning experience were asked to independently contour brainstem, spinal cord, anterior oral cavity, larynx, right and left parotids, right and left optic nerves, and right and left eyes on the simulation CT scan (). Anterior oral cavity was defined as the region splitting the base of tongue between the hard palate and glossopharyngeal sulcus. Larynx was defined as the superior edge of the epiglottis to inferior edge of the cricoid cartilage. Spinal cord was defined from the inferior edge of the brainstem to the superior edge of sternum.
After one month (to reduce memory bias), both dosimetrists contoured the same regions of interest (ROI) on the CT portion of the diagnostic PET/CT scan (). One iteration of mutual information‐based rigid registration and multipass B‐spline DIR was used to register to . Contouring and DIR was performed in Velocity software version 3.0.0 (Varian Medical Systems, Atlanta, GA). The CT portion of the PET/CT scan was used in this study because PET/CT‐to‐CT‐simulation represents the majority of DIR in our department and presents a challenging anatomical match due to lack of immobilization on the PET/CT.
B. Prostate
Prostate patients were retrospectively included if CT simulation for external beam and postimplant CT for prostate seed implant was performed. Simulation CT was acquired via helical acquisition with 140 kVp, 3 mm slice thickness, and 60 cm field of view. Postimplant CT was performed three to four weeks after implantation and was acquired via helical acquisition, 120 kVp, 3 mm slice thickness, and 20 cm field of view. All CT scans utilized automatically modulated tube current, filtered back‐projection reconstruction, 512 by 512 image matrices, and flat table tops.
Two senior radiation oncology residents were asked to independently contour prostate, rectum, and bladder on the postimplant CT scan (). Rectum was defined as 1 cm above and below the prostate.
One month later (to reduce memory bias), the residents contoured the same ROIs on the external beam simulation CT (). The same deformable technique described above was used to register to . If excessive bladder/rectum filling caused visibly misregistered contours after one iteration of DIR, an additional iteration was performed by reducing the DIR region to focus on the bladder and/or rectum. Postimplant CT was used in this study because registration of postimplant CT to external beam CT simulation may facilitate composite external beam and brachytherapy dose summation. (19)
C. Analysis
Regions of interest were generically termed where the first subscript signifies the dosimetrist (1 or 2) and the second subscript signifies the image set ( or ). and were transformed via the DIR vector field to , resulting in and . The variation between the observers' contours on ( vs. ) was the interobserver variation (). The variation between the original contours and the deformed contours ( vs. and vs. ) was termed the total measured variation ().
If DIR worked perfectly and the observers were able to replicate the ROIs exactly on and , the variation between and should be zero. In practice, contained two components: Error associated with the DIR technique () and intraobserver variation () because each ROI was drawn once on and again on . could not be explicitly measured for all patients due to time limitations of the participants. Instead, all observers recontoured the same ROIs on for five patients approximately one month after contour completion. These ROIs were termed and and were compared to and , respectively, to determine m. Table 1 summarizes the quantities and their definitions, and Fig. 1 schematically represents the relationships between them.
Table 1.
Contour names, measured quantities, and definitions.
| Quantity | Definition | |
|---|---|---|
|
|
Structures contoured by observer i on image set j | |
|
|
Structures contoured by observer i deformed from to | |
|
|
Structures recontoured by observer i on | |
|
|
Interobserver variation: deviation between observer 1 and observer 2 contours on | |
|
|
Intraobserver variation: deviation between observer i original contours and observer i recontours on | |
|
|
Total variation: deviation between observer i contours and deformed observer i contours on ; contains both intraobserver variation and residual deformable registration errors | |
|
|
Residual deformable registration error: intraobserver variation subtracted in quadrature from total variation | |
|
|
Residual deformable registration error after second iteration of deformable registration |
Figure 1.
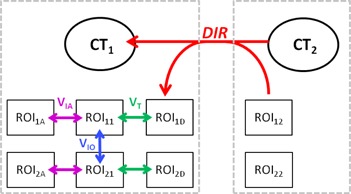
Schematic representation of the relationships between regions of interest (ROIs). ROIs on the left and right are contoured on and , respectively. represents structures contoured by observer i on image set j. and are deformed via the DIR vector field to form and . is the total variation between the original contours ( and ) and deformed contours ( and ). is the interobserver variation measured between contours drawn on by both observers. is the intraobserver variation measured between contours drawn on for each observer.
An adaptation of the three‐dimensional Hausdorff distance, the mean variation between two surfaces, described by Varadhan et al., (20) was used to quantify , and for each ROI. The Hausdorff calculation was performed for each point in the primary ROI against all points in the secondary ROI to determine the closest distance between the two surfaces in three dimensions. The mean distance over all points was calculated to represent the average variation between the two surfaces. The calculation was performed with a built‐in function in the Velocity software.
Interobserver variation () was calculated and averaged over all patients for each ROI. Total variation () was calculated and averaged over all patients for each ROI for each observer. The sample size of was thus twice the sample size of as two observers are required to calculate . Intraobserver variation () was averaged over the five randomly chosen patients described above for each ROI in each anatomical site. Because we measured for a sample of patients and not each patient individually, a linear sum of and uncertainties could not be assumed. Instead, we assumed would be less than , 21 , 22 and and behaved like population‐based margins and were summed in quadrature, (23) and could be calculated using the following equation:
| (1) |
To estimate the margin expansion required to account for both interobserver variation and DIR, we summed the average and in quadrature for each region of interest. We used Student's t‐tests for independent samples () to compare means of and distributions for statistical significance for each ROI.
III. RESULTS
A. Head and neck
All 10 ROIs were contoured for 27 of 30 patients. The larynx and left parotid were not contoured due to surgical removal before radiation therapy for one patient each. The left parotid was not contoured due to proximity to the primary tumor for one patient. Table 2 displays means and standard deviations of , , and for 10 ROIs. Intraobserver variation was less than interobserver variation for all structures. Table 3 shows the quadrature sum of and for potential margin expansion for each ROI. There was notable variation in the combined uncertainty for the head and neck ROIs, ranging from 1.5 mm for the eyes to 5.8 mm for the anterior oral cavity.
Table 2.
Total variation (), intraobserver variation (), residual deformation errors (), and interobserver variation () for head and neck anatomy.
| Total Variation | Intraobserver Variation | Residual Deformable Registration Errors | Interobserver Variation | |||||||||
|---|---|---|---|---|---|---|---|---|---|---|---|---|
| Structure | N |
|
|
|
|
|||||||
| Anterior Oral Cavity | 60 |
|
10 |
|
60 |
|
30 |
|
||||
| Brainstem | 60 |
|
10 |
|
60 |
|
30 |
|
||||
| Cord | 60 |
|
10 |
|
60 |
|
30 |
|
||||
| Left Eye | 60 |
|
10 |
|
60 |
|
30 |
|
||||
| Right Eye | 60 |
|
10 |
|
60 |
|
30 |
|
||||
| Larynx | 58 |
|
10 |
|
58 |
|
29 |
|
||||
| Left Optic Nerve | 60 |
|
10 |
|
60 |
|
30 |
|
||||
| Right Optic Nerve | 60 |
|
10 |
|
60 |
|
30 |
|
||||
| Left Parotid | 56 |
|
10 |
|
56 |
|
28 |
|
||||
| Right Parotid | 60 |
|
10 |
|
60 |
|
30 |
|
||||
N = represents the number of contours analyzed.
Table 3.
Quadrature sum of residual deformation errors () and interobserver variation () for all regions of interest.
| Structure | Potential Expansion (mm) |
|---|---|
| Anterior Oral Cavity | 5.8 |
| Brainstem | 2.6 |
| Cord | 1.9 |
| Left Eye | 1.5 |
| Right Eye | 1.5 |
| Larynx | 3.2 |
| Left Optic Nerve | 2.6 |
| Right Optic Nerve | 2.8 |
| Left Parotid | 2.6 |
| Right Parotid | 2.8 |
| Prostate | 3.7 |
| Bladder | 3.1 |
| Rectum | 3.6 |
Figure 2 compares interobserver variation () and residual DIR errors (). Error bars represent 1 SD. was significantly less than for the anterior oral cavity, spinal cord, larynx, and left parotid. was not significantly different than for the brainstem, right parotid, left and right optic nerves. was significantly greater than for the left and right eyes, but the difference was less than 0.5 mm. Left parotid contours for one patient are shown in Fig. 3(a) (axial) and 3(b) (coronal) for comparison.
Figure 2.

Comparison of interobserver variation and deformable image registration (DIR) error for head and neck regions of interest. Values represent the mean Hausdorff distance calculated between the two surfaces for all patients. Error bars represent 1 SD.
Figure 3.
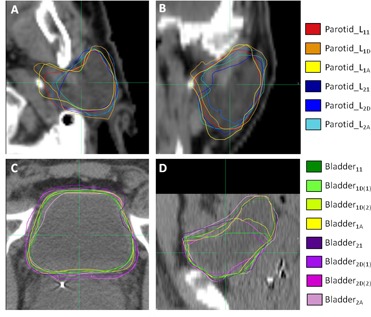
Axial (a) and coronal (b) slices of left parotid contours for one patient. Axial (c) and sagittal (d) slices of bladder contours for one patient. Subscripts follow the definition in the text. Note the bladder has two deformed contours to represent the first and second pass of the deformable image registration algorithm.
B. Prostate
All three ROIs were contoured for all 20 patients. Table 4 shows means and standard deviations of , and for three ROIs. Bladder and rectum have an additional comparison () for the additional pass of the DIR algorithm (seven and four patients, respectively). Table 3 shows the quadrature sum of and or (if applicable) for potential margin expansion. The combined uncertainty for prostate yielded a narrower range than head and neck; bladder demonstrated combined uncertainty of 3.1 mm and rectum yielded 3.7 mm.
Table 4.
Total variation (), intraobserver variation (), residual deformation errors ( & ), and interobserver variation () for male pelvic anatomy.
| Total Variation | Intraobserver Variation | Residual Deformable Registration Errors |
Residual Deformable Registration Errors (
|
Interobserver Variation | |||||||||||
|---|---|---|---|---|---|---|---|---|---|---|---|---|---|---|---|
| Structure | N |
|
N |
|
N |
|
N |
|
N |
|
|||||
| Prostate | 40 |
|
10 |
|
40 |
|
0 | 20 |
|
||||||
| Bladder | 40 |
|
10 |
|
40 |
|
14@@2.6±1.9 | 20 |
|
||||||
| Rectum | 40 |
|
10 |
|
40 |
|
8@@1.7±1.1 | 20 |
|
||||||
N = represents the number of contours analyzed.
Figure 4 compares interobserver variation () and residual DIR errors ( and ). Error bars represent 1 SD. was significantly less than for rectum, was not significantly different than prostate, and was significantly more than bladder by 1.5 mm. A second iteration of DIR focused on the bladder or rectum decreased deformation errors () by 16.8% for bladder and 10.8% for rectum. , however, remained significantly greater than bladder and significantly less than for rectum. Bladder contours for one patient are shown in Figs. 3(c) (axial) and 3(d) (coronal) for illustrative comparison.
Figure 4.
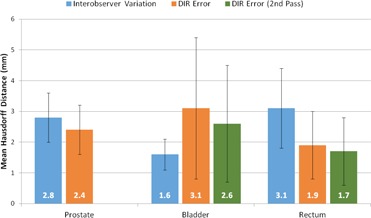
Comparison of interobserver variation and deformable image registration (DIR) error for male pelvic regions of interest. Values represent the mean Hausdorff distance calculated between the two surfaces for all patients. Error bars represent 1 SD.
IV. DISCUSSION
The current work examines DIR errors () in contour propagation and interobserver variation () in contour delineation for a sample of patients in two anatomical sites. The analysis was applied in two ways: first, to suggest a margin expansion for combined uncertainty of interobserver variation and DIR, and second, to directly compare interobserver variation and DIR uncertainty.
Numerous publications have suggested appropriate PTV and PRV margins for three‐dimensional conformal and intensity‐modulated radiation therapy, ranging from 2‐5 mm for head and neck, depending on immobilization and frequency of image guidance 24 , 25 , 26 , 27 , 28 , 29 , 30 , 31 , 32 and 3‐10 mm for prostate depending on frequency of image guidance. 33 , 34 , 35 Some authors have suggested the conventional 5 mm margin for head and neck is conservative and margin reduction may be possible, 24 , 25 , 27 , 29 but others have reported local setup uncertainties meet or exceed 5 mm. 26 , 28 , 36
Our study indicates combined uncertainty of interobserver variation and DIR ranged from 1‐6 mm for head and neck structures and between 3‐4 mm for pelvic structures. Assuming that appropriate PRV margins can be conservatively extrapolated from PTV margin data, the combination of 2‐3 mm reported setup uncertainty for head and neck, interobserver variation, and DIR error in quadrature would yield margins less than 5 mm for all but the anterior oral cavity, suggesting that conventional margins may be sufficient to cover the additional uncertainty of interobserver variation. This assumes, of course, the lower estimates for setup uncertainty, which may not be valid for anatomical subregions within the head and neck. 26 , 28 , 36 For prostate, the quadrature sum including interobserver variation and DIR would only be covered by a 5 mm margin for the lower reported setup uncertainty of 3 mm. Rasch et al., (37) however, suggest that margins including delineation variability (with no consideration for DIR) should be between 7.9‐9.7 mm for head and neck and 6.1‐9.5 mm for prostate — substantially larger than our hypothetical margin which would include interobserver variation and DIR. The authors note, however, that this margin is an overestimation given the lack of increase in recurrences with increasingly conformal therapy. (37) Gordon and Siebers (38) suggest that calculated prostate PTV margins are conservative because dosimetric margins extend beyond the nominal PTV expansion.
In the head and neck region, DIR uncertainty was significantly less than interobserver variation for 4 of 10 ROIs, not significantly different for 4 of 10 ROIs, and significantly greater than interobserver variation for 2 of 10 ROIs. In the pelvic region, DIR uncertainty was significantly less than interobserver variation for 1 of 3 ROIs, not significantly different for 1 of 3 ROIs, and significantly greater than interobserver variation for 1 of 3 ROIs. The current work is similar to a recent study by Hoffmann et al. (39) comparing DIR accuracy to interobserver variation for a sample of head and neck and abdominal patients using 30‐50 landmark points delineated by five observers on planning and treatment CT images. The authors found interobserver variation in landmark definition to be and residual misalignment after B‐spine DIR to be between 1‐4 mm for 50% of landmarks. Although we compared surface separation between ROIs rather than points, our head and neck interobserver and DIR variability measurements compare favorably with the published results. Our analysis suggests that atlas‐based segmentation using DIR may introduce normal tissue contour errors on par with interobserver variation for some anatomical structures, diminishing the advantage of observer‐independent, atlas‐based automatic segmentation. The increase in workflow efficiency, however, may be worthwhile given the net uncertainty remains relatively constant.
There are a few limitations to the current work. First, the current study only considers contour propagation. Surface analyses (20) or overlap metrics (40) provide limited information about deformation accuracy within a structure, so results of this study should not be generalized to other DIR applications, such as dose summation. (41) Second, the study was limited to a single commercially available DIR algorithm, though the methodology employed should be transferrable to other DIR algorithms. Propagated contours are saved as DICOM data, and can be exported and analyzed with surface separation metrics in third‐party commercial software or software developed in‐house. (42) Future work will include more observers for more robust interobserver analysis, and will focus on abnormal anatomy such as tumor and target volumes which are important for dose summation and adaptive radiation therapy. Mencarelli et al. (43) found that B‐spline DIR performs worse with tumor borders. Mohamed et al. (15) compared deformed target volumes to manually segmented reference target volumes and found 95% Hausdorff distances between 5‐10 mm.
V. CONCLUSIONS
Deformable image registration and interobserver variation influence contour propagation using a commercially available B‐spine deformable image registration algorithm. Deformable image registration uncertainty was significantly less than, or not significantly different from, interobserver variation for most ROIs in the male pelvic and head and neck regions. Use of deformable image registration for atlas‐based automatic segmentation may introduce uncertainty on par with interobserver variation. Combined interobserver variation and deformable image registration uncertainty may exceed conventional planning margins.
ACKNOWLEDGMENTS
The author (AR) would like to thank Eric Klein and David Collingridge for their help with this paper.
COPYRIGHT
This work is licensed under a Creative Commons Attribution 4.0 International License.
REFERENCES
- 1. Ireland RH, Dyker KE, Barber DC, et al. Nonrigid image registration for head and neck cancer radiotherapy treatment planning with PET/CT. Int J Radiat Oncol Biol Phys. 2007;68(3):952–57. [DOI] [PMC free article] [PubMed] [Google Scholar]
- 2. Stapleford LJ, Lawson JD, Perkins C, et al. Evaluation of automatic atlas‐based lymph node segmentation for head‐and‐neck cancer. Int J Radiat Oncol Biol Phys. 2010;77(3):959–66. [DOI] [PubMed] [Google Scholar]
- 3. Wu Q, Chi Y, Chen PY, Krauss DJ, Yan D, Martinez A. Adaptive replanning strategies accounting for shrinkage in head and neck IMRT. Int J Radiat Oncol Biol Phys. 2009;75(3):924–32. [DOI] [PubMed] [Google Scholar]
- 4. Qin A, Sun Y, Liang J, Yan D. Evaluation of online/offline image guidance/adaptation approaches for prostate cancer radiation therapy. Int J Radiat Oncol Biol Phys. 2015;91(5):1026–33. [DOI] [PubMed] [Google Scholar]
- 5. Yu G, Liang Y, Yang G, et al. Accelerated gradient‐based free form deformable registration for online adaptive radiotherapy. Phys Med Biol. 2015;60(7):2765–83. [DOI] [PubMed] [Google Scholar]
- 6. Schwartz DL, Garden AS, Thomas J, et al. Adaptive radiotherapy for head‐and‐neck cancer: initial clinical outcomes from a prospective trial. Int J Radiat Oncol Biol Phys. 2012;83(3):986–93. [DOI] [PMC free article] [PubMed] [Google Scholar]
- 7. Wang H, Dong L, O'Daniel J, et al. Validation of an accelerated ‘demons’ algorithm for deformable image registration in radiation therapy. Phys Med Biol. 2005;50(12):2887–905. [DOI] [PubMed] [Google Scholar]
- 8. Thirion JP. Image matching as a diffusion process: an analogy with Maxwell's demons. Med Image Anal. 1998;2(3):243–60. [DOI] [PubMed] [Google Scholar]
- 9. Schreibmann E, Waller AF, Crocker I, Curran W, Fox T. Voxel clustering for quantifying PET‐based treatment response assessment. Med Phys. 2013;40(1):012401. [DOI] [PubMed] [Google Scholar]
- 10. Lawson JD, Schreibmann E, Jani AB, Fox T. Quantitative evaluation of a cone‐beam computed tomography‐planning computed tomography deformable image registration method for adaptive radiation therapy. J Appl Clin Med Phys. 2007;8(4):96–113. [DOI] [PMC free article] [PubMed] [Google Scholar]
- 11. Vinogradskiy YY, Balter P, Followill DS, Alvarez PE, White RA, Starkschall G. Comparing the accuracy of four‐dimensional photon dose calculations with three‐dimensional calculations using moving and deforming phantoms. Med Phys. 2009;36(11):500–06. [DOI] [PubMed] [Google Scholar]
- 12. Schreibmann E, Pantalone P, Waller A, Fox T. A measure to evaluate deformable registration fields in clinical settings. J Appl Clin Med Phys. 2012;13(5):126–39. [DOI] [PMC free article] [PubMed] [Google Scholar]
- 13. Riyahi‐Alam S, Peroni M, Baroni G, Riboldi M. Regularization in deformable registration of biomedical images based on divergence and curl operators. Methods Inf Med. 2014;53(1):21–28. [DOI] [PubMed] [Google Scholar]
- 14. Castillo R, Castillo E, Guerra R, et al. A framework for evaluation of deformable image registration spatial accuracy using large landmark point sets. Phys Med Biol. 2009;54(7):1849–70. [DOI] [PubMed] [Google Scholar]
- 15. Mohamed AS, Ruangskul MN, Awan MJ, et al. Quality assurance assessment of diagnostic and radiation therapy‐simulation CT image registration for head and neck radiation therapy: anatomic region of interest‐based comparison of rigid and deformable algorithms. Radiology. 2015;274(3):752–63. [DOI] [PMC free article] [PubMed] [Google Scholar]
- 16. Brock KK, Deformable Registration Accuracy Consortium. Results of a multi‐institution deformable registration accuracy study (MIDRAS). Int J Radiat Oncol Biol Phys. 2010;76(2):583–96. [DOI] [PubMed] [Google Scholar]
- 17. Mencarelli A, van Beek S, van Kranen S, Rasch C, van Herk M, Sonke JJ. Validation of deformable registration in head and neck cancer using analysis of variance. Med Phys. 2012;39(11):6879–84. [DOI] [PMC free article] [PubMed] [Google Scholar]
- 18. Tao CJ, Yi JL, Chen NY, et al. Multi‐subject atlas‐based auto‐segmentation reduces interobserver variation and improves dosimetric parameter consistency for organs at risk in nasopharyngeal carcinoma: a multi‐institution clinical study. Radiother Oncol. 2015;115:407–11. [DOI] [PubMed] [Google Scholar]
- 19. Raince J, Riegel AC, Chou H, Halthore A, Potters L, Cox B. Integrated deformable registration and biologic modeling to compare dose distributions of high‐dose IMRT and combination IMRT‐brachytherapy (Combo‐RT) in localized prostate cancer. Int J Radiat Oncol Biol Phys. 2014;90(1 Suppl):S857. [Google Scholar]
- 20. Varadhan R, Karangelis G, Krishnan K, Hui S. A framework for deformable image registration validation in radiotherapy clinical applications. J Appl Clin Med Phys. 2013;14(1):192–213. [DOI] [PMC free article] [PubMed] [Google Scholar]
- 21. Fiorino C, Reni M, Bolognesi A, Cattaneo GM, Calandrino R. Intra‐ and interobserver variability in contouring prostate and seminal vesicles: implications for conformal treatment planning. Radiother Oncol. 1998;47(3):285–92. [DOI] [PubMed] [Google Scholar]
- 22. Hermans R, Feron M, Bellon E, Dupont P, van den Bogaert W, Baert AL. Laryngeal tumor volume measurements determined with CT: A study on intra‐ and interobserver variability. Int J Radiat Oncol Biol Phys. 1998;40(3):553–57. [DOI] [PubMed] [Google Scholar]
- 23. van Herk M. Errors and margins in radiotherapy. Semin Radiat Oncol. 2004;14(1):52–64. [DOI] [PubMed] [Google Scholar]
- 24. Astreinidou E, Bel A, Raaijmakers CP, Terhaard CHJ, Lagendijk JJ. Adequate margins for random setup uncertainties in head‐and‐neck IMRT. Int J Radiat Oncol Biol Phys. 2005;61(3):938–44. [DOI] [PubMed] [Google Scholar]
- 25. Chen AM, Farwell DG, Luu Q, Donald PJ, Perks J, Purdy JA. Evaluation of the planning target volume in the treatment of head and neck cancer with intensity‐modulated radiotherapy: What is the appropriate expansion margin in the setting of daily image guidance? Int J Radiat Oncol Biol Phys. 2011;81(4):943–49. [DOI] [PubMed] [Google Scholar]
- 26. van Kranen S, van Beek S, Rasch C, van Herk M, Sonke JJ. Setup uncertainties of anatomical sub‐regions in head‐and‐neck cancer patients after offline CBCT guidance. Int J Radiat Oncol Biol Phys. 2009;73(5):1566–73. [DOI] [PubMed] [Google Scholar]
- 27. Kapanen M, Laaksomaa M, Tulijoki T, et al. Estimation of adequate setup margins and threshold for position errors requiring immediate attention in head and neck cancer radiotherapy based on 2D image guidance. Radiat Oncol. 2013;8:212. [DOI] [PMC free article] [PubMed] [Google Scholar]
- 28. Hong TS, Tomé WA, Chappell RJ, Chinnaiyan P, Mehta MP, Harari PM. The impact of daily setup variations on head‐and‐neck intensity‐modulated radiation therapy. Int J Radiat Oncol Biol Phys. 2005;61(3):779–88. [DOI] [PubMed] [Google Scholar]
- 29. Worthy D and Wu Q. Dosimetric assessment of rigid setup error by CBCT for HN‐IMRT. J Appl Clin Med Phys. 2010;11(3):3187. [DOI] [PMC free article] [PubMed] [Google Scholar]
- 30. Siebers JV, Keall PJ, Wu Q, Williamson JF, Schmidt‐Ullrich RK. Effect of patient setup errors on simultaneously integrated boost head and neck IMRT treatment plans. Int J Radiat Oncol Biol Phys. 2005;63(2):422–33. [DOI] [PubMed] [Google Scholar]
- 31. Manning MA, Wu Q, Cardinale RM, et al. The effect of setup uncertainty on normal tissue sparing with IMRT for head‐and‐neck cancer. Int J Radiat Oncol Biol Phys. 2001;51(5):1400–09. [DOI] [PubMed] [Google Scholar]
- 32. Delana A, Menegotti L, Bolner A, et al. Impact of residual setup error on parotid gland dose in intensity‐modulated radiation therapy with or without planning organ‐at‐risk margin. Strahlenther Onkol. 2009;185(7):453–59. [DOI] [PubMed] [Google Scholar]
- 33. Wen N, Kumarasiri A, Teamour N, et al. An assessment of PTV margin based on actual accumulated dose for prostate cancer radiotherapy. Phys Med Biol. 2013;58(21):7733–44. [DOI] [PMC free article] [PubMed] [Google Scholar]
- 34. Hammoud R, Patel SH, Pradhan D, et al. Examining margin reduction and its impact on dose distribution for prostate cancer patients undergoing daily cone‐beam computed tomography. Int J Radiat Oncol Biol Phys. 2008;71(1):265–73. [DOI] [PubMed] [Google Scholar]
- 35. Maund IF, Benson RJ, Fairfoul J, Cook J, Huddart R, Poynter A. Image‐guided radiotherapy of the prostate using daily CBCT: the feasibility and likely benefit of implementing a margin reduction. Br J Radiol. 2014;87(1044):20140459. [DOI] [PMC free article] [PubMed] [Google Scholar]
- 36. Yang J, Garden AS, Zhang Y, Zhang L, Dong L. Variable planning margin approach to account for locoregional variations in setup uncertainties. Med Phys. 2012;39(8):5136–44. [DOI] [PMC free article] [PubMed] [Google Scholar]
- 37. Rasch C, Steenbakkers R, van Herk M. Target definition in prostate, head, and neck. Semin Radiat Oncol. 2005;15(3):136–45. [DOI] [PubMed] [Google Scholar]
- 38. Gordon JJ and Siebers JV. Evaluation of dosimetric margins in prostate IMRT treatment plans. Med Phys. 2008;35(2):569–75. [DOI] [PMC free article] [PubMed] [Google Scholar]
- 39. Hoffmann C, Krause S, Stoiber EM, et al. Accuracy quantification of a deformable image registration tool applied in a clinical setting. J Appl Clin Med Phys. 2014;15(1):237–45. [DOI] [PMC free article] [PubMed] [Google Scholar]
- 40. Zou KH, Warfield SK, Bharatha A, et al. Statistical validation of image segmentation quality based on a spatial overlap index. Acad Radiol. 2004;11(2):178–89. [DOI] [PMC free article] [PubMed] [Google Scholar]
- 41. Bender ET, Hardcastle N, Tomé WA. On the dosimetric effect and reduction of inverse consistency and transitivity errors in deformable image registration for dose accumulation. Med Phys. 2012;39(1):272–80. [DOI] [PubMed] [Google Scholar]
- 42. Riegel AC, Bucci MK, Mawlawi OR, et al. Target definition of moving lung tumors in positron emission tomography: correlation of optimal activity concentration thresholds with object size, motion extent, and source‐to‐background ratio. Med Phys. 2010;37(4):1742–52. [DOI] [PMC free article] [PubMed] [Google Scholar]
- 43. Mencarelli A, van Kramen SR, Hamming‐Vrieze O, et al. Deformable image registration for adaptive radiation therapy of head and neck cancer: accuracy and precision in the presence of tumor changes. Int J Radiat Oncol Biol Phys. 2014;90(3):680–87. [DOI] [PubMed] [Google Scholar]