Abstract
Background:
The increasing trend of heart disease has turned the attention of researchers toward the use of portable connected technologies. The necessity of continuous special care for cardiovascular patients is an inevitable fact.
Methods:
In this research, a new wireless electrocardiographic (ECG) signal-monitoring system based on smartphone is presented. This system has two main sections. The first section consists of a sensor which receives ECG signals via an amplifier, then filters and digitizes the signal, and prepares it to be transmitted. The signals are stored, processed, and then displayed in a mobile application. The application alarms in dangerous situations and sends the location of the cardiac patient to family or health-care staff.
Results:
The results obtained from the analysis of the electrocardiogram signals on 20 different people have been compared with the traditional ECG in hospital by a cardiologist. The signal is instantly transmitted by 200 sample per second to mobile phone. The raw data are processed, the anomaly is detected, and the signal is drawn on the interface in about 70 s. Therefore, the delay is not noticeable by the patient. With respect to rate of data transmission to hospital, different internet connections such as 2G, 3G, 4G, WiFi, WiMax, or Long-Term Evolution (LTE) could be used. Data transmission ranges from 9.6 kbps to 20 Mbps. Therefore, the physician could receive data with no delay.
Conclusions:
A performance accuracy of 91.62% is obtained from the wireless ECG system. It conforms to the hospital's diagnostic standard system while providing a portable monitoring anywhere at anytime.
Keywords: Arrhythmia detection, cardiac, electrocardiogram, mobile health care, telemedicine
Introduction
Cardiovascular diseases are known as the second cause of death during the last 10 years.[1,2] According to World Health Organization statistics, 15 million people died in year 2015 because of ischemic heart disease and stroke, the world's biggest killers.[3] It is estimated that the number of deaths by the year 2030 will increase to 23.6 million people, the rate is increasing as a result of change in life styles.[4] With increasing cardiovascular diseases during the last few decades, the patient's constant heart signal monitoring plays a major role in fast retrieval of pathological symptoms. When it comes to heart rate (HR) monitoring, two primary technologies are available to device manufacturers: electrocardiographic (ECG) and photoplethysmography (PPG). PPG is used in wristband heart trackers. ECG sensors measure the biopotential generated by electrical signals that control the expansion and contraction of heart chambers. In PPG, the capillaries are illuminated by an light-emitting diode (LED); the frequency of blood pumps (i.e., HR) is measured by a sensor next to skin. ECG sensors have smaller size, consume less power, and deliver widest range of heart's health metrics, more accurate measuring both HR and HR variability. When using wristband heart trackers, the user must be absolutely still and quiet. The optical trackers would not work during an intensive exercise. Moreover, HR reached capillaries is already slowed down. Therefore, it does not reflect the true HR. Another issue is with skin pigmentation, the light must penetrate several layer of skin. In users with darker skin, the light bounces back more difficulty. Furthermore, pulse meters are not very reliable when used out of doors because of the changes in ambient light.[5,6,7,8,9] Among these monitoring systems, the mobile electrocardiogram (mECG) based on wireless technology could be beneficial. The mECG can provide the free movement of patients and ease the remote heart monitoring at anytime and anyplace.[10,11] Utilizing this system decreases the patients’ referral to hospital, increases their satisfaction, comfort, and assists in prevention of heart attacks. In other heart-monitoring systems such as Holter monitoring devices, the ECG signal of patient is only recorded for 48 h and then it must be analyzed by an expert. However, the wireless systems are placed comfortably on the patient's body to continually record the heart signal while the patient is carrying his/her every day activities at home or at work. Moreover, if an abnormal situation occurs during the monitoring process, the signal will be recorded by the device, the patient will receive an alarm, and the physician will be informed immediately. While in traditional systems, if an abnormal situation occurs, the patient receives no immediate feedback, and as a result, the need for hospitalization could increase. Among these systems, the AMON system is an advanced medical monitoring system that is designed and built by European Union IST sponsored consortium consisting of five industrial partners (EU EP5 IST). This system is worn on the wrist and measures the ECG, blood pressure, temperature, and oxygen. It also has an accelerometer sensor that specifies the physical activity level.[12] Another system is Livenet which is designed and built by MIT laboratories. This system has a mobile and flexible platform which is designed for long-lasting monitoring with instant processing and text interpretation using a wide variety of commercial sensors.[13] Wealthy is a wearable monitoring system in which the sensor elements have been weaved on the cloth. This system is capable of ECG monitoring, electro-mayo gram signal recording, body temperature measuring, breathing pattern, and physical activity recognition; however, the data analysis is carried out offline.[14] Magic is another wearable system consisting of a sensing cloth and an electronic mobile board. The cloth is fitted with two electrodes made of conductor material to record the ECG signals. It also measures the breathing frequency of a person by the chest movement. The information is transmitted via the conductor yarn from the sensors to the electronic board. This board recognizes the persons’ activity with a two-axial accelerometer. In addition, it transmits the recorded signals to a local computer via a wireless connection by Bluetooth.[15] Other systems capable of monitoring vital signs besides the ECG signal are Alivecor,[16] and ViSi Mobile.[17] Smartphones are among portable devices frequently incorporated in these mobile health-care applications to access, analyze, and transfer context aware and multimedia data.[18] Mobile health-care system or mHealth provides services or mechanisms to support the medical treatment and health-care monitoring using smartphones and wireless sensors.[19] In other words, services and information are given through wireless and mobile technologies. mHealth applications constantly monitor and analyze the patient's vital signs, remote medication consumption, and family health-care by prompt reporting and alarming the critical changes in health conditions. It improves the quality life of patients, compensates for lack of physicians in rural areas, and decreases the health-care expenses.[20] The monitoring system[21] collects and monitors ECG and body temperature. The sensor data from a wearable ECG module are transferred to a smartphone via Bluetooth protocol. The smartphone's application interface draws the received ECG signal while showing the body temperature. This drawn signal can be converted to a bitmap picture and transmitted by Multimedia Messaging System to a health-care center for analysis by a physician.[22] In 2013 Vijey et al.,[10] the heart monitoring and analysis is carried out by wearable ECG sensors and android smartphone. If any unusual situation happened, the smartphone application starts off an alarm and presents first-aid techniques to the patient, to increase the chance of survival. Moreover, a report of patient's ECG signal is transmitted to physician by e-mail accompanying a message indicating the patient's location to hospital emergency services. In the works of Chen,[23] a remote health-monitoring system collects physiological parameters like heart and respiration rate by wearable sensors and is send and presented on a smartphone. This system supports quick alarming and locating services in case of emergency or heart failure. In[24] a heart-monitoring system for arrhythmia, diagnosis is introduced. In this system, location of patient is detected via Global Positioning System (GPS), WiFi access point, and GSM cell. In[25,26] shimmer, sensors and android smartphones are incorporated to record and diagnose the ECG signals. In this study, the ECG-monitoring system is designed with a vision to act as an open source platform in Iran for future heart disease analysis using smartphone. It is an ongoing project, so far only two basic arrhythmias have been implemented. In future using advanced signal processing techniques and machine-learning algorithms, system can work on behalf of a cardiologist in rural areas of developing worlds that have less access to heart specialist. At present, the system not only measures the HR but also sends the signal to specialist at real time. The cardiologist can recognize further heart diseases than arrhythmia. The feedback is immediately sent back to patient via mobile internet and the designated applications.
The comparison between listed projects and proposed system is shown in Table 1.
Table 1.
Comparison among different heart-monitoring projects
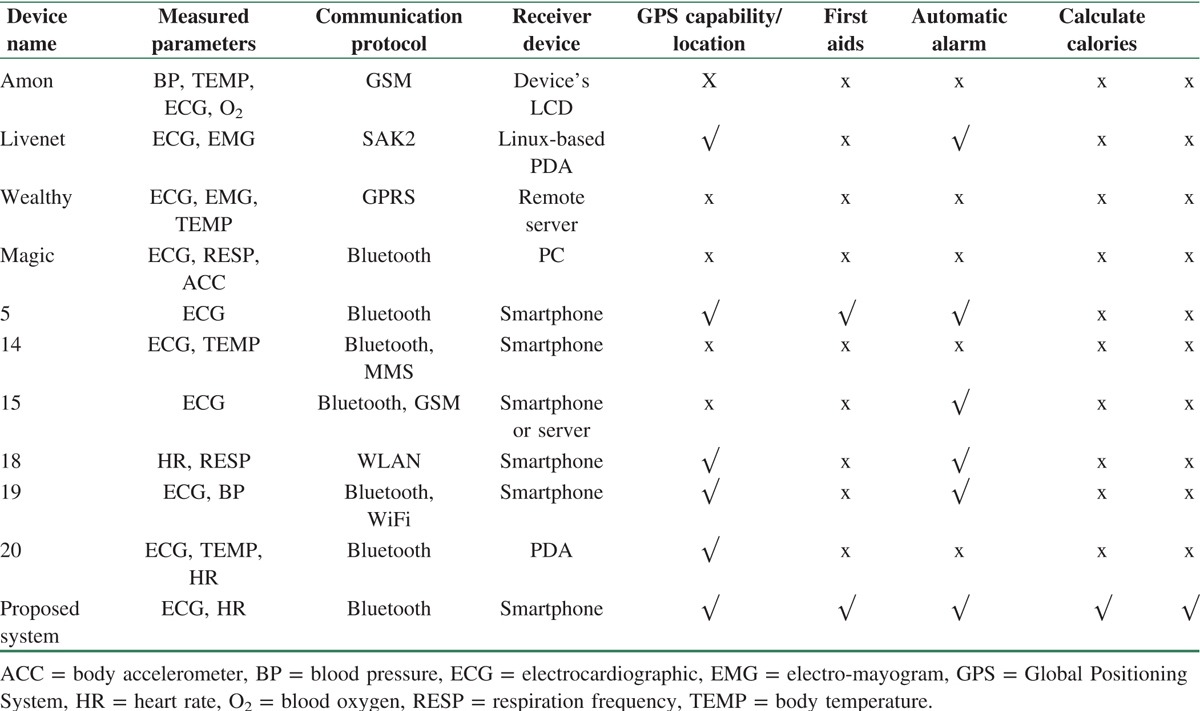
In this paper, a new complete heart-monitoring system is implemented and more parameters such as number of heartbeats and patient's consumed calories are displayed. In addition, the patient's location is calculated by GPS receiver on the smartphone. In case of an emergency, the doctor and the medical staff will be notified of his/her location and symptoms. While waiting for the aid group to arrive, the medical and instructional information are displayed in step-by-step order to help preventing any heart failures. A database of medical and drug information is also designed to increase the patient's awareness of the cardiovascular diseases and their treatments. It is also possible to set up alerts for the medication consumption. The results obtained by the monitoring system matches the hospital measuring reference device according to the cardiologist's opinion. The number of heartbeats has an accuracy of 91.62%. The accuracy of received signals has also been confirmed by a cardiologist. In the following section, the system structure is presented. In the “Wireless Heart Monitoring System Hardware” section, the system hardware is described. In the “Software for the Wireless Heart Monitoring system” section is dedicated to user interface design and mobile application's features. In the “Results” section, the results analysis and evaluation are discussed, and finally in the “Conclusion” section, the article is concluded.
The Structure of Wireless Heart Signal Monitoring System
The wireless heart signal monitoring system, as it is shown in Figure 1, has two main units. First unit has a receiving sensor and the transmitting heart signal component. The second unit consists of a storage platform and the processing capability for analyzing the information for disease diagnosis. The connection between these two units is wireless.
Figure 1.

General block diagram for wireless heart signal monitoring system.
The first unit consists of four subunits of (1) power supply, (2) heart signal receiving sensor, (3) microcontroller, and (4) wireless transmitter. The signal from heart is first received using three electrode sensors which are connected to the body. Then, the signal is amplified; noise and unwanted frequencies are eliminated. Next, the signal is sampled and digitalized by microcontroller and is sent wirelessly to a smartphone by Bluetooth module. Figure 2 shows the general structure of first unit.
Figure 2.

Unit one's block diagram.
Then, the received signal on the smartphone will be processed and stored. The signal next is displayed on the phone's monitor. Figure 3 illustrates the wireless monitoring system of the heart signals.
Figure 3.
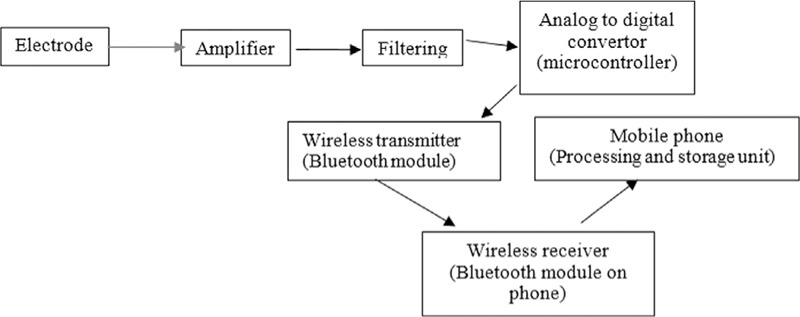
General block diagram of wireless heart monitoring system.
Wireless Heart Monitoring System Hardware
An AD8232 single-lead heartbeat monitor was used to measure the heart's electrical activity. It amplifies, filters, and removes the noise from signal.[27]
Receiving and improving the raw heart signal
The implemented hardware for receiving and improving the raw ECG signal consisted of amplifier, high-pass filter, low-pass filter, and driven right leg circuit which cancels noise receive from the body. The necessary circuit parts for receiving signal in this system are as follow:
-
(1)
Power circuit: All modules and boards in this system use 3.3 V. Thus, by using LF33 regulator, battery voltage of 7 V will be converted to the desired voltage to supply the sensors’ circuit parts.
-
(2)
Instrumentation amplifier: Instrumentation amplifier is a differential amplifier, because its high inlet impedance has a wide range of applications in measurement and instrumentation tools. This amplifier reinforces the difference in voltage between the two input terminals. With regards to the differential nature of biological signals and existence of noise from the power line on both electrodes of heart signal measuring device in lead one, it is necessary to use the differential amplifier.
-
(3)
Bipolar high-pass filter: High-pass filter eliminates all frequencies under the cutoff frequency or weakens them and lets the higher frequencies to pass.[28] Since bipolar high-pass filter in artifact has a better efficiency, then this filter is chosen to be used.
-
(4)
Sallen–Key low-pass filter: The frequency range for ECG signal is between 0.05 and 250 Hz. Usually in monitoring system standards, frequencies above 100 Hz do not have much information to present, and then the low-pass filter is used to cutoff the frequencies above 100 Hz. To have a more precise responses and to have a more accurate cutoff value, the second degree Sallen–Key butterworth filter is used.[28] The filter is an active filter which uses operating amplifiers to eliminate the noise. It also has an accurate cutoff frequency and therefore it lets the desirable signals to pass better.
-
(5)
Right leg driver: This circuit inverts the common signal of the instrumentation amplifier's input. When the output current of the right leg driver is injected into a person's body, this circuit neutralizes the common voltage fluctuations, and therefore, it improves the process of elimination of common mode signal. Also, the 50-Hz signal is neutralized by implementing this driver. It also prevents the person to directly connect to the earth. On the other hand, if a large voltage is given to a person (for any reasons, an unwanted large voltage is imposed between the patient and the outlet of the amplifier), the operating amplifier which is connected to the patient becomes saturated and consequently the connection between the patient and the earth is cut and thus necessary electrical protection of patient is achieved.
According to the described circuits, it is necessary to carry out different functions on the heart signal. The complex circuit module of AD8232 has been used consisting of power circuits, filtering, amplifier, and right leg driver. This circuit's pins are Ground (GND), the ground connection; 3.3 V is the power supply connection, and the output is the output signal. Input is also received from Right Arm (RA), Left Arm (LA), and Right Leg (RL) pins which are right hand, left hand, and right leg, respectively. Also, there is a separate port for receiving inputs.[27]
Sampling and digitalization by microcontroller
To transmit the data to the smartphone, sampling and digitalization of received ECG signal is needed. Therefore, an atMEGA16 AVR microcontroller was used, because of its high speed and high performance capabilities. Then, the received signal from the sensor was sampled with the rate of 125 kHz and then it is sent to Bluetooth module with baud rate of 9600.
Wireless transmitter
To transmit the digitized signal, there are a wide variety of wireless technologies. The two standards of Bluetooth IEEE 802.15.1 and Zigbi IEEE 802.15.4 are the most common wireless communication standards in the field of short-range technologies and body area network. In this research, the Bluetooth standard with serial transmission has been used. Bluetooth is a type of personal area network technology that activates by installing an inexpensive microchip on devices and uses short radio frequency band for wireless communication in low power and short-range applications based on ad hoc. It is highly efficient, low cost for domestic and commercial consumers, easy in quick and secure exchange of data, and has simple implementation. In Figure 4, the designed hardware is illustrated for receiving, preparation, and transmission of the heart signal and how it is connected to body.
Figure 4.

Left: The designed hardware. Right: Connection of device to patient and the received signal on the mobile phone.
Software for the Wireless Heart Monitoring system
In this section, the mobile application and how it receives, stores, and process the signal is explained. The system output is the patient's ECG signal, heartbeat, and calorie information with necessary warnings and notifications. Moreover, a database for medication information has been designed to increase the awareness of patient about the heart diseases and their treatments.
Electrocardiographic signals on mobile application
After wirelessly transmitting the information from the sensor to the mobile application via Bluetooth, the following steps are carried out on the device:
-
(1)
The application is launched and personal information is entered. This section consists of logging in the personal information such as the name, age, and an emergency number so that in case of an emergency, an alarm message will be transmitted to an appropriate phone.
-
(2)
Application is connected to the sensor through the Bluetooth activation of the smartphone and the data are received from the sensor for a period of 1 min. Data collection intervals could be set by the user.
-
(3)
The ECG signal is stored as a file in phone's memory. Storage of received heart signal is accomplished with date and time stamp. This information is stored in a specific memory location as a text file.
-
(4)
The application interface is gridded for displaying the ECG signal. The application user interface is designed according to the ECG's traditional gridded recording paper for precise comparison. According to the performed lab's pulse examination, pulse range of 1 mm is chosen for calibration.
-
(5)
The data are analyzed and processed based on the heartbeat numbers.
-
(6)
An emergency notification is designed. In case of observing a dangerous situation, a warning will be issued. To prevent false warnings in case the heartbeat is recorded after running, which causes heartbeat number to increase, the patient will be asked for dismissing the warning and if no answer is received after 18 s, then warning will be issued automatically.
-
(7)
The information is transferred to an expert doctor. Patient's information is send via a text file using mobile internet, WiFi connection, or by Bluetooth.
-
(8)
Consumed calorie is calculated and displayed.
-
(9)
The medical and drug information database system is designed. There is an option for medication information in which the user can access certain medication side effect, intake instructions, consumption trend via entering the name of drug or using the existing list of drugs. Moreover, the patient can adjust times of drug consumption using designed daily notification so that the time of consumption is reminded. It is completely free of charge comparing with the expensive medication trackers in the market.
Figure 5 illustrates a schematic of designed mobile application and Figure 6 shows how the location of the patient is obtained. Figure 7 represents images of drug information, creating drug reminder mechanism, and instructions related to heart attacks.
Figure 5.
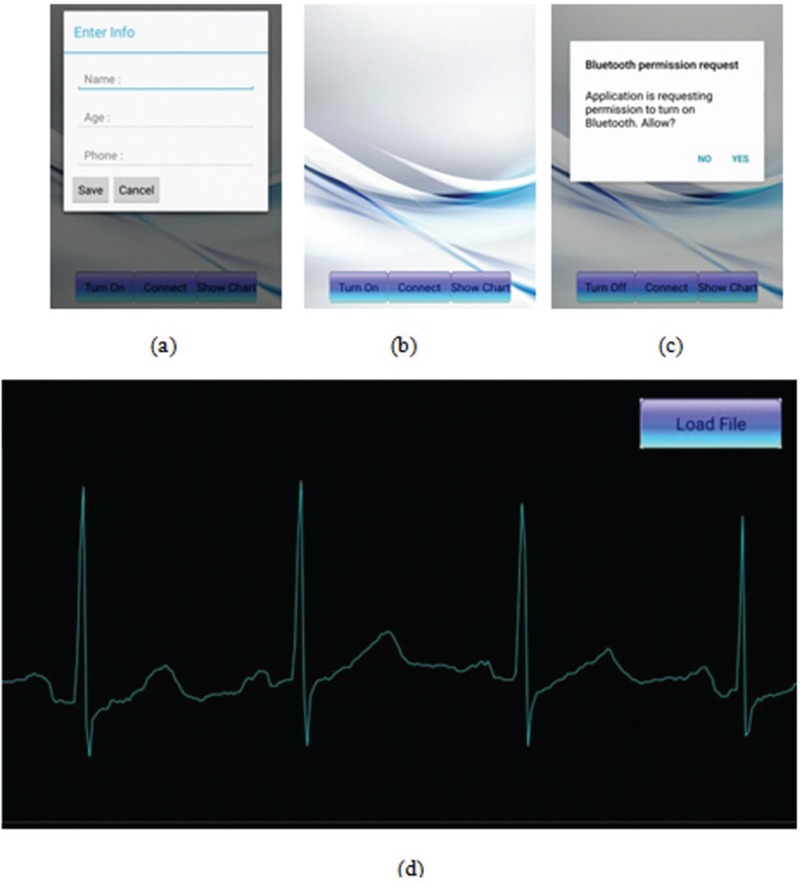
Left: Mobile application launching interface. (a) Data register, (b) main menu, (c) turning on the Bluetooth, (d) display electrocardiographic signal on smartphone user interface.
Figure 6.
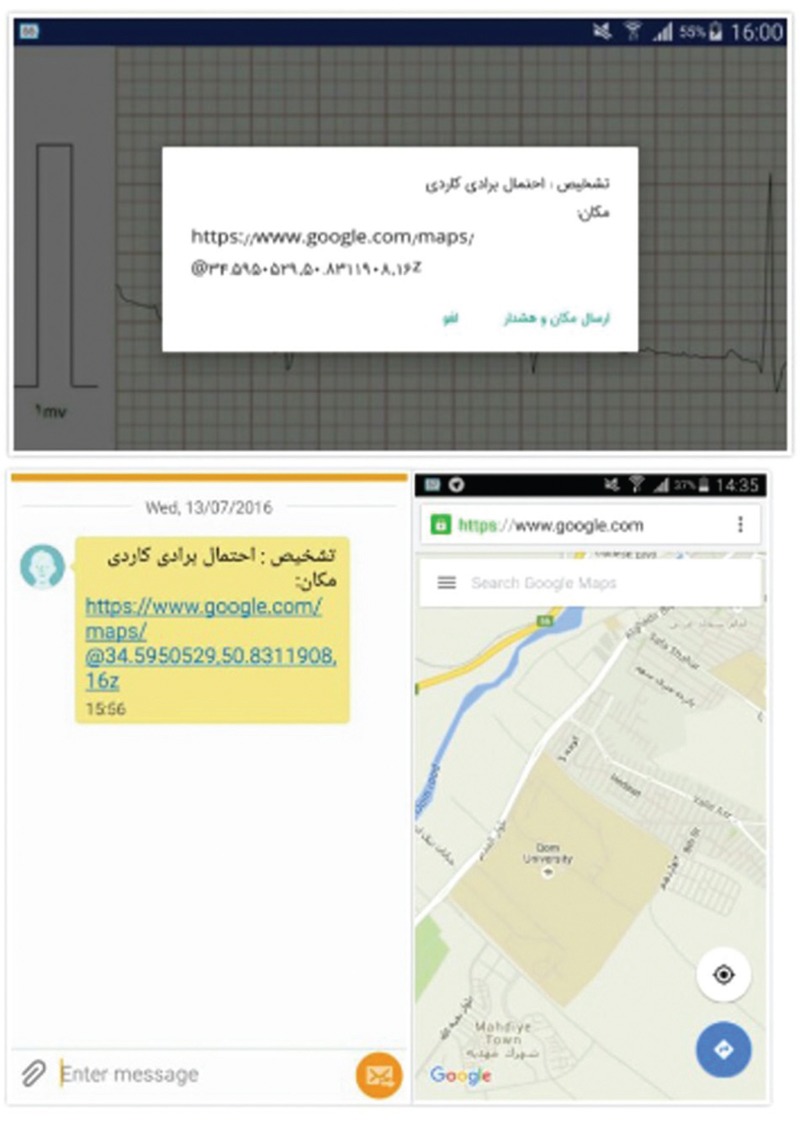
Obtaining and informing the location of patient.
Figure 7.
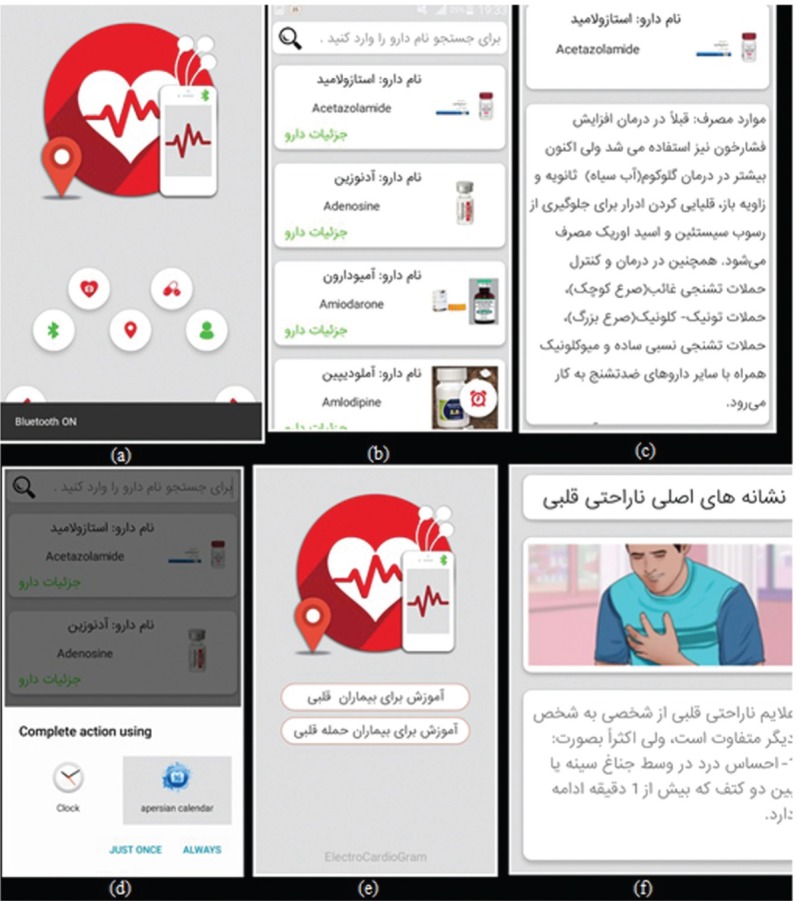
(a–d) Database for drug and medical information − (a) main menu for item selection, (b) medication detail selection, (c) medication detail, (d) appropriate medication alarm, (e) heart disease educational resources, and (f) the educational content with multimedia and text.
Electrocardiographic processing algorithm for diagnosing the number of heartbeats
The most important section of ECG signal complex is QRS which represents the activity of the heart's left ventricular. In this complex, peak R is very important because of its largest duration and highest peak. Considering that recognition of almost all parameters of ECG is based on one identifiable and fixed point in each cycle, then this peak is suitable as a datum point. There are many identifiable algorithms that are used for analysis of ECG.[29,30,31,32,33,34,35,36] As mobile phone's processors are less capable than PCs and do not support complex calculations, implementation of complex algorithms is a challenging task. Moreover for quick processing and extraction of wave characteristics of ECG, the algorithm should be precise and simple. Therefore, the quick recognition algorithm of QRS, which is presented by Pan and Tompkins[29], has been used. This algorithm recognizes QRS complex based on its slope, range, and width of signal that consists of two sections of linear and nonlinear processes. Three steps of linear process consists of band pass filter, derivative, moving window, integrator window, and the nonlinear section consisting of squaring signal and decision rule algorithms are based on threshold value. This algorithm is described below:
(1) Filtering: Band pass filter decreases the effect of muscle noise and interference of T-wave interference. The design of this filter is done by combination of low-pass and high-pass filters.
(a) Low-pass filter: The secondary low-pass filter is used and its conversion function is 
(b) High-pass filter: Implementation of this filter is carried out based on differentiating the outlet of first level low-pass filter from a all-pass filter so that its conversion function is 
(2) Differentiator: Afterfiltration, signal will be differentiated and QRS complex is obtained. Therefore, a five-point differential with conversion function has been used: 
(3) Squaring: A nonlinear function is performed on the signal and causes each signal point to have a positive amount and signal parts with higher range to be reinforced. With considering that the differentiable output signal is squared, then sections with bigger ranges like QRS complex become noticeable and locating their occurrences is easier. Therefore, the implemented equation becomes 
(4) Moving Window Integration: In this section, the moving window integration is moved over the signal. When the sum of numbers in the window is larger, it is marked as R waves. The width of this window should be such that it only contains a QRS complex. The equation used in this section is 
where N is the number of samples in window's width.
(5) Adjusting the threshold and making the decision: A suitable threshold for recognition of correct peak R is considered. For correct recognition of peak R, a decision-making block is implemented which analyzes the validity of chosen peak in QRS complex.
The incorporated algorithm for determining heartbeat rate and issuing warning is as follows:
-
(1)
The heart signal is read.
-
(2)
Peak R is recognized: this peak is recognized based on Pan Tompkins quick algorithm.
-
(3)
The number of heartbeats is counted based on counting the number of recognized peak R in 1 min.
-
(4)
Normal condition, fast (tachycardia) or slow (bradycardia) heartbeat, and warning conditions are recognized. Based on the number of counted heartbeats in 1 min, different situations may occur which will be classified according to the medical standards. Therefore, if the number of heartbeats is between 72 and 100 bpm, it is normal; if the number of heartbeats is between 100 and 130 bpm, it is fast; if the number of heartbeats is less than 70, it is slow; and finally, if the number of heartbeats is less than 60 or more than 150 bpm, it is a dangerous situation.
Calorie calculation
In this system, information such as age, sex, and weight of patient is collected and the heartbeat is calculated; therefore, the consumed calorie could be measured. The equations (6) and (7) are used to obtain consumed calorie by male and female, respectively.[37]
Consumed calorie for male 
Consumed calorie for female 
In these formulas, h is the number of heartbeats per minute, w is the weight in kg, a is age in years, and t is time in hours. Figure 8 shows the calorie and heartbeat rate of different patients in different times.
Figure 8.
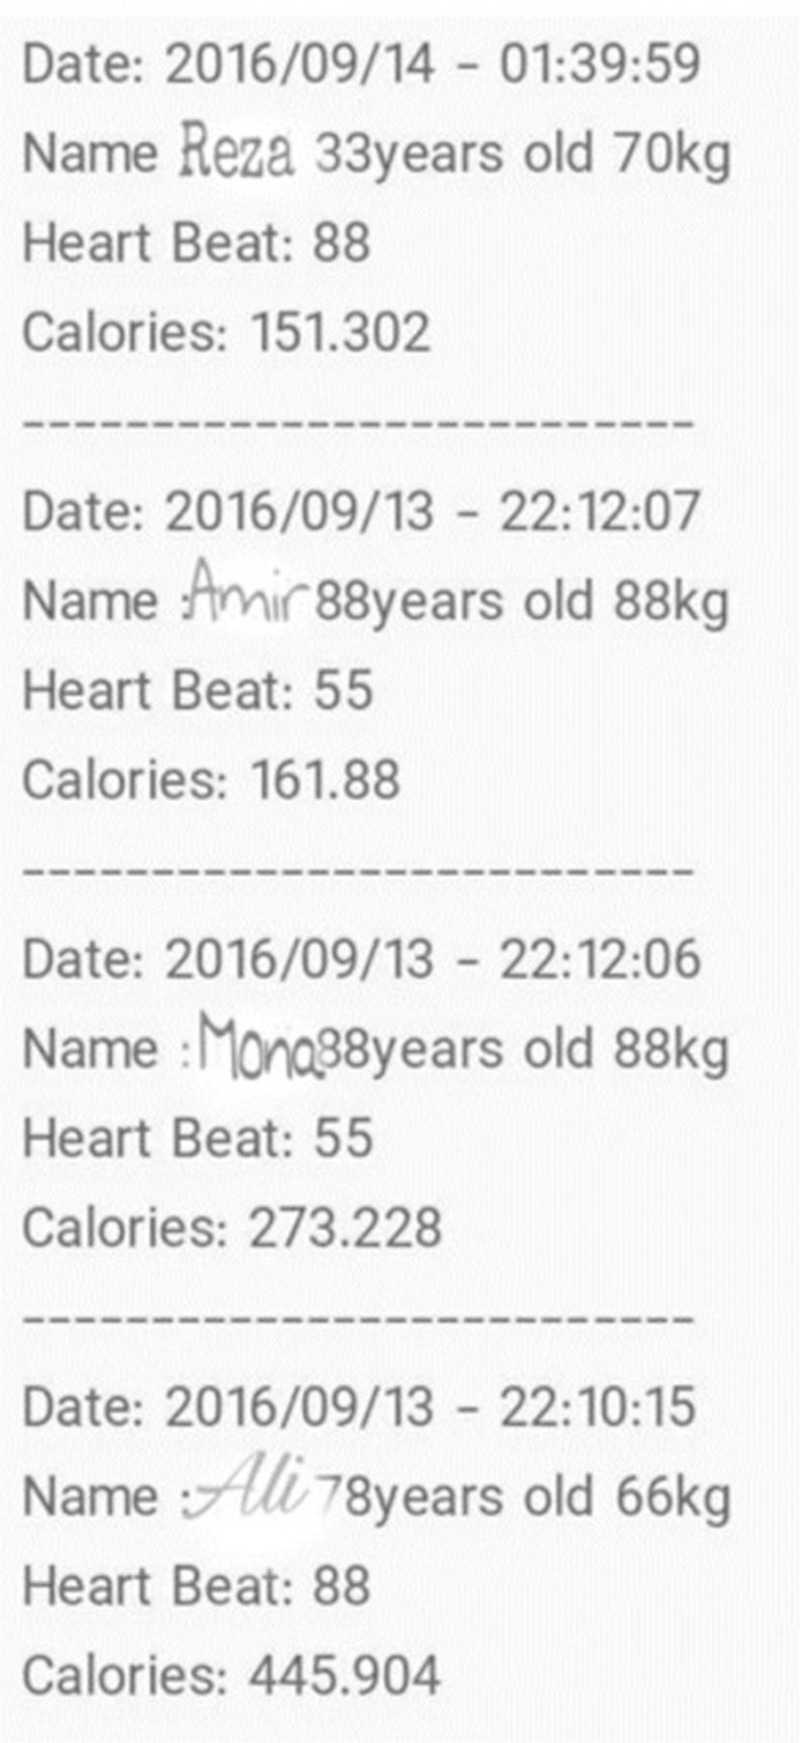
The patients’ calorie and heartbeats log file.
Results
The suggested heart-monitoring system has been tested on 20 patients while comparing it with the hospital's ECG device. The device which is used in hospital is model s1800, produced by Pouyandegane Rahe Saadat company, Tehran, Iran.[38] Tests were performed under the cardiologists’ inspection and in accordance with the medical ethics and consent of patient. The obtained results are shown in Tables 2 and 3; the resulting accuracy is 91.62%.
Table 2.
Comparison between the proposed system and the hospital monitoring device

Table 3.
Continued from the previous table

A sample of ECG signal from the proposed system and the hospital monitoring device is shown in Figure 9.
Figure 9.
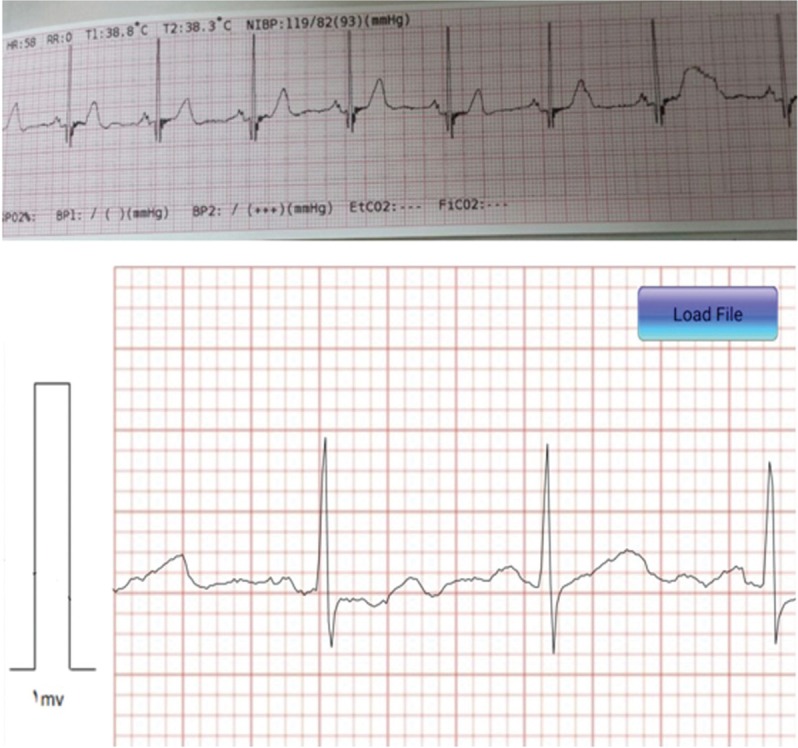
A sample of electrocardiographic signal from the designed system and the hospital monitoring device.
It should be noted that the hospital's ECG-monitoring device receives the patient's data for 10 s. Then, it determines the patient's number of heartbeat, which is multiplied by six to obtain the number of beats in 1 min. This method can lead to errors, because the behavior of heart differs during 60 s as a result of physiological, mental, or environmental changes. However, the error obtained from the continuous monitoring of the designed system in this method can result in more realistic result. For the current experiment, there was no difference in number of heartbeats and the system is considered accurate by the cardiologist.
Conclusion
In this article, a system was designed and built to receive, store, process, analyze, and display the heart electrical signal wirelessly on smartphone. This device has small size, light weight, low power consumption, and appropriate price. The doctor or the nurse is able to receive and observe the heart signal on their own smartphone only by installing the mobile application and loading the related file. This device is also capable of calculating the patient's calories consumption and storing the value. It also has a database consisting of medical and drug information for increasing the patient's awareness about the heart disease. The obtained results from the recording and displaying the heart signal on smartphone application have an acceptable compatibility with the results obtained from the hospital's standard monitoring device. The results of the proposed algorithm for determining the heartbeat indicate that this system is highly accurate, efficient, and cost-effective in medical diagnosis. In the future, further algorithms will be added to the system to diagnose other heart disease. Other feature such as R–R and P–R distance could be calculated from the ECG signal to recognize other arrhythmias and increase the overall recognition system's accuracy.
Financial support and sponsorship
This study is funded by “Mobile Heart Monitoring” research grant from the University of Qom, Iran.
Conflicts of interest
There are no conflicts of interest.
References
- 1.Nemati E, Deen M, Mondal T. A wireless wearable ECG sensor for long-term applications. IEEE Commun Mag. 2012;50:36–43. [Google Scholar]
- 2.Bawa K, Sabharwal P. ECG signal fibrillation classification on android platform: A survey approach. Int J Emerg Sci Eng. 2014;2:1–4. [Google Scholar]
- 3.The World Health Organization. The Top 0 Causes of Death. 2017. [Last accessed March 1, 2017]. Available from: http://www.who.int/mediacentre/factsheets/fs310/en/
- 4.Yap J, Noh Y, Jeong D. The deployment of novel techniques for mobile ECG monitoring. In J Smart Home. 2012;6:1–14. [Google Scholar]
- 5.Profis S. Do Wristband Heart Trackers Actually Work? A Checkup. 2014. [Last accessed March 1, 2017]. Available from: https://www.cnet.com/news/how-accurate-are-wristband-heart-rate-monitors/
- 6.Polar. Difference between Heart Rate and Pulse. 2017. [Last accessed March 1, 2017]. Available from: http://support.polar.com/en/support/Difference_Between_Heart_Rate_and_Puls .
- 7.Lin W-H, Wu D, Li C, Zhang H, Zhang Y-T. Comparison of heart rate variability from PPG with that from ECG. The International Conference on Health Informatics, ICHI 2013, Vilamoura, Portugal, November 07–09, 2013, Volume 42 of the series IFMBE Proceedings. :213–5. [Google Scholar]
- 8.Lu G, Yang F, Taylor JA, Stein JF. A comparison of photoplethysmography and ECG recording to analyse heart rate variability in healthy subjects. J Med Eng Technol. 2009;33:634–41. doi: 10.3109/03091900903150998. [DOI] [PubMed] [Google Scholar]
- 9.NeuroSkye. ECG vs PPG for Heart Rate Monitoring: Which is Best? 2015. [Last accessed March 1, 2017]. Available from: http://neurosky.com/2015/01/ecg-vs-ppg-for-heart-rate-monitoring-which-is-best/
- 10.Vijey J, Sathisha MS, Shivakumar KM. Android based portable ECG monitor. Int J Eng Comput Sci. 2013;2:32–7. [Google Scholar]
- 11.Rashkovska A, Kocev D, Trobec R. Clustering of heartbeat from ECG recordings obtained with wireless body sensors. Information and Communication Technology, Electronics and Microelectronics. 2016. [Last accessed May 5, 2017]. Available from: http://docs.mipro-proceedings.com/dcvis/dcvis_57_3989.pdf .
- 12.Lukowicz P, Anliker U, Ward J, Troster G. AMON: a wearable medical computer for high risk patients, Proceedings. Sixth International Symposium on Wearable Computers. 2001:133–4. [Google Scholar]
- 13.Pantelopoulos A, Bourbakis NG. A survey on wearable sensor-based systems for health monitoring and prognosis. IEEE Trans Syst Man Cybern. 2010;40:1–12. [Google Scholar]
- 14.Paradiso R, Loriga G, Taccini N, Gemignani A, Ghelarducci B. WEALTHY—a wearable healthcare system: new frontier on e-textile. J Telecommun Inf Technol. 2005. [Last Accessed May 5, 2017]. Available from: http://dlibra.itl.waw.pl/dlibra-webapp/Content/499/JTIT-2005_4_105.pdf .
- 15.Di Rienzo M, Rizzo F, Parati G, Brambilla G, Ferratini M, Castiglioni P. Shanghai: 2005. MagIC System: A new textile-based wearable device for biological signal monitoring. Applicability in daily life and clinical setting, IEEE Engineering in Medicine and Biology 27th Annual Conference; pp. 7167–9. [DOI] [PubMed] [Google Scholar]
- 16.Boniske A. Alivecor Heart Monitor. San Francisco, California: 2014. [Last accessed June 26, 2016]. Available from: www.alivecor.com . [Google Scholar]
- 17.Ebon G. Continuous Vital Sign Monitoring. ViSi Mobile by Sotera Wireless. San Diego, California: 2013. [Google Scholar]
- 18.Liu C, Zhu Q, Holroyd KA, Seng EK. Status and trends of mobile-health applications for iOS devices: A developer's perspective. J Syst Softw. 2011;84:2022–33. [Google Scholar]
- 19.Kallander K, Tibenderana JK, Akpogheneta OL, Strachan DL, Hill Z, ten Asbroek AHA, et al. Mobile health (mHealth) approaches and lessons for increased performance and retention of community health workers in low- and middle- income countries: A review. [Last accessed May 6, 2017];J Med Internet Res. 2013 15:e17. doi: 10.2196/jmir.2130. Available from: https://www.ncbi.nlm.nih.gov/pmc/articles/PMC3636306/ [DOI] [PMC free article] [PubMed] [Google Scholar]
- 20.Nasi G, Cucciniello M, Guerrazzi C. The role of mobile technologies in health care processes: The case of cancer supportive care. [Last accessed May 6, 2017];J Med Internet Res. 2015 17:e26. doi: 10.2196/jmir.3757. Available from: https://www.ncbi.nlm.nih.gov/pubmed/25679446 . [DOI] [PMC free article] [PubMed] [Google Scholar]
- 21.Tahat AA. Mobile personal electrocardiogram monitoring system and transmission using MMS. 2008 7th International Caribbean Conference on Devices, Circuits and Systems 2008. Cancun: 2008. pp. 1–5. [Google Scholar]
- 22.Choo K, Ling H, Low Y, et al. Beijing, China: 2014. Sep 25–28, Android based self-diagnostic electrocardiogram system for mobile healthcare, 3rd International Conference on Biomedical Engineering and Technology (iCBEB 2014) [Google Scholar]
- 23.Chen Ch. Web-based remote human pulse monitoring system with intelligent data analysis for home health care. Expert Syst Appl. 2011;38:2011–9. [Google Scholar]
- 24.Leijdekkers P, Gay V. Personal heart monitoring system using smart phones to detect life threatening arrhythmias. 19th IEEE Symposium on Computer-Based Medical Systems (CBMS’06) 2006. Salt Lake City, UT: 2006. pp. 157–64. [Google Scholar]
- 25.Rajan D, Spanias A, Ranganath S, Banavar MK, Spanias P. Health monitoring laboratories by interfacing physiological sensors to mobile android devices. IEEE Frontiers in Education Conference (FIE) 2013. Oklahoma City, OK: 2013. pp. 1049–55. [Google Scholar]
- 26.Gradl S, Kugler P, Lohmüller C, Eskofier B. Real-time ECG monitoring and arrhythmia detection using Android-based mobile devices. Annual International Conference of the IEEE Engineering in Medicine and Biology Society 2012. San Diego, CA: 2012. pp. 2452–5. [DOI] [PubMed] [Google Scholar]
- 27.AD8232. Sparkfunn Single Lead Heart Rate Monitor. USA: 2016. [Last accessed May 6, 2017]. https://cdn.sparkfun.com/datasheets/Sensors/Biometric/AD8232 . [Google Scholar]
- 28.Floyd T. Electronic Devices. 7th ed. USA: Pearson Education; [Google Scholar]
- 29.Pan J, Tompkins WJ. A real-time QRS detection algorithm. IEEE Trans Biomed Eng. 1985. [Last accessed May 06, 2017]. p. 32. Available from: http://www.robotsox.ac.uk/∼gari/teaching/cdt/A3/readings/ECG/Pan+Tompkins.pdf . [DOI] [PubMed]
- 30.Sörnmo L, Laguna P. Electrocardiogram (ECG) Signal Processing, Wiley Encyclopedia of Biomedical Engineering. 2006 [Google Scholar]
- 31.Vieira JAP. Algorithm development for physiological signals analysis and cardiovascular disease diagnosis—A data mining approach. MSc Thesis in Biomedical Engineering, University of Coimbra. 2011. [Last accessed May 6, 2017]. Available from: https://estudogeral.sib.uc.pt/bitstream/10316/17722/1/JVieira_tese.pdf .
- 32.Parak J, Havlik J. ECG Signal Processing and Heart Rate Frequency Detection Methods. 2011. [Last accessed May 6, 2017]. Available from: http://amber.feld.cvut.cz/bmeg/wp-content/uploads/2012/03/Parak-TCP-2011.pdf .
- 33.Borodin A, Pogorelov A, Zavyalova Y. Overview of algorithms for electrocardiograms analysis. Proceeding of the 13th Conference of FRUST Association. 2013. [Last accessed May 06, 2017]. Available from: http://cs.petrsu.ru/news/2013/fruct_spring/slides/yzavyalo_article.pdf .
- 34.Pingale SL. Using Pan Tompkin's method, ECG signal processing and diagnose various diseases in Matlab. Proceedings of IRF International Conference. 2014. [Last accessed May 06, 2017]. Available from: http://www.digitalxplore.org/up_proc/pdf/62-139756312157-61.pdf .
- 35.Shrivastava A, Chandra V, Sinha GR. Diagnosis of ECG signal and prediction of critical diseases for cardiac patients using MATLAB. Int J Adv Res Comput Commun Eng. 2016. [Last accessed May 6, 2017]. p. 5. Available from: http://www.ijarcce.com/upload/2016/december-16/IJARCCE%20102.pdf .
- 36.Deepu CJ, Zhang X, Heng CH, Lian Y. A 3-lead ECG-on-chip with QRS detection and lossless compression for wireless sensors. IEEE Trans Circuits Syst II: Expr Briefs. 2016;63:1151–5. [Google Scholar]
- 37.Reddy GK, Achari KL. A non invasive method for calculating calories burned during exercise using heartbeat. 2015 IEEE 9th International Conference on Intelligent Systems and Control (ISCO) Coimbatore: 2015. pp. 1–5. [Google Scholar]
- 38.Poyandegane rahe saadat. Iran, Tehran: [Last accessed July 17, 2016]. Available from: http://saadatco.com/ [Google Scholar]


