Figure 1.
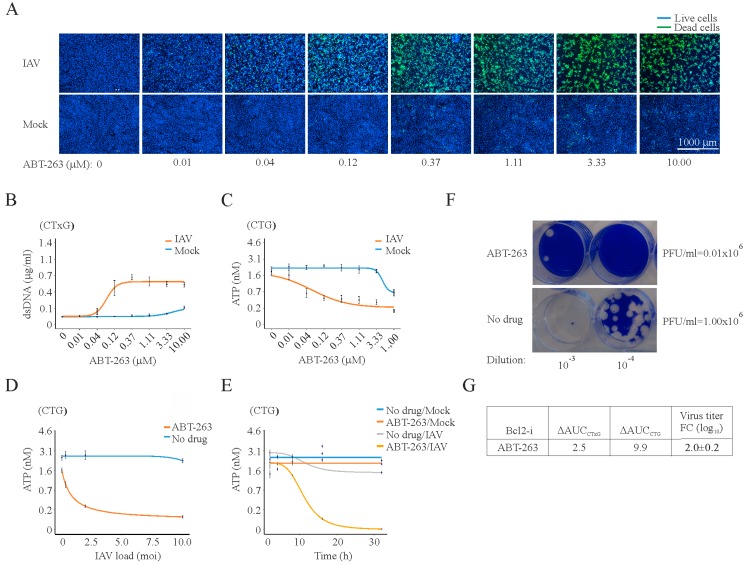
At 24 h post infection, ABT-263 kills influenza A (IAV)-infected but not mock-infected RPE cells and lowers the production of infectious viral particles. (A) Fluorescent microscopy images showing that increasing concentrations of ABT-263 kill IAV-infected (moi 3) but not mock-infected retinal pigment epithelium (RPE) cells at 24 h. Asymmetric cyanine dye stains the dsDNA of dead cells. Hoechst stains DNA in living cells; (B) quantification of dsDNA in dead cells using CellToxGreen cytotoxicity (CTxG) assay. Mean ± standard deviation (SD), n = 3; (C) quantification of intracellular ATP in living cells using CellTiter-Glo luminescent cell viability (CTG) assay. Mean ± standard deviation (SD), n = 3; (D) RPE cells were non- or ABT-263-treated (0.4 μM) and infected with IAV at moi 0.08, 0.4, 2, and 10. Cell viability was measured using a CTG assay 24 h after infection. Mean ± SD, n = 3; (E) RPE cells were non- or ABT-263-treated (0.4 μM) and mock- or IAV-infected (moi 3), and cell viability was measured using a CTG assay at the indicated time points. Mean ± SD, n = 3; (F) example of plaque assay measuring virus production in Bcl-2i- (3 µM) and DMSO-treated RPE cells at 24 hpi; (G) table summarizing the differential effect of ABT-263 on the viability of virus- and mock-infected cells, expressed as ΔAUCCxTG and ΔAUCCTG. It also shows the effect of ABT-263 on virus production in drug- (3 µM) and DMSO-treated RPE cells, which is expressed in log10 fold change (FC). Mean ± SD, n = 3.

