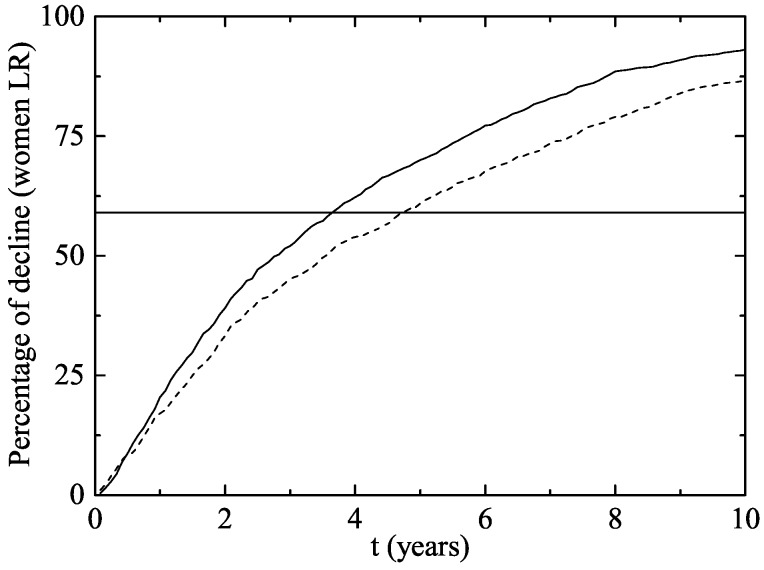
Figure 3.
Percentage of decline of women aged 14–26 infected of LR HPV 6 and/or 11 (and consequently of GW) after the implementation of the vaccination program in both scenarios (Scenario 1: solid line and Scenario 2: dotted line). The horizontal line represents the percentage of decline in Australian women wart cases after two years.

