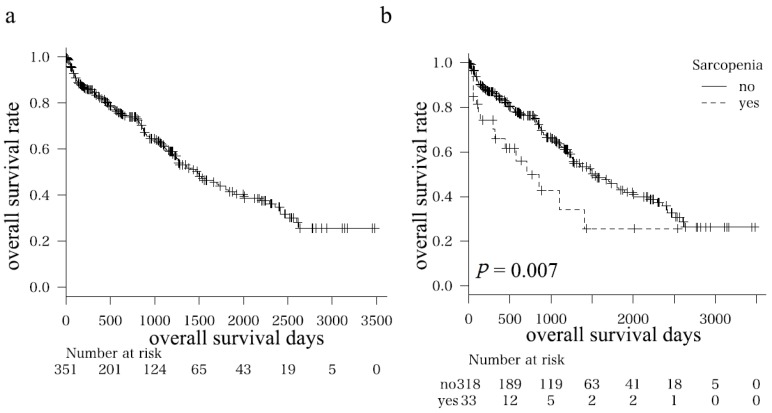
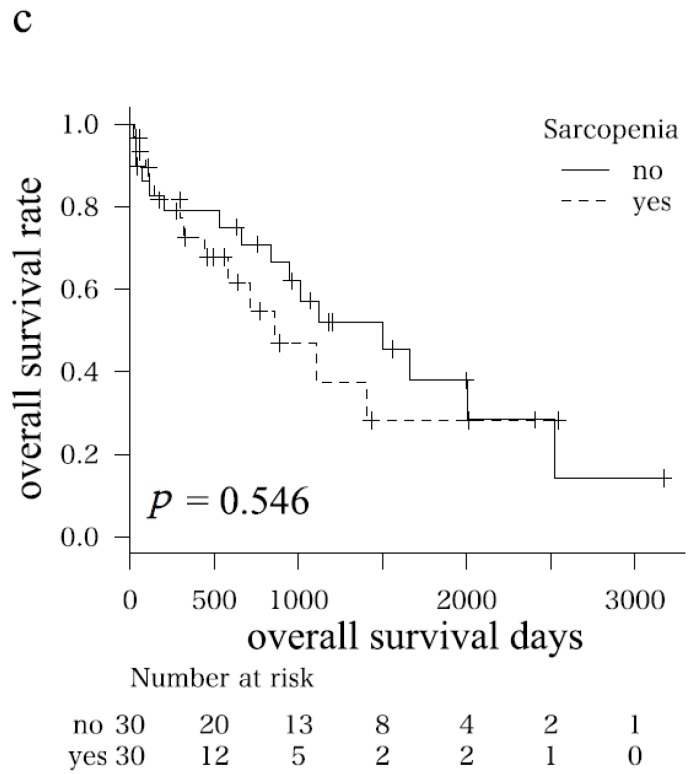
Figure 1.
Kaplan–Meier curves for overall survival time in (a) all patients; (b) subgroups (i.e., sarcopenia and non-sarcopenia groups); and (c) subgroups after adjustments for possible confounding factors (age, sex, Child–Pugh score, maximum tumor size, tumor number, and the degree of portal vein invasion) using propensity score matching analysis.


