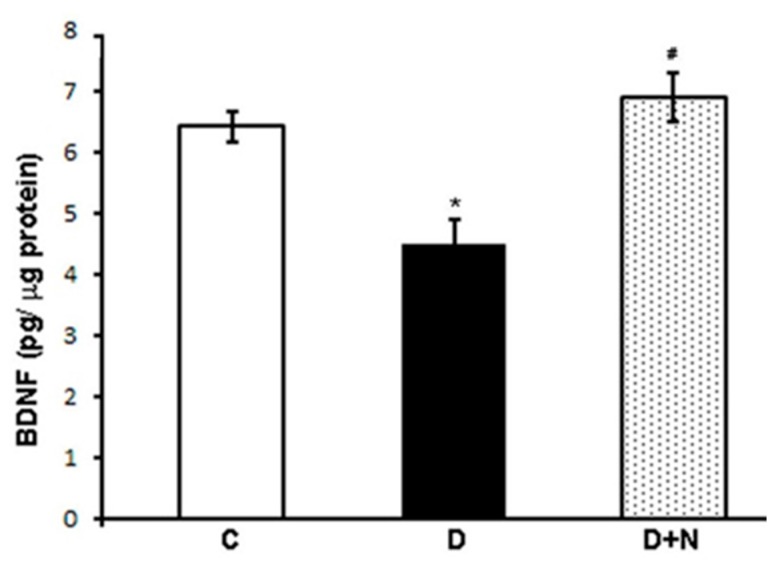
Figure 2.
Brain derived neurotrophic factor (BDNF) concentration in the retina of control, naringenin-treated, and non-treated diabetic rats. Values are means ± SEM; n = 6/group. *,# p < 0.05 compared to control and diabetic rats, respectively. C represents control, D as diabetic, and D + N as naringenin-treated diabetic rats.

