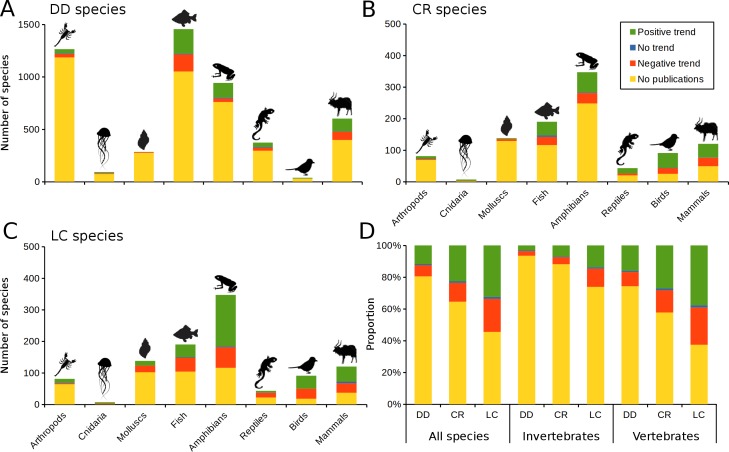
Figure 1. Influence of the IUCN Red List classification on research efforts.
Number of species revealing one of the three trends (i.e., positive, neutral, negative) in publication output, based on the mean number of publications per year per species before and after their classification as DD, CR or LC on the IUCN Red list of threatened species (derived from Web of Science; http://apps.webofknowledge.com). Publication trends were adjusted for the general growth rate of scientific publication (Larsen & Von Ins, 2010).

