Significance
We combine downscaled tropical cyclones, storm-surge models, and probabilistic sea-level rise projections to assess flood hazard associated with changing storm characteristics and sea-level rise in New York City from the preindustrial era to 2300. Compensation between increased storm intensity and offshore shifts in storm tracks causes minimal change in modeled storm-surge heights through 2300. However, projected sea-level rise leads to large increases in future overall flood heights associated with tropical cyclones in New York City. Consequently, flood height return periods that were ∼500 y during the preindustrial era have fallen to ∼25 y at present and are projected to fall to ∼5 y within the next three decades.
Keywords: tropical cyclones, flood height, New York City, sea-level rise, coastal flooding
Abstract
The flood hazard in New York City depends on both storm surges and rising sea levels. We combine modeled storm surges with probabilistic sea-level rise projections to assess future coastal inundation in New York City from the preindustrial era through 2300 CE. The storm surges are derived from large sets of synthetic tropical cyclones, downscaled from RCP8.5 simulations from three CMIP5 models. The sea-level rise projections account for potential partial collapse of the Antarctic ice sheet in assessing future coastal inundation. CMIP5 models indicate that there will be minimal change in storm-surge heights from 2010 to 2100 or 2300, because the predicted strengthening of the strongest storms will be compensated by storm tracks moving offshore at the latitude of New York City. However, projected sea-level rise causes overall flood heights associated with tropical cyclones in New York City in coming centuries to increase greatly compared with preindustrial or modern flood heights. For the various sea-level rise scenarios we consider, the 1-in-500-y flood event increases from 3.4 m above mean tidal level during 1970–2005 to 4.0–5.1 m above mean tidal level by 2080–2100 and ranges from 5.0–15.4 m above mean tidal level by 2280–2300. Further, we find that the return period of a 2.25-m flood has decreased from ∼500 y before 1800 to ∼25 y during 1970–2005 and further decreases to ∼5 y by 2030–2045 in 95% of our simulations. The 2.25-m flood height is permanently exceeded by 2280–2300 for scenarios that include Antarctica’s potential partial collapse.
Coastal flooding poses a major risk to New York City (NYC), which has nearly 49.7 million built square meters and 400,000 people living within the 100-y floodplain (1). The coastal flood risk was illustrated in 2012, when Hurricane Sandy’s storm surge of 2.8 m above the mean tidal level (MTL) at the Battery tide gauge produced an estimated $50 billion of damage to the region (2). Under a changing climate, the coastal flood risk to NYC is unknown. Flood risk depends not only on characteristics of tropical cyclones (TCs), extratropical cyclones, and their resultant storm surges, but also on rising sea levels, which combine with storm surge and tides to determine overall flood heights (2–5).
TCs can be approximated by a natural heat engine, or Carnot cycle (6), by which the climate system cools the oceans and atmosphere in the tropical zone. Given the predicted future warming of the atmosphere and surface-ocean waters (7), it is reasonable to expect that the climate system will generate more frequent or more intense TCs with different sizes and trajectories (8–17). However, the magnitude of changes in such TC characteristics is uncertain (3, 15–20). For NYC, the instrumental record of impacts from TC activity is too short to allow for either an accurate analysis of previous trends or to produce reliable predictions of future TC behavior. We can, however, gain insights into evolving coastal risk using an approach that involves the downscaling of state-of-the-art global climate models (GCMs) and generation of large numbers of synthetic TCs consistent with various plausible climate scenarios (3, 4, 17).
Relative sea levels will continue to rise over the next several centuries, although the magnitude of rise is uncertain (15, 21–23). The Intergovernmental Panel on Climate Change’s Fifth Assessment Report (AR5) projected a “likely” (>66% probability) global-mean sea-level rise (SLR) of 52–98 cm by 2100 relative to 1986–2005 in a high-emissions future [Representative Concentration Pathway (RCP) 8.5 scenario (24)] and indicated a global-mean SLR of 1 to >3 m by 2300 with medium confidence (15). However, AR5 projections of SLR are limited by uncertainties surrounding the response of the Greenland and Antarctic ice sheets (23). AR5 projected a likely contribution of the Antarctic ice sheet (AIS) of −8 to 15 cm under RCP8.5 by 2100, but a coupled ice sheet and climate dynamics model that includes marine ice-sheet instability, ice-shelf hydrofracturing, and marine ice-cliff collapse mechanisms suggests that the AIS could contribute more than 1 m by 2100, and more than 10 m by 2300, under RCP8.5 (25–27).
We assess NYC’s coastal flood risk over the next three centuries based on a combination of synthetic TCs, storm-surge models, and probabilistic SLR projections (21). The estimated flood risk does not account for the influence of the tidal cycle. Although TC and SLR projections out to 2300 have less confidence, we use them to illustrate the possible evolution of flood risk in NYC beyond the end of the current century.
Changing Storm Characteristics
We downscaled RCP8.5 simulations from three Coupled Model Intercomparison Project Phase 5 [CMIP5 (28)] models [Max Planck Institute Earth System Model (MPI), Coupled Climate System Model 4.0 (CCSM4), and Institut Pierre Simon Laplace Earth System Model (IPSL)] to compare storm-surge heights from the modern period (1970–2005; ∼5,000 storms for each model) with two future time periods (2010–2100 for all models and 2010–2300 for the IPSL model; ∼12,000 storms per century for each model). These three models (henceforth “core models”) were also used in ref. 4; thus, we can provide a preindustrial context for results presented here. We also consider changes to TC characteristics, including trajectories and wind speeds, for storms downscaled from four additional models (HadGEM, GFDL, MRI, and MIROC; henceforth “additional models”) that include the necessary output to generate synthetic storms in future simulations (Supporting Information).
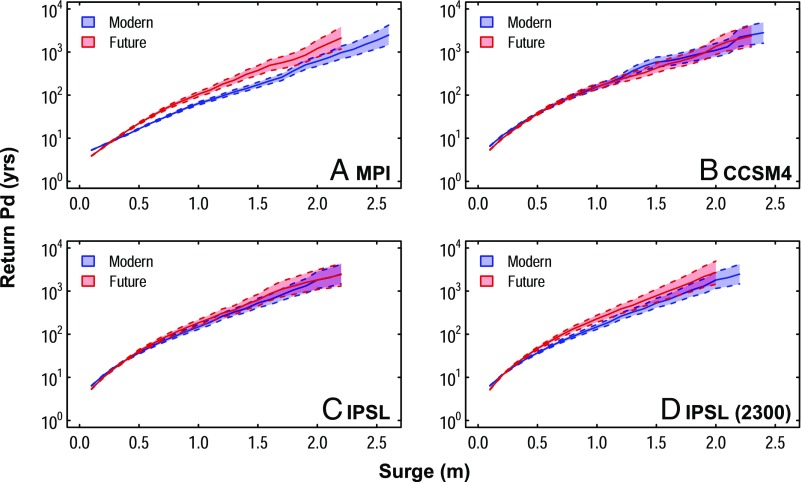
We first consider storm surge alone, which neglects the contribution of SLR to flood heights. Storm-surge return periods at the Battery tide gauge in NYC reveal either little change (CCSM4, IPSL to 2100), or slightly increased return periods (MPI, IPSL to 2300) between modern and future time periods (Fig. 1). For example, the 1,000-y storm surge in the IPSL model decreases from 1.8 m during 1970–2005 to 1.6 m during 2010–2300. This result differs from some previous studies of New York storm surge using CMIP3 models, which show a significant decrease of storm-surge return periods over the 21st century, mainly because of an increase of storm frequency and/or intensity (3, 17). In our simulations, changes to storm frequency for NYC are minimal in the future.
Fig. 1.
Return periods of storm-surge heights. Results are shown for the modern (blue) and future (red) periods for (A) the MPI model, (B) the CCSM4 model, (C) the IPSL model, and (D) the IPSL model where future simulations extend to 2300. The 95% credible interval of storm-surge events is shown in light blue for modern and in light red for future.
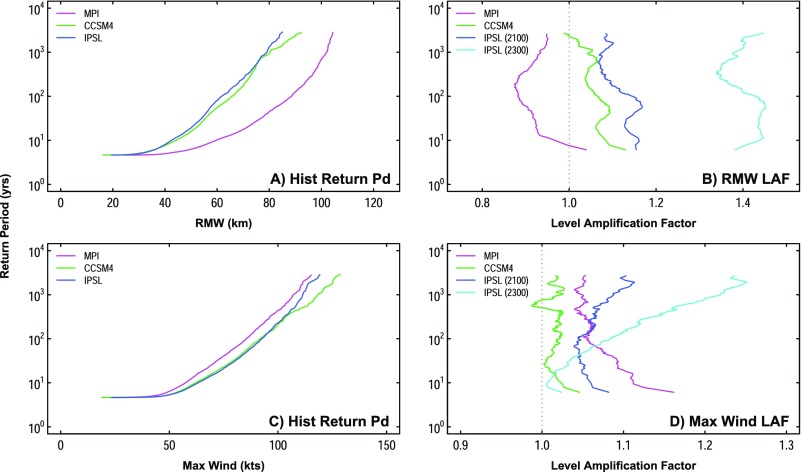
Principal component analysis (PCA) shows that modern and future storm surges are strongly impacted by TC radius of maximum wind (RMW) values, similar to preindustrial-era results (850–1800; ref. 4). Level amplification factors (LAFs) of modern return periods of RMW for the CCSM4 and IPSL models suggest larger RMW values in the future (Fig. S1). An increase in future RMW values was previously suggested in ref. 29. Larger RMW values may lead to higher wind speeds at fixed points from the storm center, which may lead to larger storm surges.
Fig. S1.
Return periods and LAFs of RMW and maximum wind. Return periods of (A) RMW values and (C) maximum wind speeds of TCs during the historic era. The LAF of the historic return periods for (B) RMW and (D) maximum wind are also shown, where LAF = (future value at given return period)/(historic value at given return period). LAF = 1 is shown by the gray dotted line.
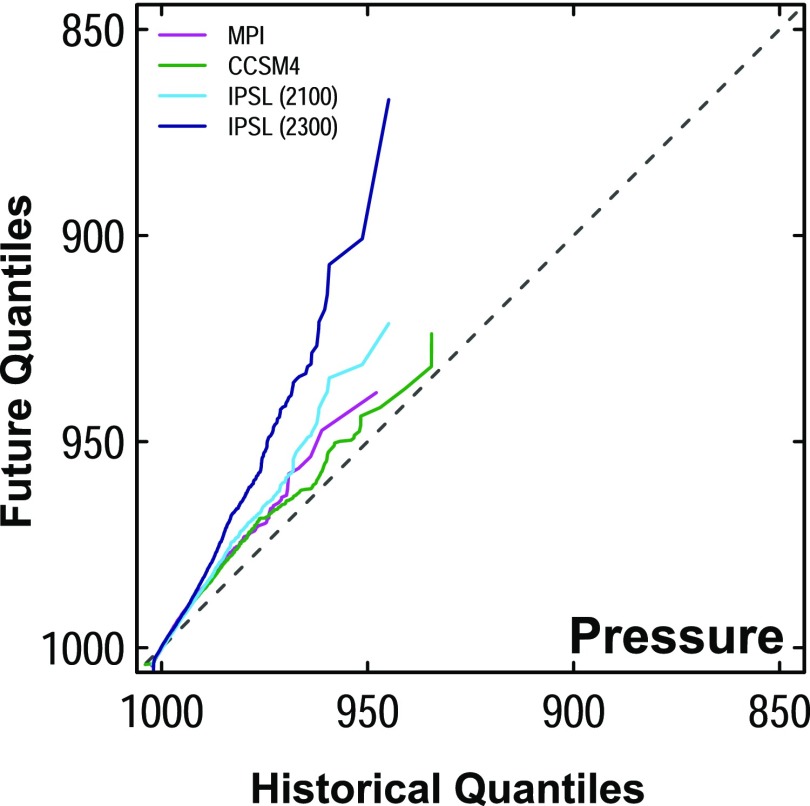
Variations in the maximum wind speed and minimum pressure of TCs from our core models also would tend to decrease storm-surge return periods. Maximum wind speeds increase (Fig. S1) and minimum storm pressures decrease (Fig. S2) between the modern and future time periods, indicating increases in future TC intensity. For example, nearly all of the LAF values calculated for maximum wind speed in the core models were greater than 1 (Fig. S1D), indicating that future maximum wind speeds consistently exceed modern maximum wind speeds for specific return periods. Thus, consistent with previous studies (3, 9, 10, 13), our results indicate increased intensity of future TCs.
Fig. S2.
Quantile–quantile plot of modern and future TC minimum pressure. Results are shown for MPI (magenta), CCSM4 (green), and IPSL (cyan) models from 2010 to 2100 and for the IPSL model from 2010 to 2300 (blue); pressure is considered at the time when each storm achieves its minimum distance from the Battery. The dashed line indicates the line y = x. Points that deviate from this line indicate that the two distributions being compared differ from one another.
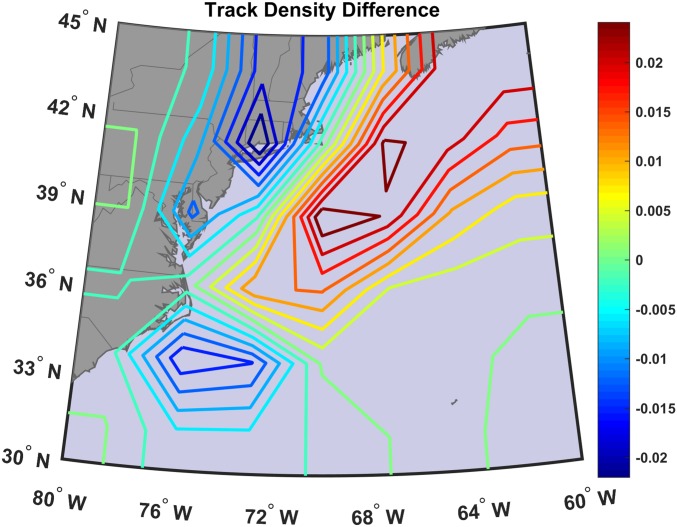
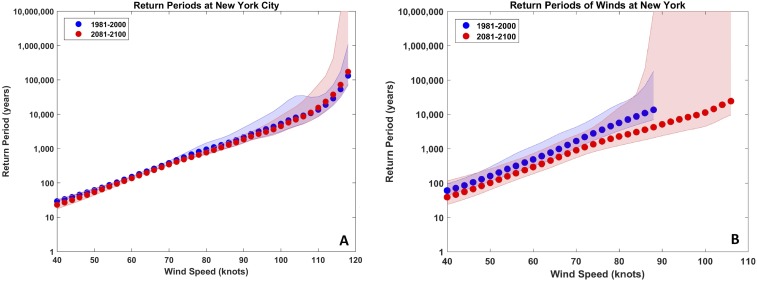
We suggest that changing TC tracks exert an important influence on future storm-surge heights in NYC (Fig. 2). In the core models, tracks move offshore between 1980–2000 (during the modern era) and 2080–2100 (during the future era). This is also true for tracks from the IPSL model in 2280–2300. The largest increase in track density (∼0.025) occurs offshore between ∼38–41 °N and ∼69–74°W; the Battery tide gauge is located at 40.7 °N, 74.015 °W. Four further metrics support the shift in TC track densities (Figs. S3–S5): (i) Annual mean maximum TC wind speeds on-site at the Battery tide gauge decrease from the modern to future time period across two out of three of our core models; (ii) TC winds become more westerly with time at the Battery in all core models; (iii) the minimum distance between TC centers and the Battery increases over time in the time series extended to 2300 from the IPSL model; and (iv) return periods of overall maximum wind speeds at the Battery (Fig. S6) show minimal changes between the modern and future time periods, suggesting a compensation between shifting tracks and increasing storm intensity in future simulations.
Fig. 2.
Multimodel mean difference between future and modern synthetic TC track densities from the MPI, CCSM4, and IPSL models. Track densities are determined by the sum total of tracks crossing through each grid box over 20-y periods from 2080–2100 and 1980–2000, divided by the area of that grid box and the number of years (21). Here the grid box latitude–longitude scales are determined by the output resolution of the model in question.
Fig. S3.
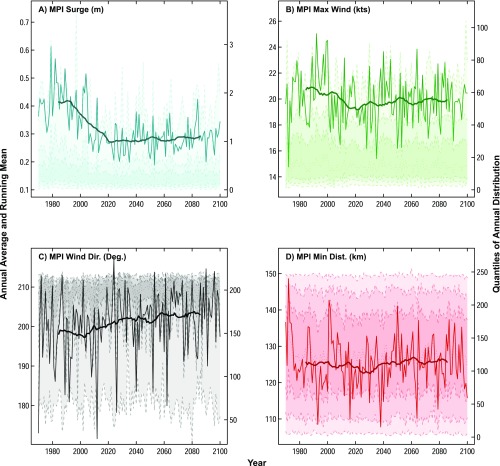
Time series of TC characteristics from the MPI model. Plotted on the left y axis are the annual-mean time series from 1970 to 2100 of (A) storm-surge height (meters), (B) maximum wind speed (knots), (C) wind direction (degrees), and (D) minimum distance to The Battery (kilometers), shown by thin solid lines in the foreground; 30-y moving window averages are shown by thick solid lines on each plot. In the background of each figure, and plotted on the right y axis, are the time series of the 0.005, 0.1, 0.25, 0.5, 0.75, 0.9, and 0.995 quantiles (dashed lines). Shading highlights the 0.005–0.995 (lightest), 0.1–0.9 (medium), and 0.25–0.75 (darkest) ranges.
Fig. S5.
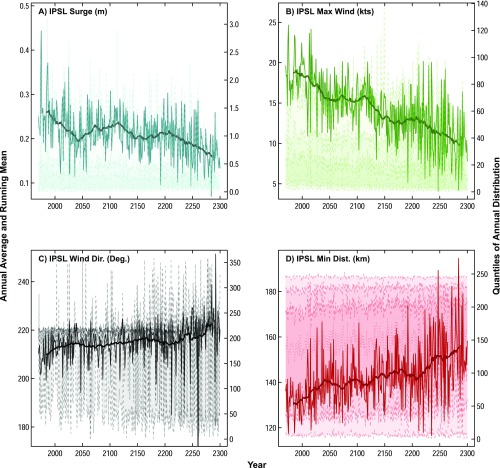
Time series of TC characteristics from the IPSL model. Plotted on the left y axis are the annual-mean time series from 1970 to 2300 of (A) storm-surge height (meters), (B) maximum wind speed (knots), (C) wind direction (degrees), and (D) minimum distance to The Battery (kilometers), shown by thin solid lines in the foreground; 30-y moving window averages are shown by thick solid lines on each plot. In the background of each figure, and plotted on the right y axis, are the time series of the 0.005, 0.1, 0.25, 0.5, 0.75, 0.9, and 0.995 quantiles (dashed lines). Shading highlights the 0.005–0.995 (lightest), 0.1–0.9 (medium), and 0.25–0.75 (darkest) ranges.
Fig. S6.
Return periods of peak wind speed at the Battery. (A) Mean return period of peak wind speed at the Battery for the MPI, CCSM4, and IPSL models during the time periods 1981–2000 and 2081–2100. (B) Mean return period of peak wind speed at The Battery for the MPI, CCSM4, IPSL, HadGEM, GFDL, MRI, and MIROC models during the time periods 1981–2000 and 2081–2100.
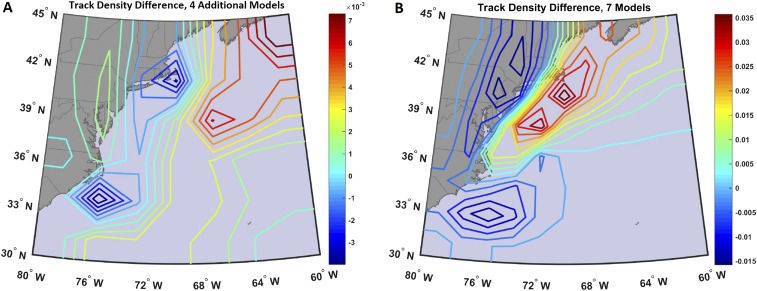
Projections from the four additional models are generally consistent with those from the core models. For example, the additional models also show an increase in the density of offshore tracks near NYC in 2080–2100 compared with 1980–2000, with the largest increases in densities occurring between ∼39–42 °N and ∼67–72 °W (Fig. S7A). Differences in return periods of overall maximum wind speeds at the Battery between the modern and future time period are minimal in the additional models, further supporting compensation between shifting TC tracks and increasing TC intensities in the future.
Fig. S7.
Changing TC track densities. (A) Multimodel mean difference between synthetic TC track densities from 2080 to 2100 and those from 1980 to 2000 for the HadGEM, GFDL, MRI, and MIROC models. (B) Multimodel mean difference between synthetic TC track densities from 2080 to 2100 and those from 1980 to 2000 for the MPI, CCSM4, IPSL, HadGEM, GFDL, MRI, and MIROC models.
The changing TC trajectories are consistent with findings from other studies of North Atlantic storms (30–34) completed using a diverse set of methodologies, including statistical models, stalagmite chronology, global best-track data and reanalysis data, and overwash deposits (30–33). Further, ref. 34 noted a poleward shift in the tracks of 21st-century extratropical cyclones simulated from CMIP5 models and indicated that changes to storm location and intensity likely combine to impact future surge events at the Battery, similar to our finding for TCs.
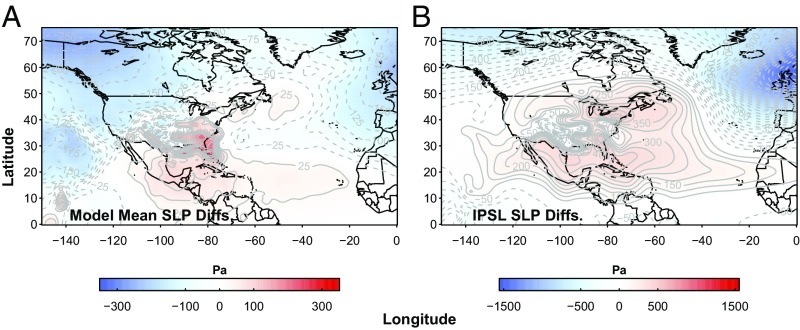
Changing patterns of sea-level pressure (SLP) for the core models favor an eastward shift in TC tracks, away from NYC (Fig. 3). Monthly mean SLP differences between the latter portions of the modern (1980–2000) and future (2080–2100) time periods during the months of August and September indicate future SLPs that are slightly higher (∼300 Pa) over the Atlantic coast of the United States and slightly lower (∼200 Pa) over the North Atlantic in the future (Fig. 3A). These pressure differences intensify by the end of the 23rd century in the IPSL model (Fig. 3B).
Fig. 3.
Mean August and September SLP differences. Pressure differences (pascals) are between (A) 2080–2100 and 1980–2000 for all three models and (B) 2280–2300 and 1980–2000 for the IPSL model. Color bars show the range of SLP differences.
Changing Flood Heights
We define flood height at the Battery tide gauge in NYC as the sum of storm surge and SLR. We treat storm surge and SLR as independent and linearly additive; nonlinear interactions of storm surge and SLR are expected to be small at the Battery (3, 17, 35). We do not consider the effects of changes in tidal amplitude (Methods).
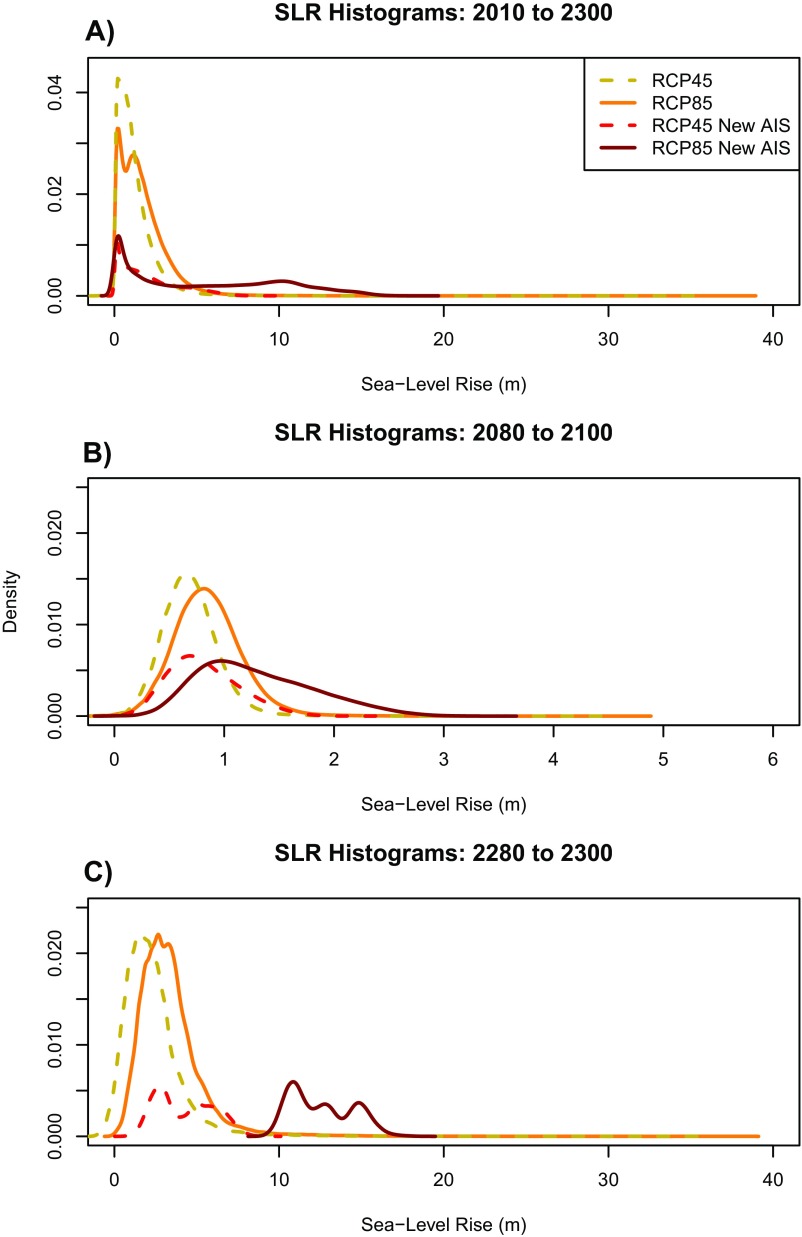
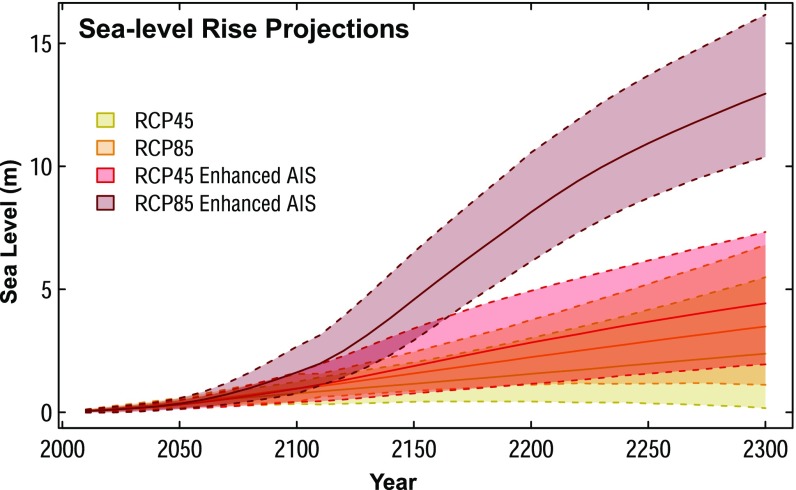
To estimate the effect of SLR on flood heights in NYC in 2100 and 2300, we combined the peak storm-surge height for each synthetic storm from the core models with samples of projected SLR for 2080–2100 and 2280–2300 (Fig. S8). For both RCP4.5 and 8.5 we consider two future SLR probability distributions. First, we employ probabilistic representations of ice-sheet mass loss, glacier mass loss, global mean thermal expansion, regional ocean dynamics, land water storage, and nonclimatic background processes from ref. 21 and extend those projections to 2300. Static-equilibrium fingerprints are used to translate changes in ice masses to local relative SLR. Second, we replace the AIS projections of ref. 21 with a small ensemble generated by ref. 26, incorporating marine ice-sheet instability, ice-cliff collapse, and ice-shelf hydrofracturing mechanisms (Fig. 4 and ref. 27).
Fig. S8.
Histograms of localized SLR projections for NYC. Results shown for (A) 2010–2300, (B) 2080–2100, and (C) 2280–2300 from ref. 21, in gold (RCP 4.5 scenario) and orange (RCP 8.5 scenario), and ref. 21 using an AIS contribution from ref. 26, in red (RCP 4.5 scenario) and burgundy (RCP 8.5 scenario). Distributions represent 10,000 MC samples of projected SLR from ref. 21. It should be noted that SLR distributions using the AIS contribution from ref. 26 are based on a limited number of model runs at this time and thus do not represent proper PDFs. The SLR distributions shown here are combined with future storm-surge heights to produce future flood heights.
Fig. 4.
Sea-level projections from 2010 to 2300. Projections are calculated using RCP4.5 (yellow) and RCP8.5 (orange) projections (21) and for projections combining AIS contributions from ref. 26 with the RCP4.5 (red) and RCP8.5 (dark red) projections from ref. 21. Lines and shaded regions represent the median and the central 95% credible interval.
Relative SLR at NYC is likely to be greater than the global mean, due primarily to the combined effects of glacial isostatic adjustment and the static-equilibrium fingerprint of AIS mass changes (21, 36). Under RCP8.5, relative SLR for NYC will very likely (P = 0.90) be 0.55–1.4 m (median of 0.96 m) between 2010 and 2100 and 1.5–5.7 m (median of 3.2 m) between 2000 and 2300. Our projections increase to 0.88–2.5 m (median of 1.5 m) and 10.7–15.7 m (median of 12.7 m) for 2100 and 2300, respectively, for the enhanced AIS input scenario (Fig. 4).
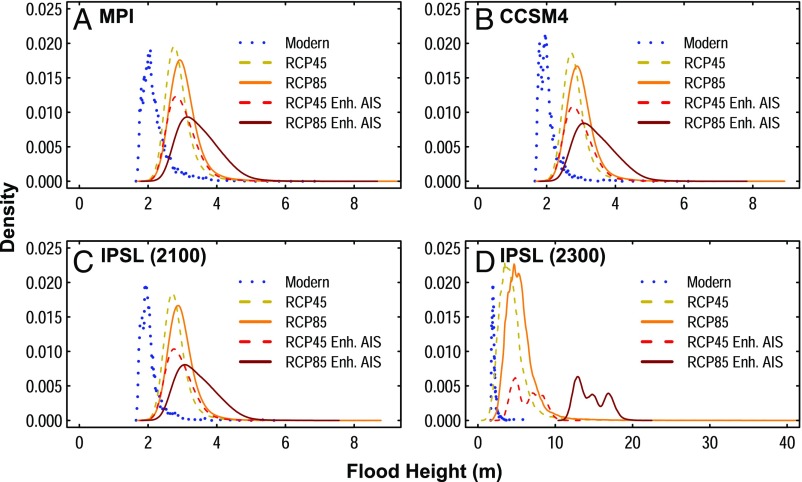
SLR causes future flood height distributions at 2080–2100 and 2280–2300 to be significantly greater than modern flood height distributions at the Battery tide gauge (P > 0.99 for all models and SLR projections; Fig. 5). Mean future (2080–2100) flood heights are 0.7–1.4 m greater than modern mean flood heights (Fig. 5 A–C). For the IPSL model (Fig. 5D), mean 2280–2300 flood heights are 2.4–13 m greater than modern mean flood heights.
Fig. 5.
Normalized distributions of flood heights. Distributions are for the modern (1970–2005) and future eras for flood heights calculated using the RCP4.5 and RCP8.5 SLR projections (21) and for flood heights calculated by combining enhanced AIS contributions (26) with the RCP4.5 and RCP8.5 SLR projections (21). Results are shown for future scenarios for (A) the MPI model, (B) the CCSM4 model, (C) the IPSL model, and (D) the IPSL model to 2300.
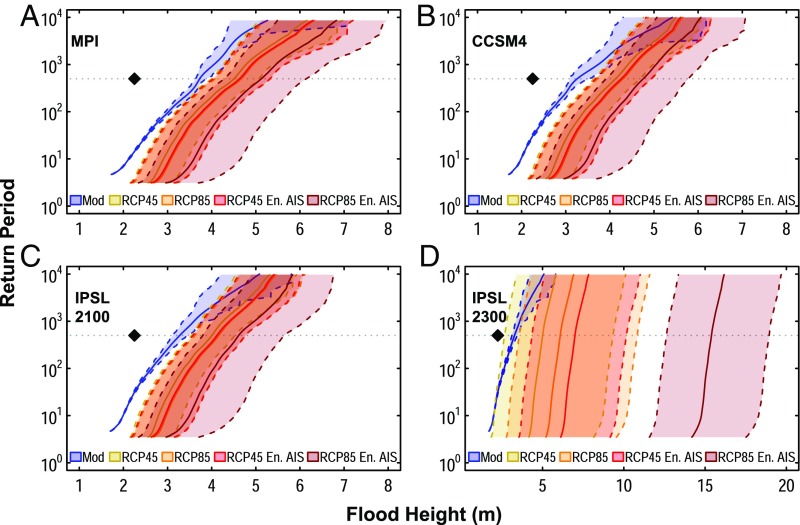
The changing return periods of flood heights for each of the three models for all SLR scenarios indicate the increasing risk of coastal flooding for NYC (Fig. 6 and Fig. S9). Reed et al. (4) found that, during the preindustrial period (850–1800), the average 500-y return period flood height across models was ∼2.25 m MTL at the Battery. Using a preindustrial-era baseline for sea level, the 500-y flood height increases to between 3.3 and 3.7 m MTL in all core models (Fig. 6) during the modern period (1970–2005). For simulations from 2080 to 2100, the mean 500-y flood height relative to the preindustrial baseline sea level is 4.0–5.1 m MTL (Fig. 6 A–C). Mean 500-y flood heights for the period 2280–2300 reflect the large uncertainty in SLR projections, with flood height values ranging from 5.0 m in the RCP4.5 scenario to 15.4 m for the RCP8.5 scenario using the enhanced AIS input (26), relative to the preindustrial baseline sea level.
Fig. 6.
Return periods of flood heights. Results are for the modern (1970–2005) and future eras for flood heights calculated using the RCP4.5 (yellow) and RCP8.5 (orange) SLR projections (21) and for flood heights calculated by combining enhanced AIS contributions (26) with the RCP4.5 (red), and RCP8.5 (burgundy) SLR projections (21). Results are shown for future simulations for (A) the MPI model, (B) the CCSM4 model, (C) the IPSL model, and (D) the IPSL model to 2300. The gray, horizontal dotted line on each plot indicates the 500-y return period, and the black diamond on each plot indicates the 500-y flood height (2.25 m) for the preindustrial era (4); mean and 95% credible intervals of flood heights for each return period are shown by the solid line and the shaded region between dashed lines on each plot.
Fig. S9.
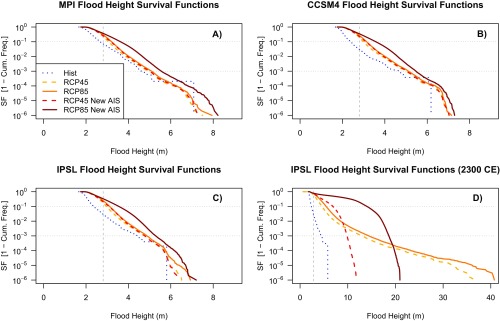
Survival functions of flood heights. Results are shown for the modern era (4) and future era for flood heights calculated using the RCP 4.5 (yellow) and RCP 8.5 (orange) SLR projections (21) and for flood heights calculated by combining AIS contributions from ref. 26 with the RCP 4.5 (red) and RCP 8.5 (burgundy) SLR projections from ref. 21. Survival functions are shown for (A) the MPI model, (B) the CCSM4 model, (C) the IPSL model, and (D) the IPSL model where future simulations extend to 2300. Gray, horizontal dotted lines on each plot indicate the 90th- and 99.9th-percentile event frequencies; the gray, vertical dashed line on each plot indicates the flood height associated with Hurricane Sandy in 2012.
The return period of the 2.25-m flood height decreases dramatically over time. The 2.25-m flood height has a return period of ∼500 y during the preindustrial era, which decreases to less than ∼25 y during the modern period. In 95% of simulations, the return period of such a flood decreases to ∼5 y between 2030 and 2045 (Table S1).
Table S1.
Decreasing return periods for 2.25-m flood height
| Scenario | 2.25-m flood height as an ∼1:10-y event | 2.25-m flood height as an ∼1:5-y event | ||
| Time period | 95% CI of return periods, y | Time period | 95% CI of return periods, y | |
| RCP 4.5 | 2010–2020 | 10.0–11.7 | 2030–2040 | 5.0–5.5 |
| RCP 8.5 | 2010–2020 | 9.6–11.7 | 2030–2040 | 4.8–5.2 |
| RCP 4.5 Enhanced AIS | 2015–2025 | 9.5–11.0 | 2035–2045 | 5.3–5.7 |
| RCP 8.5 Enhanced AIS | 2015–2025 | 9.1–10.5 | 2035–2045 | 5.0–5.4 |
Increases in future NYC flood heights have also been found in a number of previous studies (17, 20, 34). However, our inclusion of SLR scenarios that incorporate large contributions to SLR and overall flood heights from the AIS results in greater increases in flood heights at the Battery by the end of the 21st century than earlier studies. Although there is deep uncertainty in the contributions of the AIS to SLR, the potential for large contributions should not be neglected in risk assessment.
Discussion and Conclusions
We downscaled RCP8.5 simulations of three CMIP5 models to examine storm-surge heights and TC characteristics. There is minimal change or slightly increased storm-surge return periods (i.e., reduced risk) at the Battery tide gauge between modern and future time periods. Although there is a tendency for the strongest storms to strengthen with warming, storm tracks shift offshore at the latitude of NYC, offsetting the effects of increased storm intensity on storm surges at the Battery. However, stronger storms with shifted tracks could lead to more direct or severe TC impacts in other coastal regions, such as New England or northwestern Europe—an issue that merits further study. We note that a climate with stronger storms opens the possibility of a rare and very damaging event to the NYC region, even if such storms are typically routed away from the area.
As with any study involving GCMs, our results are subject to limitations related to the accuracy of modeled atmospheric–ocean dynamics, which drive the behavior and tracks of downscaled TCs. Of particular relevance is the limited skill of CMIP5 models in simulating the Atlantic meridional overturning circulation (AMOC) and Arctic sea ice loss (37, 38). Although CMIP5 models generally project a weakening of the AMOC by 2100, the degree of weakening varies greatly across individual models (37). In addition, although GCMs continue to improve their representation of Arctic sea ice loss, most CMIP5 models still underestimate observed trends (38). Biases in projections of both phenomena may impact TC trajectories.
In particular, underestimation of AMOC weakening may lead to an underestimation of the anomalously cool sea-surface temperatures that have been observed south of Greenland in the North Atlantic (39). Together with difficulty projecting Arctic sea-ice loss, this limitation may limit skill in modeling high-pressure patterns in the North Atlantic (e.g., refs. 40–44). Such high-pressure patterns could block TC paths to the north, directing more TC tracks toward NYC (similar to the path that Hurricane Sandy took in 2012). Moreover, a southerly bias in projections of the Gulf Stream path due to an underestimation of AMOC weakening could also reduce the number of TC tracks reaching NYC (45).
Beyond the limitations of GCMs, it should also be noted that, like many previous studies (3, 4, 17), we do not consider the extratropical transition of storms as they move to higher latitudes. The extratropical transition of TCs that impact the northeastern United States is not uncommon (46) and can result in storms such as Hurricane Sandy (2012), which generated devastating surges in NYC as a posttropical cyclone. Sediment records of coastal flooding near NYC support the idea that the frequency of major flood events may be underestimated in GCM studies (17).
Regardless of TC characteristics, SLR will greatly increase future flood risk for NYC, where SLR is projected to be more rapid than the global mean (21, 36). Sea levels are expected to continue rising for at least the next several centuries, more than offsetting any potential decreases in storm-surge heights (15, 17, 21–23).
Methods
Study Area.
We focus our study at the Battery in NYC. Storm-surge heights and flood heights are given relative to MTL, or the arithmetic mean of mean low water and mean high water at the Battery tide gauge over the present National Tidal Datum Epoch (1983–2001). The Battery tide gauge from the National Oceanic and Atmospheric Administration (NOAA) tide gauge network indicates that (i) the present great diurnal range (GT, the height difference between mean higher high water and mean lower low water) is 1.54 m, (ii) the present mean tidal range is 1.38 m, and (iii) the height difference between spring and neap tides is typically ∼0.5 m.
Synthetic TC Datasets.
The downscaling method described in refs. 47 and 48 is applied here to the core models for the CMIP5 RCP8.5 experiments. In this downscaling method, TC tracks are approximated with a beta-and-advection model, which uses synthetic wind time series at 850 and 250 hPa to determine storm motion (48). Methods applied to simulations of future TCs are the same as those described in the historical analysis presented in ref. 4, including the deterministic calculation of RMW values using the Coupled Hurricane Intensity Prediction System, or CHIPS, model (48). Our analysis applies the basin mean value of storms’ outer radius to all storms, which may induce a low bias in the estimated storm-surge distributions (refs. 17 and 49–51; see Supporting Information for further explanation).
Preindustrial-era TC and storm-surge datasets referred to here are the same as the preanthropogenic datasets described in ref. 4, and the modern-era surge and TC datasets referred to here are the same as the anthropogenic datasets used in ref. 4. Note that preindustrial and modern datasets contain ∼5,000 storms for each model. For reliable statistical analysis of future storm-surge heights in this region we use datasets that include more than 12,000 storms per century with centers that pass within 250 km of the Battery. Overall event frequency is calculated from the ratio of the total number of simulated TC events to the total number seeded.
Storm-Surge Modeling.
As in ref. 4, we apply the Advanced Circulation (ADCIRC) model (52) to simulate the storm surges induced by all synthetic storms. ADCIRC is a finite-element hydrodynamic model that has been successfully used to simulate and forecast storm-surge events for coastal regions (e.g., refs. 53 and 54). The numerical grid and modeling specifics used here were developed by Lin et al. (3) and used in refs. 4 and 17.
Consistent with previous work, storm surge is defined here as the anomalous rise of water above MTL, and flood height is defined as the sum of storm surge and change in relative sea level (4, 17). Storm-surge height is primarily determined by a TC’s wind patterns and track, coastal geography, and, to some extent, the reduced atmospheric pressure associated with a storm. Storm-surge heights are thus highly dependent upon the TCs that generate them, as they are significantly affected by TC characteristics, including intensity, size, duration, and location (3, 4, 13). The effect of changes in wave setup for the region is expected to be small and is not included in our storm-surge calculations.
Additionally, although there has been some work indicating that interactions between storm surge and tide are not strictly linear (3), flood heights are calculated here relative to MTL, and a full tidal cycle is not accounted for in our discussion of changing flood heights from the preindustrial era to the future. It is possible that tides may evolve in a changing climate (55). Although recent work suggests that changing bathymetric depth has little influence at the Battery, evidence does support a strong, approximately linear relationship between GT and the bathymetric depth of Long Island Sound (56). Further, tides can be very important in determining overall flooding, influencing the highest water levels reached during a storm-surge event (2, 56). The influence of tides upon overall flood heights varies greatly from storm to storm (Supporting Information) but is likely to be most significant with large or slow-moving TCs, such as Hurricane Sandy. Tidal contributions to overall flood heights are well-documented for major historical TCs impacting NYC, including the 1938 New England Hurricane (40% tidal contribution to the overall 1.57-m storm tide), Hurricane Donna (1960; 29% tidal contribution to the overall 2.30-m storm tide), Hurricane Gloria (1985; 12% tidal decrease of the 1.9-m surge to a 1.7-m storm tide), and Hurricane Sandy (19% tidal contribution to the overall 3.47-m storm tide; ref. 2). Thus, our decision to make our calculations using the MTL tidal datum constitutes an important caveat for this work.
We use a linear combination of storm surge and sea level (from proxy records and SLR projections) to generate flood heights at the Battery. To view the results presented here in the context of the historical analysis presented in ref. 4, future sea level from SLR projections for each year was adjusted to be relative to a preindustrial-era baseline (4, 57).
Ref. 3 shows that, especially for SLR amounts of about 1.8 m or less, the nonlinear effect of SLR on storm-surge heights at the Battery is very small; ref. 35 also demonstrates similar flood levels at the Battery for both static and dynamically modeled floods of up to about 5.8 m. However, while such a linear combination of surge and SLR may provide a close approximation, it may also result in a slight underestimation of final flood heights (58, 59), which could cause some of the flood heights presented here to be somewhat lower than what we would expect if SLR were fully integrated into ADCIRC.
Future SLR Projections.
For the future mean sea levels upon which simulated storm-surge events occur, we use 10,000 Monte Carlo (MC) samples of projected sea level at the Battery for both the RCP4.5 and RCP8.5 scenarios, based upon the framework of ref. 21. SLR projections are developed based on the CMIP5 archive for thermal expansion and ocean dynamics, surface-mass balance modeling for glacier melt, a combination of the AR5 expert assessment and the expert elicitation of ref. 60 for ice-sheet contributions, semiempirical modeling of land water storage, statistical modeling of nonclimatic local sea-level change, and geophysical modeling of gravitational, elastic, and rotational effects on local sea level (21). We also generated a set of projections in which we replaced the west and east AIS projections of ref. 21 with random samples from the 5- to 20-m Pliocene, non-bias-adjusted RCP4.5 and RCP8.5 ensembles of ref. 26. It should be noted that ref. 26 was not attempting to construct a probability distribution of future AIS changes; its ensemble of 29 members can be viewed neither as spanning the full range of possibilities with minimal gaps nor as having a defined probability associated with each member. Thus, the distribution of this second set of projections may be viewed as a frequency distribution from a modeled set of possible futures, but not as a probability distribution of future SLR (27).
The projections used here differ from those of refs. 21 and 26 in two important ways. First, the projections are extended to 2300, while those of ref. 21 ended in 2200. For the ocean dynamic and thermal expansion components we achieve this extension by continuing to use GCM projections that extend to 2300. For glacier projections we do the same using surface-mass balance projections driven by GCM projections extending to 2300. For the Greenland ice sheet and for AIS in the ensemble consistent with AR5 we continue the linear growth of ice-sheet melt rates beyond 2200. Second, for the ensemble employing the AIS projections (26), we employ the full time series of projections; only 2100 and 2500 values are reported in ref. 26.
Preindustrial and modern relative sea level datasets used in this study to calculate flood heights during these time periods are the same as those described in ref. 4, developed from relative sea-level reconstructions in southern New Jersey (57).
Statistics.
Distributions of TC characteristics used to calculate return periods and LAFs (Fig. S1) are produced by generating 25,000 bootstrap samples of ∼5,000 events for both the modern and future time periods (61). Similarly, distributions of storm surges used to calculate mean and 95% credible intervals of storm-surge return periods (Fig. 1) are produced by generating 100,000 bootstrap samples of ∼5,000 storm-surge events for both the modern and future time periods. Additionally, distributions of flood heights used to calculate return periods over short time periods (2080–2100 and 2280–2300; Fig. 6) are produced by generating 100,000 bootstrap samples of 2,835 storm-surge events from the time period of interest in the original storm-surge dataset and combining each bootstrap sample with a randomly selected SLR time series from the MC samples.
We use PCA to analyze variations and patterns between TC characteristics and storm surge. In addition, we examine LAFs to compare modern and future return periods. We define the LAF of a variable as the ratio of the variable’s future value to its modern value for a given return period; it indicates the degree to which the variable increases or decreases in the future compared with the modern era.
Data Availability.
Data used here are publicly available from the Earth System Grid Federation website (https://www.earthsystemgrid.org/home.html). SLR projections were generated using ProjectSL (https://github.com/bobkopp/ProjectSL) and LocalizeSL (https://github.com/bobkopp/LocalizeSL). Researchers interested in downscaled fields may contact coauthors K.A.E. or A.J.G. via email with their request.
Level Amplification Factors of Storm Characteristics
The LAF of a storm characteristic is defined as
| [S1] |
Thus, an LAF >1 indicates an increase in the magnitude of the quantity for a given return period in the future, while an LAF <1 indicates a decrease in the magnitude of the quantity for a given return period in the future. Fig. S1 shows LAFs of modern return periods for storm RMW and maximum wind values.
Changing Minimum Storm Pressure
Fig. S2 shows the quantile–quantile plot of modern and future minimum TC pressures when the storms are nearest the Battery.
Calculation of RMW Values for Downscaled Storms
The basin mean value of storms’ outer radius is applied in this study to all storms. The outer radius is defined here as the distance from the storm center at which the azimuthal component of the surface wind (associated with the storm) vanishes. It is typically about 400 km but varies greatly among individual storms. However, it usually does not vary much during the lifetime of any particular storm (48–51). In our downscaling process the RMW is calculated from the dynamical model, given a storm outer radius of 500 km. The RMW value varies a great deal both among individual storms and throughout the lifetime of an individual storm.
Here, scaling of the outer radius remains the same for both the modern and future climates. There is some evidence from theory and from somewhat idealized models that the outer radius becomes systematically larger as the climate warms (50, 51); thus, as noted in the main text, we may induce a low bias in RMW values by keeping the scaling of the outer radius the same in simulations of storms in the future climate as in the modern climate. For example, if we were to assume a 10% increase in RMW values under future climates (16), we find that changes in storm wind profiles result in an ∼5% increase in future wind speeds at the Battery across our models, compared with wind speeds from profiles calculated using the original RMW values (50, 51).
Potential TC Track Changes Near the Battery
To varying degrees, the core models show a shift in TC tracks, with fewer storm centers coming close to the Battery, which influences trends in wind speed and wind direction near the Battery, as well as storm minimum distance to the Battery (Figs. S3–S5). Although maximum wind speeds of individual storms increase in the future when storms are nearest the Battery (Fig. S1), overall trends in wind speeds modeled precisely at the Battery across models are less robust due to competing effects from shifting tracks and increasing peak storm strengths (i.e., Figs. S3–S5, S6A).
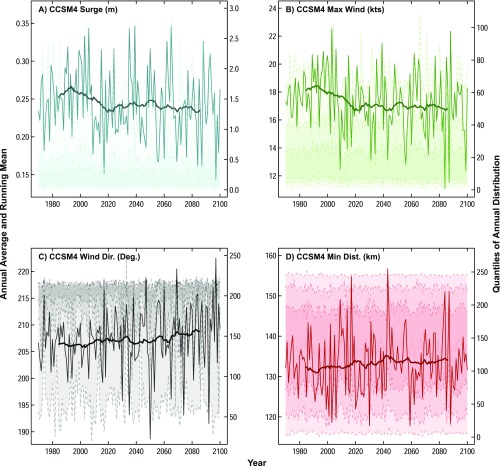
The dark lines in the foreground of Figs. S3–S5 indicate annual means of the TC variables on the plot, revealing potential changes in TC variables over time. However, each year includes more than 100 storms. As can be seen from quantiles plotted in the background of these figures, the annual distributions of some of these variables include large tails, which are relevant when considering the evolution of TC characteristics at the Battery over time.
Ultimately, negative trends that are statistically significantly different from 0 occur for the annual mean surge in all models [MPI (Fig. S3A): trend and 90% CI = −1.14 × 10⁻³ ± 0.11 × 10⁻³ m/y; CCSM4 (Fig. S4A): trend = −1.54 ×10⁻⁴ m/y, 90% CI = −2.39 × 10⁻⁴ to −6.40 ×10⁻⁵ m/y; IPSL (Fig. S5A): trend and 90% CI = −2.16 × 10⁻⁴ ± 0.18 × 10⁻⁴ m/y], and the annual mean maximum wind in CCSM4 and IPSL [CCSM4 (Fig. S4B): trend and 90% CI = −1.09 × 10⁻² ± 0.5 × 10⁻² knots (kt)/y; IPSL (Fig. S5B): trend and 90% CI = −2.67 × 10⁻² ± 0.11 × 10⁻² kt/y]. Positive trends that are significantly different from zero occur for all models in annual mean wind direction at the Battery, indicating a trend toward more westerly winds at this location [MPI (Fig. S3C): trend = 5.41 × 10⁻² degrees/y, 90% CI = 4.59 × 10⁻² to 6.16 × 10⁻² degrees/y; CCSM4 (Fig. S4C): trend and 90% CI = 2.46 × 10⁻² ± 0.64 × 10⁻² degrees/y; IPSL (Fig. S5C): trend = 2.54 × 10⁻² degrees/y, 90% CI = 2.25 × 10⁻² to 2.90 × 10⁻² degrees/y]. The IPSL model exhibits a positive trend in the annual mean minimum storm distance to the Battery that is statistically significantly different from zero, indicating that storms are moving farther away from the Battery over time [IPSL (Fig. S5D): trend and 90% CI = 6.29 × 10⁻² ± 0.52 × 10⁻² km/y]. The trends in annual mean minimum distance are not statistically different from 0 for the MPI and CCSM4 models [MPI (Fig. S3D): trend and 90% CI = −8.61 × 10⁻³ ± 2.3 × 10⁻² km/y; CCSM4 (Fig. S4D): trend and 90% CI = 1.26 × 10⁻² ± 2.24 × 10⁻² km/y], and the trend in annual mean maximum wind from the MPI model is also not statistically different from 0 [MPI (Fig. S3B): trend = −3.64 × 10⁻³ kt/y, 90% CI = −9.03 × 10⁻³ to 1.02 × 10⁻³ kt/y].
Fig. S4.
Time series of TC characteristics from the CCSM4 model. Plotted on the left y axis are the annual-mean time series from 1970 to 2100 of (A) storm-surge height (meters), (B) maximum wind speed (knots), (C) wind direction (degrees), and (D) minimum distance to The Battery (kilometers), shown by thin solid lines in the foreground; 30-y moving window averages are shown by thick solid lines on each plot. In the background of each figure, and plotted on the right y axis, are the time series of the 0.005, 0.1, 0.25, 0.5, 0.75, 0.9, and 0.995 quantiles (dashed lines). Shading highlights the 0.005–0.995 (lightest), 0.1–0.9 (medium), and 0.25–0.75 (darkest) ranges.
The minimum distance calculations include only a magnitude, not a direction. Thus, it is possible to have a shift in storm tracks that would not be apparent in the minimum distance variable. For example, a storm with a track that takes it 50 km to the west of the Battery would have the same minimum distance value as a storm with a track that traveled 50 km to the east of the Battery. Although there would be a spatial shift in this example, it would not show up in the minimum distance calculations. However, all of the core models consistently show more westerly winds at the Battery over time. Thus, it is reasonable to assume that the spatial shift is not apparent in the minimum distance time series that extend only to 2100 (MPI and CCSM4), but, as the tracks continue to shift throughout time, the shift is eventually substantial enough to be reflected in the minimum distance values in the IPSL time series that extends to 2300, with later tracks presumably moving farther east than their more westerly counterparts from earlier in the time series.
As noted in the main text, this work investigates only a small “core” set of CMIP5 models, consistent with those used in ref. 4, in an attempt to investigate future changes to flood risk in NYC in the context of the historical analysis presented in that study. Although the core models all seem to indicate, to varying degrees, a shift in TC tracks away from the Battery in NYC, there is a great deal of uncertainty associated with modeling future TC tracks. The inclusion of additional models in future work may help to provide a more complete understanding of expectations for TC track behavior under future climate simulations.
Fig. S7A shows shifting TC track densities for four additional models—the Hadley Centre Global Environment Model (HadGEM), the Geophysical Fluid Dynamics Laboratory (GFDL) model, the Meteorological Research Institute (MRI) model, and the Model for Interdisciplinary Research on Climate (MIROC)—and Fig. S7B shows shifting TC track densities for the set of seven models that includes these four models as well as the core models. The offshore track shift near NYC observed in Fig. 2 in the core models appears to be fairly robust across models when we add the four additional models here.
In addition to TC trajectories, we also consider the return period of TC wind speed at the Battery for two subsets of models. Fig. S6A shows the mean return period of TC wind speed during both the modern and future eras at the Battery for the core models and indicates very little difference between the two time periods. Fig. S6B shows the mean return period of TC wind speed during both the modern and future eras at the Battery for the combination of the core models and additional models. Using this larger set of models, Fig. S6B indicates a possible increase in wind speed at the Battery in future simulations, although this increase is of doubtful significance.
These results highlight the large uncertainty in future TC tracks and the impact those tracks could ultimately have on storm-surge heights at the Battery. Additional research should investigate more thoroughly the relationship and potential compensation between increases in storm intensity and offshore track shifts of TCs impacting the Battery under future scenarios.
Future SLR Projections
Fig. S8 shows histograms of localized SLR projections.
Future Flood Heights: 2010–2100 and 2010–2300
For flood height distributions from 2010 to 2100, mean future flood heights range between 0.4 m (MPI model RCP 4.5 SLR scenario) and 0.7 m (CCSM4 model RCP 8.5 SLR scenario with AIS contribution from ref. 26) greater than modern mean flood heights. For flood height distributions from the IPSL model from 2010 to 2300, mean future flood heights range between 1.3 m (RCP 4.5 SLR scenario) and 5.6 m (RCP 8.5 SLR scenario with AIS contribution from ref. 26) greater than modern mean flood heights.
Considering increasing flood risk from 2010 to 2300, survival functions show that a typical 90th-percentile flood event is projected to increase from a 2.4-m flooding event in the modern era in the IPSL model to a 4.6-m event for the RCP 4.5 SLR scenario and to a 9.8-m event for the RCP 8.5 SLR scenario with the AIS contribution from ref. 26 (Fig. S9). The 99.9th-percentile flood event is projected to increase from a 4.4-m flooding event in the modern era to a 13-m event during the 2010–2300-time period for the RCP 4.5 SLR scenario and to a 19-m event during the 2010–2300-time period for the RCP 8.5 SLR scenario with the AIS contribution from ref. 26 (Fig. S9D).
Decreasing Return Periods of a 2.25-m Flood Height
Table S1 details the changing return period of a 2.25-m flood height throughout time as an average across the core models for the various SLR scenarios we consider here. We calculate the average return period of a 2.25-m flood height across our core models for 10-y intervals, in an effort to estimate the time period in which such a flood becomes a 1-in-10-y event and a 1-in-5-y event. Note that, because of differing methodology in the RCP 4.5 and RCP 8.5 SLR scenarios compared with the RCP 4.5 and RCP 8.5 SLR scenarios that include the AIS contributions from ref. 26, there are some differences in the time periods of when the 2.25-m flood height reaches various return-period thresholds. However, despite differing methodology, there is still a 5-y overlap in the time periods presented here between the various SLR scenarios, increasing confidence in the approximate timeline indicated in the main text.
Impacts of Tides upon Changing Flood Heights
As noted in the main text, tides can be very important in determining overall flood heights, although we do not account for a full tidal cycle in our calculations. The impact of the tidal cycle on any given flood height is dependent upon the time at which the peak surge occurs within the tidal cycle; thus, the size and speed of individual TCs play a large role in determining how much of an impact tides have on a given flood height. For example, it is far more likely that a storm-surge event will overlap with a high tide in the case of large, slow-moving storms such as Hurricane Sandy, compared with smaller storms moving through the region more quickly. Thus, the influence of tides upon overall flood heights will vary greatly from storm to storm; however, we can contemplate idealized examples that allow us to consider the potential impact of tidal cycles on flood heights in a general sense.
TC size is highly variable. Hurricane Sandy serves as an example of an unusually large TC, with a diameter of more than 1,600 km before landfall, making it the largest TC ever recorded in the Atlantic (62). Alternatively, Hurricane Andrew (1992) was an exceptionally small Atlantic TC, with a diameter of only about 150 km (63). According to the University Corporation for Atmospheric Research, although TC sizes are extremely diverse, a “typical” size of a TC is about 483 km.
Let us consider a TC with a diameter of ∼500 km. Suppose that the translation speed of this TC in the midlatitudes is about 40 km/h. If we assume a track for the TC such that the storm produces onshore winds in a given location for the length of the storm (500 km), we find that the storm could produce on-shore winds for about 12.5 h, making it almost certain that this idealized TC would produce a surge that coincides with a high tide if we assume a tidal cycle of about 12 h. This example portrays a highly idealized situation; however, it illustrates potential for tides to have significant influence upon overall flood heights, and indicates that many of our results may be somewhat conservative since we do not incorporate tides into our analysis.
Supplementary Material
Acknowledgments
We thank Sonya Miller for technical assistance and David Titley, Raymond Najjar, and Gregory Garner for advice, comments, and input. We acknowledge the World Climate Research Programme’s Working Group on Coupled Modeling, which is responsible for CMIP, and we thank the MPI, CCSM4, IPSL, HadGEM, GFDL, MRI, and MIROC climate modeling groups for producing and making available their model output. This work was supported by NOAA Grants 424-18 45GZ and NA11OAR4310101, NSF Grants OCE 1458904, EAR 1520683, ATM-1446329, and EAR Postdoctoral Fellowship 1625150, the Community Foundation of New Jersey, and David and Arleen McGlade. For CMIP the US Department of Energy’s Program for Climate Model Diagnosis and Intercomparison provides coordinating support and led development of software infrastructure in partnership with the Global Organization for Earth System Science Portals. We acknowledge PALSEA2 (Palaeo-Constraints on Sea-Level Rise), which is a working group of Past Global Changes/IMAGES (International Marine Past Global Change Study) and an International Focus Group of the International Union for Quaternary Research, and International Geoscience Programme (IGCP) Project 639, “Sea Level Change from Minutes to Millennia.” This research is supported by the National Research Foundation Singapore and the Singapore Ministry of Education under the Research Centres of Excellence initiative. This is Earth Observatory of Singapore contribution 161.
Footnotes
The authors declare no conflict of interest.
This article is a PNAS Direct Submission.
See Commentary on page 11806.
This article contains supporting information online at www.pnas.org/lookup/suppl/doi:10.1073/pnas.1703568114/-/DCSupplemental.
References
- 1. NYC Special Initiative for Rebuilding and Resiliency (2013) A stronger, more resilient New York (PlaNYC, New York)
- 2.Kemp AC, Horton BP. Contribution of relative sea-level rise to historical hurricane flooding in New York City. J Qua Sci. 2013;28:537–541. [Google Scholar]
- 3.Lin N, Emanuel KA, Oppenheimer M, Vanmarcke E. Physically based assessment of hurricane surge threat under climate change. Nat Clim Chang. 2012;2:462–467. [Google Scholar]
- 4.Reed AJ, et al. Increased threat of tropical cyclones and coastal flooding to New York City during the anthropogenic era. Proc Natl Acad Sci USA. 2015;112:12610–12615. doi: 10.1073/pnas.1513127112. [DOI] [PMC free article] [PubMed] [Google Scholar]
- 5.Little CM, et al. Joint projections of US East Coast sea level and storm surge. Nat Clim Chang. 2015;5:1114–1120. [Google Scholar]
- 6.Emanuel KA. The dependence of hurricane intensity on climate. Nature. 1987;326:483–485. [Google Scholar]
- 7. IPCC (2014) Climate change 2014: Synthesis report. Contribution of Working Groups I, II, and III to the fifth assessment report of the Intergovernmental Panel on Climate Change [core writing team, RK Pachauri and LA Meyer (eds.)]. (Intergovernmental Panel on Climate Change, Geneva)
- 8.Villarini G, Vecchi GA. Projected increases in North Atlantic tropical cyclone intensity from CMIP5 models. J Clim. 2013;26:3231–3240. [Google Scholar]
- 9.Emanuel KA. Downscaling CMIP5 climate models shows increased tropical cyclone activity over the 21st century. Proc Natl Acad Sci USA. 2013;110:12219–12224. doi: 10.1073/pnas.1301293110. [DOI] [PMC free article] [PubMed] [Google Scholar]
- 10.Knutson TR, et al. Global projections of intense tropical cyclone activity for the late twenty-first century from dynamical downscaling of CMIP5/RCP4.5 scenarios. J Clim. 2015;28:7203–7224. [Google Scholar]
- 11.Kossin JP, Camargo SJ, Sitkowski M. Climate modulation of North Atlantic hurricane tracks. J Clim. 2010;23:3057–3076. [Google Scholar]
- 12.Woodruff JD, Irish JL, Camargo SJ. Coastal flooding by tropical cyclones and sea-level rise. Nature. 2013;504:44–52. doi: 10.1038/nature12855. [DOI] [PubMed] [Google Scholar]
- 13.Lin N, Emanuel KA, Smith JA, Vanmarcke E. Risk assessment of hurricane storm surge for New York City. J Geophys Res Atmos. 2010;115:D18121. [Google Scholar]
- 14.Kossin JP. Hurricane intensification along United States coast suppressed during active hurricane periods. Nature. 2017;541:390–393. doi: 10.1038/nature20783. [DOI] [PubMed] [Google Scholar]
- 15. Intergovernmental Panel on Climate Change (IPCC) (2013) Climate change 2013: The physical science basis. Contribution of Working Group I to the fifth assessment report of the Intergovernmental Panel on Climate Change, eds Stocker TF, et al. (Cambridge Univ Press, New York)
- 16.Knutson TR, et al. Tropical cyclones and climate change. Nat Geosci. 2010;3:157–163. [Google Scholar]
- 17.Lin N, Kopp RE, Horton BP, Donnelly JP. Hurricane Sandy’s flood frequency increasing from year 1800 to 2100. Proc Natl Acad Sci USA. 2016;113:12071–12075. doi: 10.1073/pnas.1604386113. [DOI] [PMC free article] [PubMed] [Google Scholar]
- 18.Reed AJ, Mann ME, Emanuel KA, Titley DW. An analysis of long-term relationships among count statistics and metrics of synthetic tropical cyclones downscaled from CMIP5 models. J Geophys Res Atmos. 2015;120:7506–7519. [Google Scholar]
- 19.Walsh K. The ability of climate models to generate tropical cyclones: Implications for prediction. In: Peretz L, editor. Climate Change Research Progress. Nova Science Publishers; Hauppauge, NY: 2008. pp. 313–329. [Google Scholar]
- 20.Horton R, Little C, Gornitz V, Bader D, Oppenheimer M. New York City Panel on Climate Change 2015 Report. Chapter 2: Sea level rise and coastal storms. Ann N Y Acad Sci. 2015;1336:36–44. doi: 10.1111/nyas.12593. [DOI] [PubMed] [Google Scholar]
- 21.Kopp RE, et al. Probabilistic 21st and 22nd century sea-level projections at a global network of tide-gauge sites. Earths Futur. 2014;2:383–406. [Google Scholar]
- 22.Levermann A, et al. The multimillennial sea-level commitment of global warming. Proc Natl Acad Sci USA. 2013;110:13745–13750. doi: 10.1073/pnas.1219414110. [DOI] [PMC free article] [PubMed] [Google Scholar]
- 23.Horton BP, Rahmstorf S, Engelhart SE, Kemp AC. Expert assessment of sea-level rise by AD 2100 and AD 2300. Quat Sci Rev. 2014;84:1–6. [Google Scholar]
- 24.Riahi K, et al. RCP 8.5—A scenario of comparatively high greenhouse gas emissions. Clim Change. 2011;109:33–57. [Google Scholar]
- 25.Pollard D, DeConto RM, Alley RB. Potential Antarctic Ice Sheet retreat driven by hydrofracturing and ice cliff failure. Earth Planet Sci Lett. 2015;412:112–121. [Google Scholar]
- 26.DeConto RM, Pollard D. Contribution of Antarctica to past and future sea-level rise. Nature. 2016;531:591–597. doi: 10.1038/nature17145. [DOI] [PubMed] [Google Scholar]
- 27.Kopp RE, et al. 2017. Implications of Antarctic ice-cliff collapse and ice-shelf hydrofracturing mechanisms for sea-level projections. ArXiv:1704.05597.
- 28.Taylor KE, Stouffer RJ, Meehl GA. An overview of CMIP5 and the experiment design. Bull Am Meteorol Soc. 2012;93:485–498. [Google Scholar]
- 29.Mudd L, Wang Y, Letchford C, Rosowsky D. Hurricane wind hazard assessment for a rapidly warming climate scenario. J Wind Eng Ind Aerodyn. 2014;133:242–249. [Google Scholar]
- 30.Hall T, Yonekura E. North American tropical cyclone landfall and SST: A statistical model study. J Clim. 2013;26:8422–8439. [Google Scholar]
- 31.Baldini LM, et al. Persistent northward North Atlantic tropical cyclone track migration over the past five centuries. Sci Rep. 2016;6:37522. doi: 10.1038/srep37522. [DOI] [PMC free article] [PubMed] [Google Scholar]
- 32.Kossin JP, Emanuel KA, Vecchi GA. The poleward migration of the location of tropical cyclone maximum intensity. Nature. 2014;509:349–352. doi: 10.1038/nature13278. [DOI] [PubMed] [Google Scholar]
- 33.van Hengstum PJ, et al. The intertropical convergence zone modulates intense hurricane strikes on the western North Atlantic margin. Sci Rep. 2016;6:21728. doi: 10.1038/srep21728. [DOI] [PMC free article] [PubMed] [Google Scholar]
- 34.Roberts K, Colle B, Korfe N. Impact of simulated twenty-first-century changes in extratropical cyclones on coastal flooding at the Battery, New York City. J Appl Meteor Climatol. 2016 doi: 10.1175/JAMC-D-16-0088.1. [DOI] [Google Scholar]
- 35.Orton P, et al. New York City Panel on Climate Change 2015 report. Chapter 4: Dynamic coastal flood modeling. Ann N Y Acad Sci. 2015;1336:56–66. doi: 10.1111/nyas.12589. [DOI] [PubMed] [Google Scholar]
- 36.Kopp RE, Hay CC, Little CM, Mitrovica JX. Geographic variability of sea-level change. Current Climate Change Reports. 2015;1:192–204. [Google Scholar]
- 37.Cheng W, Chiang JCH, Zhang D. Atlantic Meridional Overturning Circulation (AMOC) in CMIP5 models: RCP and historical simulations. J Clim. 2013;26:7187–7197. [Google Scholar]
- 38.Stroeve JC, et al. Trends in Arctic sea ice extent from CMIP5, CMIP3 and observations. Geophys Res Lett. 2012;39:L16502. [Google Scholar]
- 39.Rahmstorf S, et al. Exceptional twentieth-century slowdown in Atlantic Ocean overturning circulation. Nat Clim. 2015;5:475–480. [Google Scholar]
- 40.Petoukhouv V, Semenov VA. A link between reduced Barents-Kara sea ice and cold winter extremes over northern continents. J Geophys Res Atm. 2010;115:D21111. [Google Scholar]
- 41.Francis JA, Vavrus SJ. Evidence linking Arctic amplification to extreme weather in mid-latitudes. Geophys Res Lett. 2012;39:L06801. [Google Scholar]
- 42.Liu J, Curry JA, Wang H, Song M, Horton RM. Impact of declining Arctic sea ice on winter snowfall. Proc Natl Acad Sci USA. 2012;109:4074–4079. doi: 10.1073/pnas.1114910109. [DOI] [PMC free article] [PubMed] [Google Scholar]
- 43.Jaiser R, Dethloff K, Handorf D, Rinke A, Cohen J. Impact of sea ice cover change on the Northern Hemisphere atmospheric winter circulation. Tellus Ser A Dyn Meterol Oceanogr. 2012;64:11595. [Google Scholar]
- 44.Haarsma RJ, Selten FM, Drijfhout SS. Decelerating Atlantic meridional overturning circulation main cause of future west European summer atmospheric circulation changes. Environ Res Lett. 2015;10:094007. [Google Scholar]
- 45.Joyce TM, Zhang R. On the path of the Gulf Stream and the Atlantic Meridional Overturning Circulation. J Clim. 2010;23:3146–3154. [Google Scholar]
- 46.Hart RE, Evans JL. A climatology of the extratropical transition of Atlantic tropical cyclones. J Clim. 2000;14:546–564. [Google Scholar]
- 47.Emanuel KA, Ravela S, Vivant E, Risi C. A statistical-deterministic approach to hurricane risk assessment. Bull Am Meteorol Soc. 2006;19:299–314. [Google Scholar]
- 48.Emanuel KA, Sundararajan R, Williams J. Hurricanes and global warming: Results from downscaling IPCC AR4 simulations. Bull Am Meteorol Soc. 2008;89:347–367. [Google Scholar]
- 49.Lin N, Lane P, Emanuel KA, Sullivan RM, Donnelly JP. Heightened hurricane surge risk in northwest Florida revealed from climatological-hydrodynamic modeling and paleorecord reconstruction. J Geophys Res Atmos. 2014;119:8606–8623. [Google Scholar]
- 50.Chavas D, Lin N, Emanuel KA. A model for the complete radial structure of the tropical cyclone wind field. Part I: Comparison with observed structure. J Atmos Sci. 2015;72:3647–3662. [Google Scholar]
- 51.Chavas D, Lin N. A model for the complete radial structure of the tropical cyclone wind field. Part II: Wind field variability. J Atmos Sci. 2016;73:3093–3113. [Google Scholar]
- 52.Luettich RA, Westerink JJ, Scheffner NW. 1992. ADCIRC: An advanced three-dimensional circulation model for shelves, coasts, and estuaries, Report 1: Theory and methodology of ADCRIC-2DDI and ADCIRC-3DL. Technical Report DRP-92-6. (US Army Corps of Engineers, Washington DC)
- 53.Westerink JJ, et al. A basin- to channel-scale unstructured grid hurricane storm surge model applied to southern Louisiana. Mon Weather Rev. 2008;136:833–864. [Google Scholar]
- 54.Colle BA, et al. New York City’s vulnerability to coastal flooding. Bull Am Meteorol Soc. 2008;89:829–841. [Google Scholar]
- 55.Muller M. Rapid change in semi-diurnal tides in the North Atlantic since 1980. Geophys Res Lett. 2011;38:L11602. [Google Scholar]
- 56.Kemp AC, et al. Relative sea-level trends in New York City during the past 1500 years. Holocene. 2017;27:1169–1186. [Google Scholar]
- 57.Kemp AC, et al. Sea-level change during the last 2500 years in New Jersey, USA. Quat Sci Rev. 2013;81:90–104. [Google Scholar]
- 58.McKee Smith J, Cialone MA, Wamsley TV, McAlpin TO. Potential impact of sea level rise on coastal surges in southeast Louisiana. Ocean Eng. 2009;37:37–47. [Google Scholar]
- 59.Zhang K, Li Y, Liu H, Xu H, Shen J. Comparison of three methods for estimating the sea level rise effect on storm surge flooding. Clim Change. 2012;118:487–500. [Google Scholar]
- 60.Bamber JL, Aspinall WP. An expert judgement assessment of future sea level rise from the ice sheets. Nat Clim Chang. 2013;3:424–427. [Google Scholar]
- 61.Efron B, Tibshirani RJ. An Introduction to the Bootstrap. Chapman and Hall; London: 1993. [Google Scholar]
- 62.Blake ES, Kimberlain TB, Berg RJ, Cangialosi JP, Beven JL., II 2013. Tropical cyclone report: Hurricane Sandy (AL182012), 22-29 October 2012 (National Hurricane Center, Miami)
- 63.Landsea CW, et al. A reanalysis of Hurricane Andrew’s intensity. Bull Am Meteorol Soc. 2004;85:1699–1712. [Google Scholar]
Associated Data
This section collects any data citations, data availability statements, or supplementary materials included in this article.
Data Availability Statement
Data used here are publicly available from the Earth System Grid Federation website (https://www.earthsystemgrid.org/home.html). SLR projections were generated using ProjectSL (https://github.com/bobkopp/ProjectSL) and LocalizeSL (https://github.com/bobkopp/LocalizeSL). Researchers interested in downscaled fields may contact coauthors K.A.E. or A.J.G. via email with their request.


