Significance
The cerebral cortex supports cognition and is a structure common to all mammals. The major cortical subdivisions (its gray matter regions) are connected by a complex network of axonal connections that includes connections between regions in the same hemisphere (association connections on the right or left side) and those between hemispheres (commissural connections between opposite sides). A database of over 5,000 connections in the cortical network was extracted from the literature, and network analysis revealed three identical cortical modules (neural subsystems) on each side. One appears to deal especially with the external world, one with the viscera, and one with planning, prioritization, and self-awareness. A set of general organizing principles for association and commissural connections also emerged from the analysis.
Keywords: cognition, connectomics, mammal, neural connections, neuroinformatics
Abstract
Cognition is supported by a network of axonal connections between gray matter regions within and between right and left cerebral cortex. Global organizing principles of this circuitry were examined with network analysis tools applied to monosynaptic association (within one side) and commissural (between sides) connections between all 77 cortical gray matter regions in each hemisphere of the rat brain. The analysis used 32,350 connection reports expertly collated from published pathway tracing experiments, and 5,394 connections of a possible 23,562 were identified, for a connection density of 23%—of which 20% (1,084) were commissural. Network community detection yielded a stable bihemispheric six-module solution, with an identical set in each hemisphere of three modules topographically forming a lateral core and medial shell arrangement of cortical regions. Functional correlations suggest the lateral module deals preferentially with environmental sensory-motor interactions and the ventromedial module deals preferentially with visceral control, affect, and short-term memory, whereas the dorsomedial module resembles the default mode network. Analysis of commissural connections revealed a set of unexpected rules to help generate hypotheses. Most notably, there is an order of magnitude more heterotopic than homotopic projections; all cortical regions send more association than commissural connections, and for each region, the latter are always a subset of the former; the number of association connections from each cortical region strongly correlates with the number of its commissural connections; and the module (dorsomedial) lying closest to the corpus callosum has the most complete set of commissural connections—and apparently the most complex function.
Human cognition is supported by information processing in the cerebral cortex. The right and left sides of the cerebral cortex are functionality specialized, but normally both sides intercommunicate via three major white matter tracts that directly connect the two cerebral hemispheres—anterior commissure, corpus callosum (great cerebral commissure), and hippocampal commissure (1). Association connections enable communication between the various cortical regions on the same side, whereas commissural connections enable communication between regions on opposite sides. The precise structure–function organization of commissural connections, which have been known for over 200 y (2), has received relatively little attention, even though the corpus callosum is by far the largest white matter tract in the mammalian nervous system (3). For example, to date most cortical connectome studies based on monosynaptic (first-order) axonal pathway tracing methods in mouse (4, 5), rat (6), cat (7, 8), and monkey (9) focused primarily on association connections, and a recent review of rat cortical neuroanatomy mentioned neither corpus callosum nor commissural connections (10). In humans, traditional anatomical methods and more recent noninvasive approaches such as diffusion tensor imaging have thus far provided only incomplete information on the origin or termination of commissural connections (11).
The present study investigates the organization of cortical association and commissural connections in the rat (for which the greatest amount of relevant structural data are available) by applying network analysis methods (12, 13) to connection data obtained from experiments using monosynaptic axonal transport pathway tracing methods, and published over the past 40 y. The analysis is based on a weighted and directed macroconnectome of commissural and association connections, and uses the same basic strategy and methodology applied previously to rat cerebral cortical association connections (6) and to rat cerebral nuclei association and commissural connections (14).
A macroconnection is defined here as a monosynaptic axonal connection between one nervous system gray matter region and either a second gray matter region or another tissue such as muscle or gland (15, 16). All 77 gray matter regions of the cerebral cortex—including cortical plate (isocortex, hippocampal formation, olfactory cortex) and cortical subplate—were included in the analysis. This approach is designed to provide high-level, global organizing principles of intrinsic cerebral cortical circuitry as a framework for progressively more detailed, nested meso, micro, and nano levels of analysis (17). A long-term goal is to assemble a manually and expertly curated gold standard database of macroconnections with global coverage of the rat nervous system.
Results
Systematic review of the primary neuroanatomical literature yielded no reports of statistically significant male/female, right/left, or strain differences for any association or commissural connection used in the analysis, which therefore applies simply to the adult rat; future studies should be designed to address possible differences in these variables. Current data support a model for rat consisting of two, bilaterally symmetric cortical domains with identical sets of association connections, domains that are interconnected through bilaterally symmetric (identical) sets of commissural connections. In the current analysis, each cortical domain has 5,852 (772 − 77) possible association connections (11,740 for both sides), and each cortical domain has 5,929 (772) possible commissural connections (11,858 for both domains).
The entire dataset of 16,175 connection reports was expertly collated by L.W.S. from 185 peer-reviewed original research publications in the neuroanatomical literature since 1974 for 11,781 possible association and commissural connections arising in one hemisphere (given no reports of statistically significant right/left differences, these numbers are doubled to give 32,350 connection reports for 23,562 possible connections arising from both hemispheres). The connection reports were from 29 journals (49.9% from the Journal of Comparative Neurology and 22.0% from Brain Research) involving about 75 laboratories; 2,051 or 12.7% of the reports for connections arising in one hemisphere were from the L.W.S. laboratory. A standard rat brain parcellation and nomenclature (Dataset S1)—based primarily on architecture, topography, and connections, and secondarily on function—was used to describe all connection reports, which in turn were based on the results of experiments using monosynaptic anterograde and retrograde axonal pathway tracing methods (17 different methods in total, identified for each connection report in Dataset S2).
Basic Connection Numbers.
The collation identified 2,155 association connections as present, and 3,554 as absent, between the 77 gray matter regions comprising the entire cerebral cortex in one hemisphere; this yields a connection density of 37.7% (2,155/5,709). For a comparison of this dataset with an earlier version (6), see Results, Versioning Connectomes. In contrast, 542 commissural connections from one hemisphere to the other were identified as present, and 4,772 as absent, for a connection density of 9.7%.
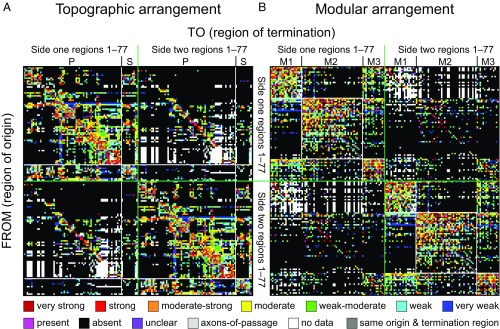
No adequate published data were found for 143 (2.4%) of all 5,852 possible association macroconnections for a matrix coverage (fill ratio) of 97.6% (Fig. 1). Matrix coverage for commissural connections was 89.6% (no published data for 615 possible connections out of 5,929), indicating less attention was paid to commissural than to association connections in the rat neuroanatomical literature. Assuming the data collected from the literature representatively samples the 77-region matrix, the complete association connection dataset for one hemisphere would contain ∼2,206 macroconnections (5,852 × 0.377), and the complete commissural connection dataset would contain ∼575 macroconnections (5,929 × 0.097).
Fig. 1.
(A and B) Bilateral rat cerebral cortical macroconnectome (association and commissural). Directed and weighted monosynaptic macroconnection matrix with gray matter region sequence in either (A) a topographic arrangement (per an ordered nomenclature hierarchy provided in Dataset S1), or (B) a modular arrangement derived from modularity maximization analysis (Fig. 4). By definition, connections within a region are not considered in the analysis so the 77 squares forming the main diagonal (from Top Left to Bottom Right) are dark gray. Key for color-coded scale of all connection weights and properties is at the bottom (see Datasets S2 and S3 for additional information).
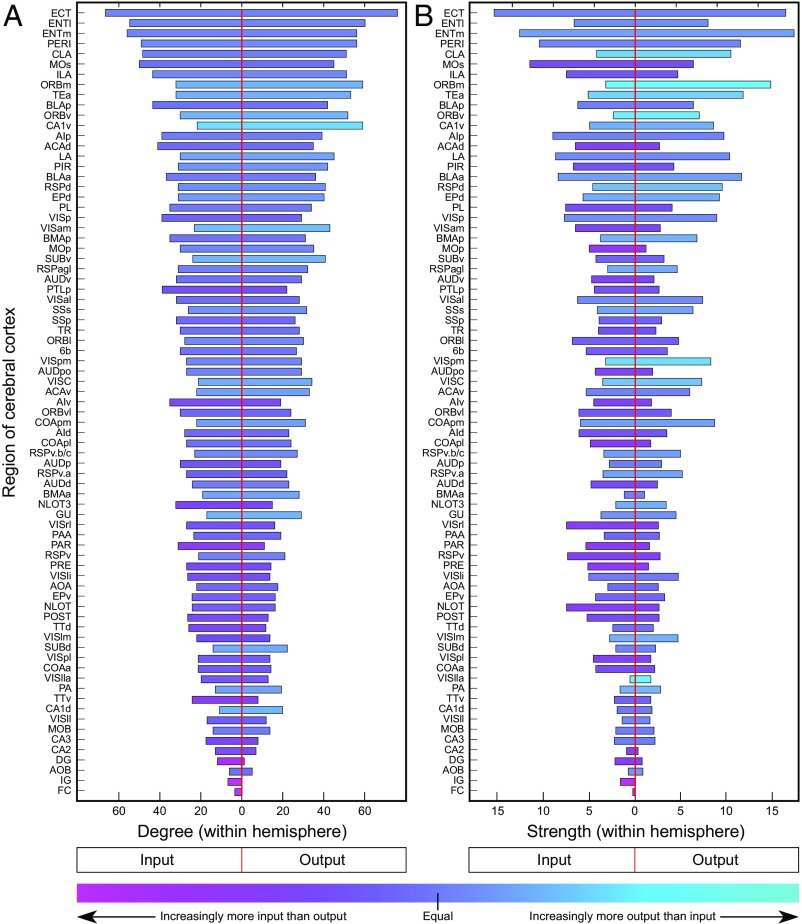
For network analysis, reported values of “unclear” and “no data” are assigned to and binned with reported values in the “absent” category (Fig. 1), resulting in connection densities of 36.8% (2,155/5,852) for association connections, 9.1% (542/5,929) for commissural connections, and 22.9% for association and commissural connections combined. Considering only connections that have been identified unambiguously yields a mean number of input or output connections per region of 28 for association connections (36.8% of possible), with significant variations for individual cerebral cortical regions (input range, 3–66; output range, 0–76). Each region displays a unique ratio of the number of distinct association inputs and outputs (their in-degree and their out-degree; Fig. 2A) as well as the aggregated weights (strength) of these inputs and outputs (their in-strength and their out-strength; Fig. 2B). An imbalance in these measures implies, in relation to its magnitude, that some regions specialize more as “receivers” of inputs and others more as “senders” of outputs. The mean number of input or output connections per region for commissural connections was 7 (9.1% of possible), with an input range of 0–26 and an output range of 0–38.
Fig. 2.
Comparison of regional in/out-degree and in/out-strength for association connections of all 77 cortical regions. For ipsilateral intracortical connections of the regions, in-degree/out-degree (A) and in-strength/out-strength (B) are ranked by total degree, in descending order. Bar coloration indicates asymmetry for in/out-degree and in/out-strength, respectively, computed as (in-degree − out-degree)/(in-degree + out-degree) and (in-strength − out-strength)/(in-strength + out-strength). A value of −1 (cyan) indicates strong prevalence of out-degree/strength (the area is a “sender”), and a value of +1 (pink) indicates a strong prevalence of in-degree/strength (the area is a “receiver”). Abbreviations are defined in Datasets S1 and S3.
When the right and left hemispheres are considered together, the dataset for network analysis contained a grand total of 5,394 association and commissural connections between 154 regions, for a connection density of 22.9%. The mean number of association and commissural input and output pathways per region was 35 (input range, 3–80; output range, 0–97). On average, therefore, each region has 70 macroconnections.
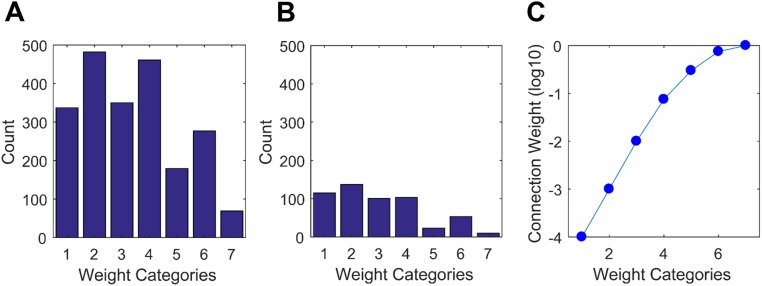
The distribution of weight categories for association and for commissural connections reported as present is shown (respectively) in Fig. S1 A and B. For weighted network analysis, an exponential scale was applied to the ordinal weight categories (Fig. S1C; SI Materials and Methods).
Fig. S1.
(A and B) Distribution of weight categories of association (ipsilateral) macroconnections (A) and of commissural (contralateral) macroconnections (B). (C) Weight scale used for weighted network analysis.
Efficiency, Hubs, and Rich Club.
Consistent with earlier findings (6), the connection topology of the rat cortical association macroconnectome exhibits small world attributes, characterized by high clustering with a weighted clustering coefficient of 0.0404 (0.0267 ± 8.26 × 10⁻⁴; mean ± SD of a population of 10,000 networks that were randomly rewired while maintaining the degree sequence; SI Materials and Methods), and short path length (4.443; 4.243 ± 1.319) as well as high global efficiency (0.279; 0.279 ± 0.004).
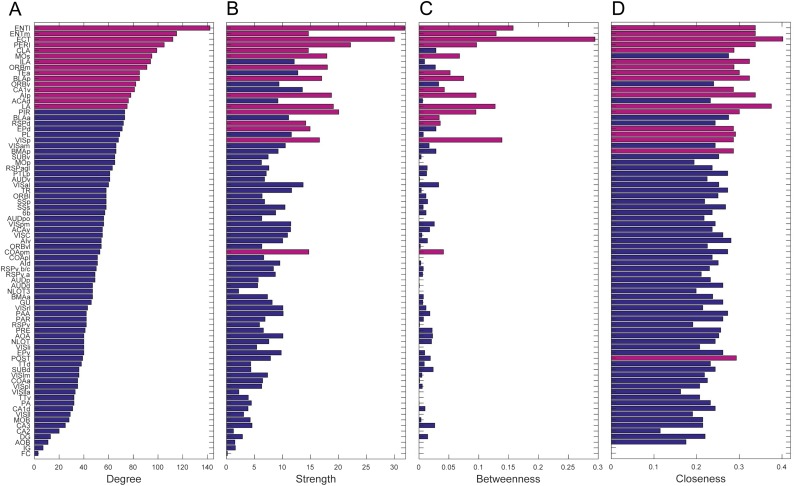
Centrality measures (degree, strength, betweenness, closeness) based on intrahemispheric connectivity are summarized in Fig. S2. The medial and lateral entorhinal (ENTm,l), posterior agranular insular (AIp), perirhinal (PERI), and ectorhinal (ECT) areas, and the basolateral (BLA) and lateral (LA) amygdalar nuclei rank in the top 20th percentile on all four measures, thus forming putative hubs in the network topology. Association connections among these seven regions form a nearly fully connected subgraph (40/42 connections exist) with an average connection weight of 0.43 (compared with an average connection weight of 0.256 ± 0.044, P = 10−4, for 10,000 subgraphs among these seven nodes derived from a degree sequence-preserving null model).
Fig. S2.
Rankings of regions according to four centrality measures: degree (A), strength (B), betweenness (C), and closeness (D). Regions are ranked by degree across all four plots, with regions in the top 20th percentile for each measure indicated by purple bars.
Rich club analysis (SI Materials and Methods for detail) revealed the presence of rich club organization in the cortical association connectome (see also ref. 6). High-degree nodes exhibited significantly greater density of mutual interconnections compared with a degree-preserving null model, assessed after correcting for multiple comparisons. A total of 15 regions form a central rich club (corrected P value = 0; comparison with 10,000-degree sequence-preserving random networks), comprising ventral field CA1 (CA1v), medial and lateral entorhinal areas (ENTm,l), infralimbic area (ILA), dorsal anterior cingulate area (ACAd), posterior agranular insular area (AIp), ventral and medial orbital areas (ORBv,m), secondary motor areas (MOs, also called premotor area), perirhinal area (PERI), ectorhinal area (ECT), temporal association areas (TEa), basolateral (BLA) and lateral (LA) amygdalar nuclei, and claustrum (CLA). This set includes all candidate hub regions derived from centrality analysis. Although comprising only about 3.6% (210/5,852) of all possible connections, rich club association connections account for 14.3%, and rich club commissural connections for 18.1%, of the total connection mass (aggregated by weight).
Network Analysis for Modules.
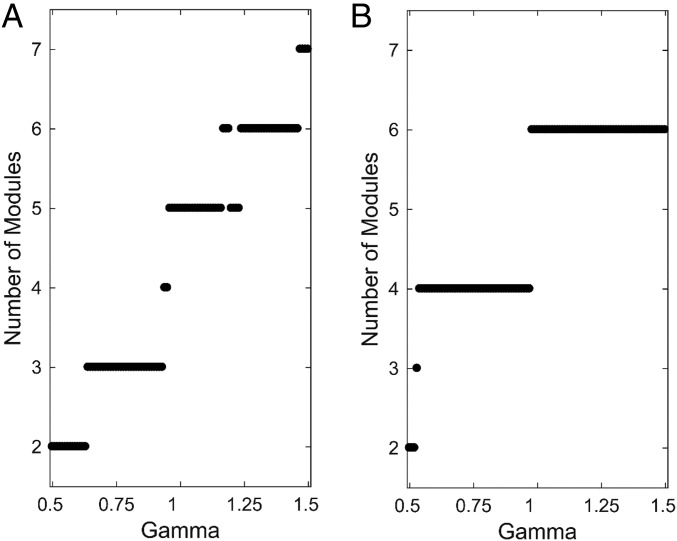
For association connections in one hemisphere, modules were detected by modularity maximization, systematically varying the spatial resolution parameter γ to assess module stability (13, 18). Varying γ between 0.5 and 1.5 (centered on the default setting of 1) yielded a set of module partitions comprised of between two and seven modules each (Fig. 3A). A single three-module solution was found to be stable across the widest continuous range of γ. Multiple other solutions exhibiting five or six modules were found across a relatively wide range of γ but exhibited less stability overall. A similar analysis for the full bihemispheric matrix (association and commissural connections on both sides; Fig. 3B) produced solutions with two to six modules each (that is, one to three modules per hemisphere). The four- and six-module solutions were by far the most stable, and as the resolution parameter increased toward finer partitions, the former split into the latter configuration (with only 2/77 regions, dorsal field CA1 and lateral orbital area, switching their module assignment). The six-module solution (derived from association and commissural connections) exhibited module assignments within one hemisphere that were identical to those of the three-module solution derived from association connections only. The three-module (one hemisphere) and six-module solution (two hemisphere) partitions were chosen for further analysis.
Fig. 3.
Stability of module partitions under variation of spatial resolution parameter γ. Both A and B show the number of modules encountered at each level of γ in the range of 0.5–1.5 (incremented in steps of 0.01), centered around the default value of 1. (A) Of the six solutions encountered for association (unilateral) connections only, that with three modules was the most stable (and fully homogeneous) over the widest range of γ. B plots the number of modules encountered when association and commissural connections are considered together. Here, four solutions are encountered, with the most stable having six modules, three in each hemisphere. The three are identical in each hemisphere and are identical to the three modules identified in the single hemisphere analysis (A). The bilateral six-module solution was adopted for the remainder of the study.
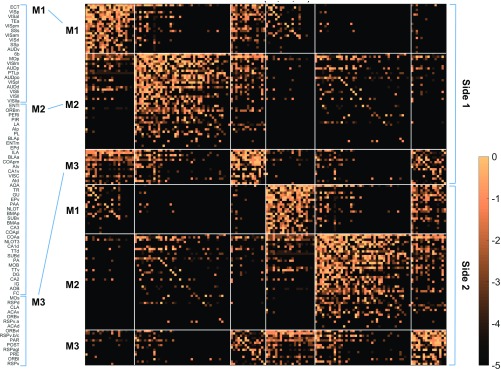
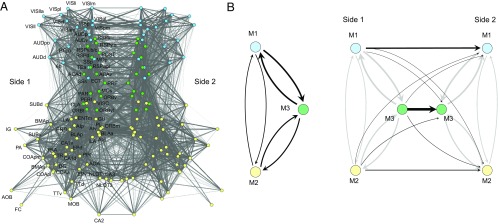
The six-module solution has three identical modules in each hemisphere, and all regions and connections involved can be displayed as a weighted matrix (Fig. 4) or spring-embedded layout (Fig. 5A). The regional composition of each module is represented in Fig. 4, with detail provided in Dataset S3. For comparison, the raw data values for the six-module solution are shown in Fig. 1B, next to the same data arranged by topographic ordering (Fig. 1A).
Fig. 4.
Weighted connection matrix (log10-scale) for 154 (77 per hemisphere) cortical regions. Ordering determined by the six-module solution (Fig. 3B), with regions within modules arranged by total node strength. Gray matter region abbreviations are defined in Datasets S1 and S3 (worksheet 2).
Fig. 5.
Connection pattern layout diagrams. (A) The complete bilateral network of association and commissural connections. Nodes (regions) and edges (connections) are projected onto two dimensions, using a Fruchterman–Reingold energy minimization layout algorithm. Nodes are color-coded by module assignment (M1, blue; M2, yellow; M3, green). To simplify the plot, connections are drawn without reference to directionality (gray level and thickness of line proportional to log10 of connection weight). (B) Summary layout of aggregated connection weights between modules M1–M3 in one hemisphere (Left) and from modules M1–M3 on side 1 to modules M1–M3 on side 2 (Right). Arrows show directionality of connections, and their thickness is proportional to the average connection weights of between-module connections (Tables S1 and S3). Abbreviations are defined in Datasets S1 and S3 (worksheet 2).
Topographic Arrangement and Composition of Modules.
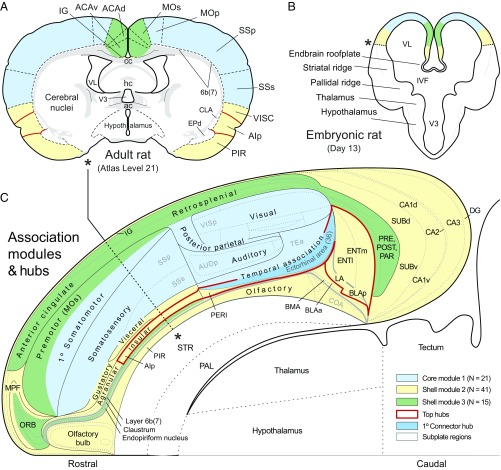
To distinguish whether cortical module components are topographically either interdigitated or segregated, they were projected onto atlas maps of transverse histological sections (Fig. 6 A and B) and the overall pattern was displayed on a cortical flat-map representation of the adult atlas (Fig. 6C). Each of the three modules in one hemisphere clearly is segregated spatially, and together they form a core and shell arrangement, with a lateral core module segregated from mainly differentiated dorsomedial and ventromedial shell modules. For the cortical plate, the lateral core module (M1, blue) consists of somatosensory, auditory, and visual areas, along with posterior parietal and temporal association areas; the ventromedial shell module (M2, yellow) consists of olfactory, gustatory, and visceral areas, along with medial prefrontal and agranular insular areas, and most of the hippocampal formation; and the dorsomedial shell module (M3, green) consists of orbital and premotor areas, anterior and retrosplenial areas, and pre-, post-, and parasubiculum. For the cortical subplate, the lateral core module is associated with layer 6b/7, the ventromedial shell module is associated with the endopiriform nucleus and basolateral amygdalar complex; and the dorsomedial shell module is associated with the claustrum.
Fig. 6.
Mapping the spatial distribution of modules and hubs in the rat. A shows the general localization of cortical regions and the cortical plate parts of M1–M3 (color coded) on a transverse section from the standard brain atlas used to create connection reports for this analysis. B is a fate map of presumed module localization on a transverse section of the forebrain vesicle on embryonic day 13. C shows the spatial extent of M1–3, the top-ranked hubs, including the primary connector hub, on a regionalized flat map of the right cerebral cortex. Note the basic core and shell arrangement of modules, with M1 (blue) forming a lateral core, and M2 (yellow) and M3 (green) forming (respectively) ventral and dorsal segments of the shell. The cortical subplate forms a deep layer 6b (or 7) of the cerebral cortex and as such is nested (gray outline) in the overall cortical plate representation (28). The topographic distributions in A and B serve primarily to help understand the flat-map topology (see the asterisk and dashed line in C, and the corresponding asterisks in A and B). For high-resolution details of the flat map, see ref. 28. Abbreviations are defined in Datasets S1 and S3 (worksheet 2). A and C are adapted from ref. 28, and B is adapted from ref. 29.
Six of the seven candidate hubs identified above (medial and lateral entorhinal, posterior agranular insular, and perirhinal areas, and basolateral and lateral amygdalar nuclei) lie in M2, with a sole hub (ectorhinal area) in M1. Of these seven candidate hubs, the ectorhinal area (part of inferior temporal cortex) is the strongest candidate for a connector hub because it places in the 10th percentile for both within-module z score and participation coefficient. The ectorhinal area connects to a total of 63 cortical regions, 20 placed within its host module M1, 29 within M2, and 14 within M3.
Intermodular Connection Patterns.
A simplified way to view intermodular patterns of association and commissural connections is with a layout diagram of aggregated connection weights (Fig. 5B). Looking only at association connections, all three modules are mutually connected, with the strongest aggregate connection weight found between M3 and M1, the next strongest between M3 and M2, and the weakest between M1 and M2 (Fig. 3B, Left). On average, between-module association connections are relatively symmetric in both density and weight (Table S1). This degree of symmetry between modules stands in striking contrast to the highly asymmetric relations found among modules of regions in the cerebral nuclei (14). Table S2 lists counts and percentages of connection weight categories (very weak to very strong; Fig. 1) by matrix block (module).
Table S1.
Association connection density by module (binary and weighted)
| To | |||
| From | M1 | M2 | M3 |
| Binary | |||
| M1 | 0.6929 | 0.1312 | 0.4190 |
| M2 | 0.2137 | 0.4884 | 0.3122 |
| M3 | 0.5206 | 0.2065 | 0.7190 |
| Weighted | |||
| M1 | 0.1744 | 0.0145 | 0.0365 |
| M2 | 0.0139 | 0.1058 | 0.0271 |
| M3 | 0.0340 | 0.0249 | 0.2075 |
Table S2.
Association connection weight categories by module (counts and percentages)
| Connection | vw | w | w/m | m | m/s | s | vs. |
| Counts | |||||||
| M1↔M1 | 17 | 44 | 65 | 64 | 25 | 63 | 13 |
| M1→M2 | 40 | 18 | 18 | 19 | 8 | 6 | 4 |
| M1→M3 | 9 | 41 | 30 | 36 | 9 | 5 | 2 |
| M2→M1 | 65 | 61 | 17 | 24 | 8 | 6 | 3 |
| M2↔M2 | 94 | 190 | 96 | 177 | 73 | 135 | 36 |
| M2→M3 | 47 | 38 | 37 | 49 | 7 | 14 | 0 |
| M3→M1 | 26 | 40 | 43 | 39 | 11 | 4 | 1 |
| M3→M2 | 19 | 36 | 26 | 22 | 12 | 9 | 3 |
| M3↔M3 | 20 | 14 | 18 | 31 | 26 | 35 | 7 |
| % | |||||||
| M1↔M1 | 6 | 15 | 22 | 22 | 9 | 22 | 4 |
| M1→M2 | 35 | 16 | 16 | 17 | 7 | 5 | 4 |
| M1→M3 | 7 | 31 | 23 | 27 | 7 | 4 | 2 |
| M2→M1 | 35 | 33 | 9 | 13 | 4 | 3 | 2 |
| M2↔M2 | 12 | 24 | 12 | 22 | 9 | 17 | 4 |
| M2→M3 | 24 | 20 | 19 | 26 | 4 | 7 | 0 |
| M3→M1 | 16 | 24 | 26 | 24 | 7 | 2 | 1 |
| M3→M2 | 15 | 28 | 20 | 17 | 9 | 7 | 2 |
| M3↔M3 | 13 | 9 | 12 | 21 | 17 | 23 | 5 |
Basic features of aggregated cortical commissural connections from the three modules in one hemisphere to the three input modules in the opposite hemisphere are shown in Fig. 5B, Right, and Table S3. Clearly, each module sends the greater part of its commissural projection to the corresponding module on the other side, both in terms of connection number (degree) and aggregated weights (strength). That is, at the modular level, homotopic connections (aggregate connection numbers and weights between corresponding modules on the two sides) predominate over heterotopic connections (aggregate numbers and weights between different modules on the two sides). In addition, M1 sends the weakest homotopic aggregate connection (0.0129), M2 sends a relatively modest homotopic aggregate connection (0.0298), and M3 sends a relatively strong homotopic aggregate connection (0.0610).
Table S3.
Commissural connection density by module (binary and weighted)
| To side 1 | |||
| From side 2 | M1 | M2 | M3 |
| Binary | |||
| M1 | 0.1429 | 0.0116 | 0.0540 |
| M2 | 0.0302 | 0.1160 | 0.0878 |
| M3 | 0.1079 | 0.0878 | 0.3956 |
| Weighted | |||
| M1 | 0.0298 | 0.0004 | 0.0016 |
| M2 | 0.0013 | 0.0159 | 0.0075 |
| M3 | 0.0038 | 0.0067 | 0.0610 |
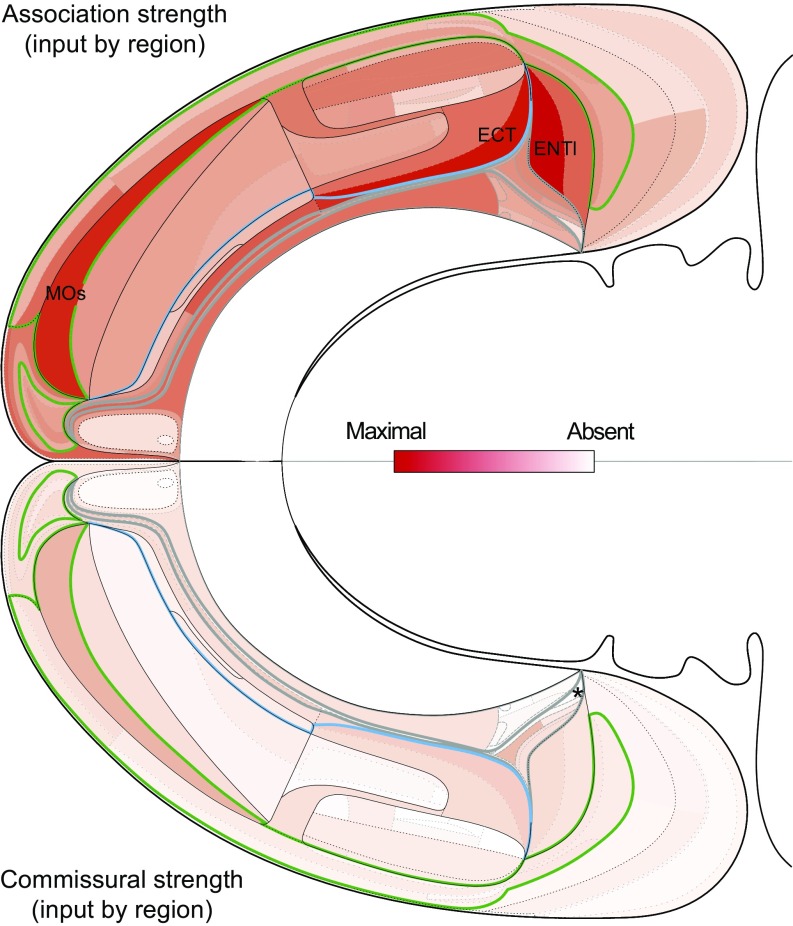
When commissural connections of dorsomedial M3 (involving premotor, orbital, anterior cingulate, retrosplenial, and subicular areas, and the claustrum) are considered at the individual, regional, level (rather than in aggregate), four other striking features emerge (Dataset S3). First, each of its 15 regions (nodes) establishes a homotopic commissural connection, whereas only about one-half of the regions in M1 (12/21) and M2 (23/41) generate such connections. Second, each region in M3 sends and receives considerably more heterotopic connections than the average for regions in M1 or M2. For M3, the average number of output heterotopic connections per region is 11 (162/15) and the average number of input heterotopic connections per region is 9.7 (145/15). For M1, the averages are as follows: output, 3.7 (78/21), and input, 5.3 (111/21); and, for M2, the averages are as follows: output, 6.1 (252/41), and input, 5.8 (236/41). Third, M3 has three of the five regions receiving the strongest commissural connections; the other two modules each have one such region. In fact, the premotor region (secondary somatomotor areas, MOs) has by far the strongest commissural input (from 26 regions in all three modules) of any cortical region. Fourth, M3 establishes a relatively strong set of heterotopic connections with M2 (aggregate weight, 0.0067, vs. 0.0038 for M1), especially with the medial and lateral entorhinal areas (Dataset S3).
Rules in Commissural Connection Patterns.
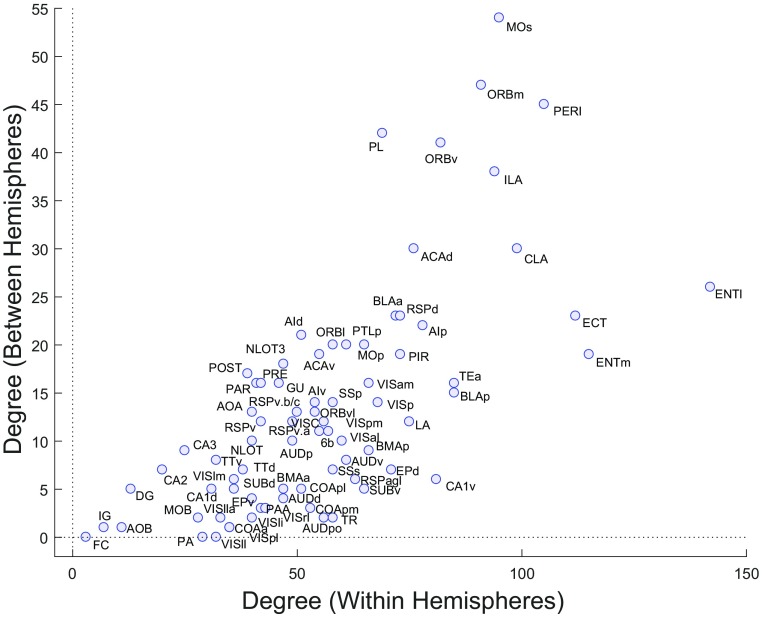
Because so little systematic work has been done on cortical commissural connections, it is worth listing a set of general features (“rules”) emerging from the data (Fig. 4 and Dataset S3). (i) All 77 cortical regions in one hemisphere have a unique set of association and commissural input and output connections. (ii) The number of association connections maintained by each cortical region strongly correlates with the number of its commissural connections (Fig. 7), and each region has a unique ratio of the number of association and commissural connections it receives and sends. (iii) All cortical regions send more association than commissural connections (Fig. 8). (iv) All cortical regions (but one confirmed, posterior amygdalar nucleus, and five possible with no available data) receive at least one commissural connection, whereas at least 12% of cortical regions send no documented commissural connection. (v) There is an order of magnitude more heterotopic than homotopic commissural connections (492 vs. 50). (vi) When present, the commissural connections of a cortical region are always a subset of that region’s association connections. Thus, all 492 heterotopic commissural connections have a corresponding association connection. (vii) About two-thirds (50/77) of cortical regions send a homotopic commissural connection; all such regions (but one, dentate gyrus) also send at least one heterotopic commissural connection. Conversely, about a third (27/77) of cortical regions send no known homotopic commissural connection. (viii) The set of 50 cortical regions that maintain a homotopic connection tends to have higher node degree (61.24/−24.34; mean ± S.D.) than the 27 regions that do not (46.22 ± 24.48; two-sided t test, P = 0.012). (ix) Homotopic connections contribute disproportionally to the aggregated weight of all commissural connections: 50/542 (9.2%) of commissural connections are homotopic, yet they account for 35.6% of the aggregate weight. (x) An analysis of all shortest paths linking regions on one side to regions on the other side of the cortex (that is, of all shortest paths that span the two hemispheres) shows that homotopic connections make a proportionally much stronger contribution. Of 50 homotopic connections, 30 contribute to at least one shortest path, whereas, in contrast, of 493 heterotopic connections, only 40 make such a contribution. (xi) Comparing the weight categories for heterotopic commissural connections and their corresponding set of association connections, 124 such pairs had equal weights, and 355 pairs had a stronger association connection weight (compared with the corresponding heterotopic weight). Only 13 heterotopic connections had a stronger weight than their corresponding association weight. (xii) Cortical regions receiving a homotopic commissural input typically have many more heterotopic inputs than regions not receiving a homotopic input (by a factor of 4.5; median of 13.5 vs. 3 inputs). (xiii) Stronger association connections are more likely to have a corresponding commissural connection between the same source and target regions. For the seven ordinal weight categories (also see Fig. 1 and Fig. S1), the percentage of association connections for which a matching commissural connection exists rises: 4% (i) (very weak connection weight), 10% (ii), 22% (iii), 31% (iv), 39% (v), 39% (vi), and 51% (vii) (very strong connection weight). (xiv) A modes percentage of about 20% (87/492) of heterotopic connections form a reciprocal pair of connections; the majority of heterotopic connections do not.
Fig. 7.
Scatter plot of each cortical region’s intrahemisphere degree (the number of its distinct input plus output connections, absent any commissural connections) versus the region’s interhemisphere degree (the number of its distinct commissural connections, both homotopic and heterotopic inputs plus outputs, absent any association connections). The two measures are significantly correlated (Spearman’s ρ = 0.712, P = 3.89 × 10⁻¹³). Abbreviations are defined in Dataset S3.
Fig. 8.
Strength of association (Top) and commissural (Bottom) inputs to each cortical region. Aggregated connection weights (strength, on the ordinal scale in Fig. 1) are shown on a bilateral flat map of the rat cerebral cortex with the three modules on each side outlined as in Fig. 6 (Fig. 6 for more details and labeling). Strengths were determined by summing the columns in Dataset S3 and setting the maximum value at 100% red (see scale). Asterisk indicates only documented region [posterior amygdalar nucleus (PA)] not receiving a commissural input.
Versioning Connectomes.
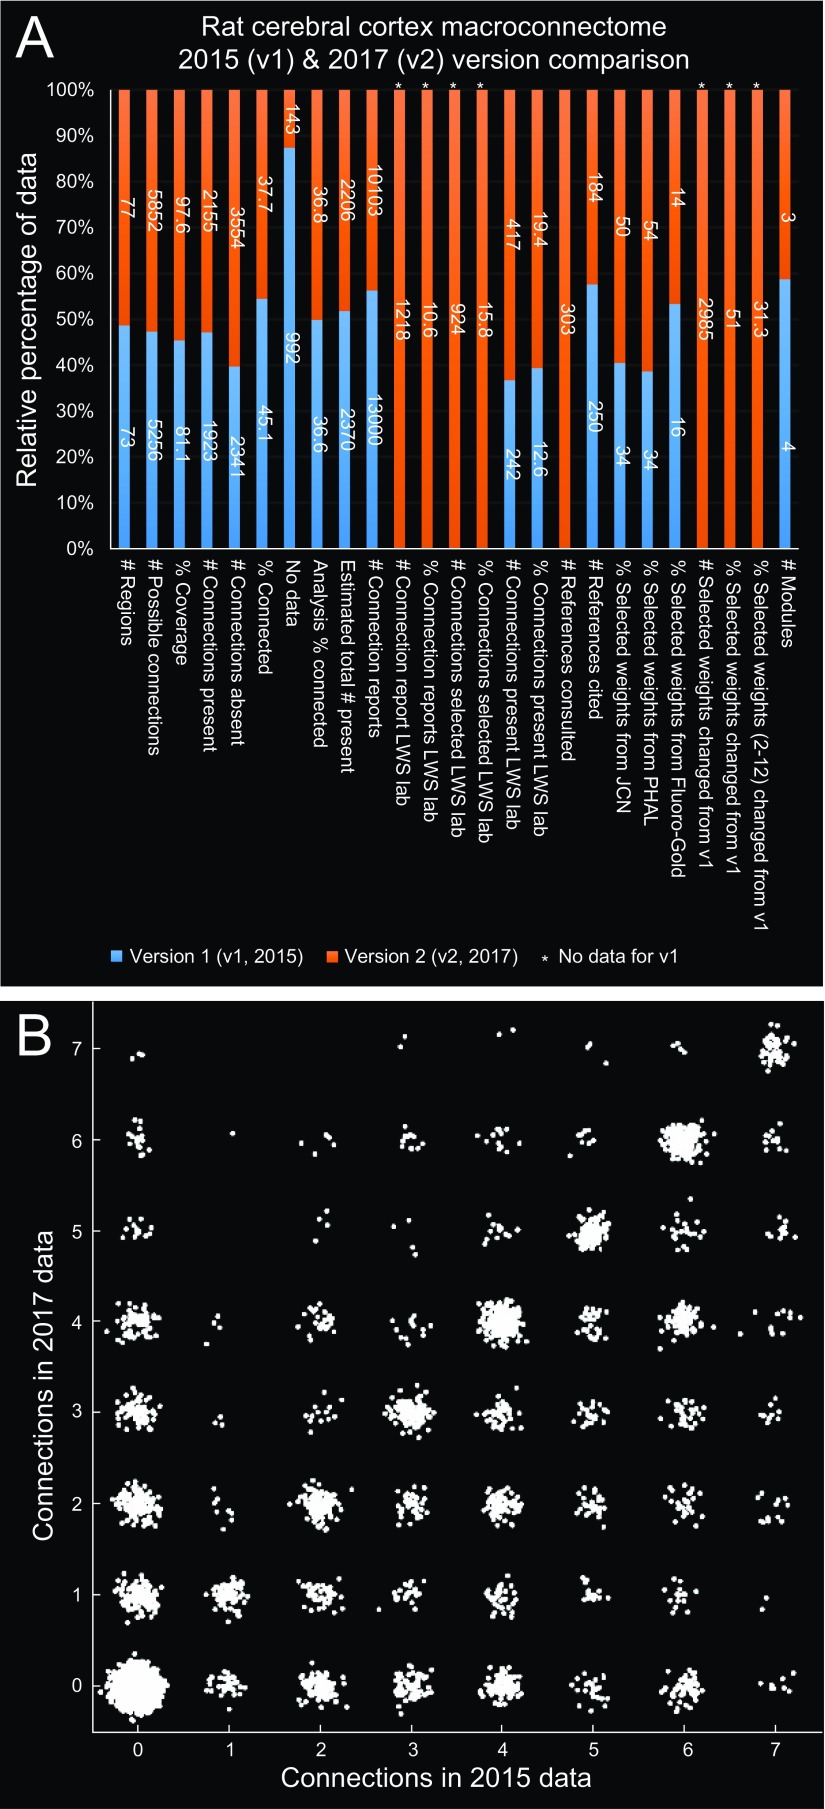
This study complements and extends a previous network analysis of the rat cortical association macroconnectome (RCAM) (6). Here, the rat cortical commissural macroconnectome (RCCM) was assembled by a different collator (L.W.S.), and the number of cortical regions on each side was increased from 73 to 77 to include all regions of the cerebral cortex (Datasets S1 and S2). For consistency and completeness, the same collator (L.W.S.) completely recollated version 1 of the RCAM (RCAMv1), producing version 2 (RCAMv2), and produced version 1 of the RCCM (RCCMv1). Minor differences in collation methods for RCAMv1 and RCAMv2 are described in SI Materials and Methods, and differences in underlying connection reports and connection report statistics are provided in Fig. S3 and Dataset S2, respectively. Note that RCAMv2 had more cortical regions (77 vs. 73), a higher connection matrix fill ratio (97.6% vs. 81.1% vs.), and a higher percentage of connection reports based on what is generally considered to be the best available anterograde tracer (PHAL) used in this dataset (54% vs. 34%). The main difference between the results of network analysis on the RCAMv1 and RCAMv2 datasets was the selection of a four-module solution for RCAMv1, obtained without assessing module stability by varying γ (Fig. 3A). Direct comparison showed that the modules of RCAMv1 were a perfectly nested version of the three-module solution for RCAMv2.
Fig. S3.
(A and B) Comparisons of data used to construct the first two versions of the rat cortical association macroconnectome (RCAMv1 and RCAMv2). RCAMv1 is from ref. 6, and RCAMv2 is from the current analysis. The stacked column chart (A) shows the relative percentage of data (y axis) for each of several data types/criteria (x axis). The scatter plot (B) shows the proportion of each pair of connection weights compared across the two versions (x and y axes). Abbreviations: JCN, Journal of Comparative Neurology; LWS, Larry W. Swanson; PHAL, Phaseolus vulgaris-leucoagglutinin.
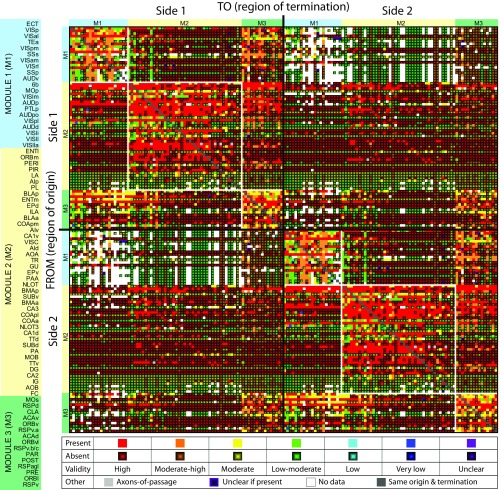
The validity of connectional data used for network analysis is an important consideration, especially because the data are derived from 17 different experimental pathway tracing methods reported in 185 journal articles (see above). We therefore devised a seven-level ordinal validity scale (with seven being the highest) for pathway tracing methods (SI Materials and Methods), and the tracer validity score for each element of the six-module connection matrix (Figs. 1B and 4) is shown in Fig. 9. The mean tracer validity rating for connections present in the entire matrix was 6.2. For association connections, it was 5.8 for M1, 6.4 for M2, and 6.0 for M3; for commissural connections, it was 5.5 for M1 to M1, 6.5 for M2 to M2, and 6.0 for M3 to M3.
Fig. 9.
Matrix combining a weighted connection matrix for cortical regions (as shown in Fig. 1B), with the validity of the experimental pathway tracing methods for present or absent connections, based on a seven-point scale for their validity. Note that, for connections reported as absent, a lower pathway tracer validity does not necessarily reduce the validity of the data (SI Materials and Methods for further information).
Discussion
One basic finding presented here is that the network of macroconnections between the 77 cortical regions in each hemisphere of the adult rat brain is quite rich: there is experimental, monosynaptic, axonal transport pathway tracing evidence for 5,394 intracortical (association plus commissural) connections out of 23,562 possible connections. This evidence has accumulated since 1974 and would have been unimaginable in 1946 when the first systematic analysis concluded that there are about 50 association connections between 33 cortical regions in rat, based on the Marchi experimental degeneration method (19). Another basic finding is that only 20% of these connections are commissural, and of this 20% only about 9% are homotopic, that is, connections from a specific region in one hemisphere to the corresponding (“same”) region in the other hemisphere.
Formal network analysis is essential to begin clarifying the organizing principles of this network where the evidence indicates that about a quarter of all possible connections exist. One approach is community detection (13), for example through modularity maximization, an approach based on the weight of connections between regions. Looking across different levels of spatial resolution, we find that the most stable solution for the rat intracortical macroconnectome comprises six modules, with an identical set of three on each side of the brain. Topographic and topological mapping show that the three modules form a core and shell arrangement in the right and the left hemisphere.
While definitive interpretation of cortical module functional significance awaits network analysis of extracortical inputs and outputs, the following broad generalizations seem reasonable. First, the lateral core module (M1) consists of somatosensory, auditory, and visual areas, along with posterior parietal and temporal association areas. It contains the primary connector hub in the network (the ectorhinal area or Brodmann area 36, part of inferior temporal cortex) and plays an important role in the animal’s perception of, and behavioral interactions with, the external environment. Second, the ventromedial shell module (M2) contains olfactory, gustatory, and olfactory areas, medial prefrontal and agranular insular areas, and most parts of the hippocampal formation. It accounts for over one-half of all of the regions (nodes) in the network and plays an important role in perceiving and regulating the viscera (vital functions associated with the internal environment), in supporting affect, and in short-term memory mechanisms. Third, the dorsomedial shell module (M3) contains orbital, anterior cingulate and premotor, retrosplenial, and subicular areas, as well as the claustrum. M3 functional significance is currently vague, but there is a striking correspondence between its components and areas that have been identified as possible rodent homologs of the human default mode network (20–22). This might suggest a role for M3 in executive functions such as planning, prioritization, and self-awareness. Together, the dorsomedial and ventromedial modules correspond well to the grand limbic lobe identified by Broca (23) as a general topographic feature of mammals around the medial edge of the cerebral hemisphere, although the medial “shell” modules defined by connection patterns also include the gustatory, visceral, and premotor regions.
In one hemisphere, where some 37% of all possible cortical association connections apparently exist, the mean number of input association connections (or output association connections) per region (node) is 28, and almost all cortical regions receive inputs from all three cortical modules. This suggests that the simple idea of unimodal sensory and motor areas is likely inaccurate, at least in rat, and that this arrangement should be adequately addressed in other species, especially primates, where more restricted structural connectivity may be present. The rat primary visual area (VISp) (Brodmann area 17), for example, receives a combination of identified association inputs from 39 cortical regions distributed through all three modules, including the primary and supplemental somatosensory areas (SSp, SSs), ventral auditory areas (AUDv), and primary and secondary somatomotor areas (MOp, MOs). A new generation of strategies and experimental tools is needed to analyze cortical structure–function relations in a manner that is more firmly rooted in connectional anatomy.
Several relationships between ipsilateral and commissural cortical connections are especially noteworthy. First, all cortical regions have a unique set of association and commissural input and output connections. Second, there are about four times more association than commissural connections, and all cortical regions send more association than commissural connections. Third, commissural links of any cortical region perfectly match corresponding association connections of that region, that is, they are a connectional subset. Fourth, the stronger an association connection, the more likely it is that a corresponding commissural connection exists. Fifth, regions that maintain greater numbers of association connections also tend to maintain greater numbers of commissural connections. Future studies will be needed to verify whether these and other rules listed in Results hold across different systems and different species. However, already it has been shown that the pattern of commissural connections from a cortical area is basically an attenuated mirror version of the area’s association connections, for the rhesus monkey prefrontal region (24), and for a limited set (see table S6 in ref. 6) of mouse cortical areas (25).
Finally, it is worth noting that, while network attributes such as modules, hubs, and rich club organization are investigated and evaluated separately in this study, their origin in empirically grounded generative models that include factors such as spatial embedding is not mutually independent. Instead, it seems likely that most large-scale aspects of connectivity architecture emerge jointly and are driven by a common set of developmental constraints and evolutionary pressures (26, 27).
Our analysis here shares a limitation common to any systematic “big data” project: it is based on a currently available dataset that is incomplete and subject to increased validity as better tools and the results of more analysis become available. Thus, we now have version 2.0 of the rat cortical association macroconnectome (RCAMv2), and version 1.0 of the rat cortical commissural macroconnectome (RCCMv1). The entire dataset used here is publicly available in SI Materials and Methods, so new versions and analysis strategies may be created at any time by the community.
Materials and Methods
Methods for the underlying network analysis are essentially the same as those described in detail elsewhere (6, 14), and in SI Materials and Methods. All relevant data in the primary literature were interpreted in the only available standard, hierarchically organized, annotated parcellation and nomenclature for the rat brain (Dataset S1) using descriptive nomenclature defined in the Foundational Model of Connectivity (15, 16). Association and commissural connection reports were assigned ranked qualitative connection weights based on pathway tracing methodology, injection site location and extent, and described anatomical density. All collated connection report data and annotations are provided in a Microsoft Office Excel worksheet (Dataset S2), and the data extracted from these reports to construct connection matrices are provided in an Excel workbook (Dataset S3). To facilitate access to the connection report data, it is also provided on an open access website (The Neurome Project) that serves as a web repository for these efforts.
SI Materials and Methods
Cerebral Cortex Histological Parcellation Granularity.
To facilitate comparative analysis, all rat connection data were collated with respect to one standard rat brain atlas (28). However, the gray matter regions of the rat central nervous system (CNS) were arranged according to a CNS hierarchical nomenclature with a strictly topographic ordering as outlined elsewhere (30), rather than the structure–function ordering followed earlier (6, 28, 31). In addition, the CNS hierarchical level of gray matter regions and subregions were explicitly recognized here as comparable (respectively) to the species and subspecies levels in animal taxonomy (32) (Dataset S1). This nomenclature scheme recognizes 77 gray matter regions in the rat cerebral cortex, all of which were included in the present analysis. The rat cortical association macroconnectome published previously (6) had 73 regions; it did not include regions FC, AUDpo, VISpm, NLOT3, and 6b; and in the current analysis the old ENTmv was eliminated by combining it with ENTm (for abbreviation definitions, see Dataset S3).
Connection Report Collation and Selection for Network Analysis.
Our methodology for expertly collating connectional data from the primary neuroanatomical research literature follows previous description (6, 14) and is elaborated here. First, the primary literature was searched to find the best available connection data, from which connection reports were created. Several criteria were used to assess the quality of connection data: these included the validity of the experimental pathway tracing method used, restriction of the pathway tracer injection site to the gray matter region of interest for positive data (very large injections sites are useful for negative data), injection site coverage of the region of interest, and thoroughness of description of the connection.
The validity (accuracy and reliability) of the experimental pathway tracing methods in the primary literature was assessed in relation to three main criteria: (i) reach (monosynaptic or multisynaptic), (ii) sensitivity (clarity and extent of labeling relative to other methods), and (iii) uptake (by axons-of-passage). Based on these criteria, an overall validity rank was assigned to each pathway tracer on a seven-point scale (lowest to highest validity). For connections reported to exist (present), the validity ranking was applied directly; for connections reported to not exist (absent), a different interpretation applied. Thus, for absent connections, while a high validity rank of the underlying methodology supported the validity of the data, the same could also be true for a low validity rank because the absence of a monosynaptic connection determined by a pathway tracer taken up avidly by axons-of-passage, and/or transported multisynaptically, is also highly valid.
Next, for each possible cell in the connection matrix for which data were available, a single connection report was selected as best representative of the connection (using the criteria noted above). If more than one connection report was entered for a given connection (depending on the availability of data in the primary literature), then, all else being equal, the connection report with the highest connection weight was selected. Last, the weight of each selected connection report was used to populate a connection matrix (Dataset S3, worksheet 4) that was used for subsequent network analysis.
One change in connection report entry was made here. In the earlier collation effort (6), multiple connection reports were generated from the same experiment, particularly when a connection was illustrated on multiple section levels through a region of interest, and labeling density varied in a gradient fashion across levels. As a result, in extreme examples, multiple connection reports with connection weights ranging from absent to very strong were entered in the database. Currently, for a specific citation (paper), only one connection report from an experiment, or even a group of experiments using the same method, is used in the database. This methodological change reduces the number of connections reports in ref. 6 from >16,000 to ∼13,000, compared with 16,175 assembled here for the cortical association and commissural macroconnectome arising in one hemisphere (32,350 for both hemispheres because no statistically valid right/left differences have been reported in the literature).
The collation process was considerably aided by a dedicated data entry platform (Axiome M; created by J.D.H.) designed as a worksheet template for use with Microsoft Office Excel (14). The template facilitates speed and accuracy of data entry by utilizing data validation and conditional formatting rules, and a highly structured and guided user-friendly interface. By comparison, collation of ∼16,000 connection reports in ref. 6 reportedly took ∼4,000 h, whereas collation of about the same number of connection reports here took ∼1,200 h. The complete set of connection reports used in the present analysis is available as Dataset S2.
Connection Weight Scaling Methodology for Network Analysis.
There is almost no quantitative data available in the literature regarding the density or weight of the rat macroconnections used in this analysis. Therefore, ranked qualitative connection weights from the literature were divided into 12 value categories. In ascending order, they are as follows: no data, unclear, absent, axons-of-passage (in a gray matter region of interest; white matter tracts are not considered in this analysis), very weak, weak, weak to moderate, exists (present, but weight unreported), moderate, moderate to strong, strong, and very strong. For the purposes of our network analysis, some of these values were binned. Reports of axons-of-passage were assigned a weight of “weak,” and connections for which the reported value was entered as “exists” (present, but weight unreported) were assigned a weight of “moderate,” and the category values of “unclear” and “no data” were assigned to the “absent” category. Thus, the set of ranked qualitative values used for network analysis included eight values (7 weights, and 0 for absent) that were considered for our purposes to form an ordinal scale (see worksheet 1 of Dataset S3). As justified previously (6), the ranked qualitative connection weights were then transformed to approximately logarithmically spaced weights for network analysis using a 104 exponential scale.
Network Analysis Methods.
Network analyses were carried out on the directed and log-weighted rat intracerebral cortical macroconnection matrix (RiCCM) (Figs. 1 and 4) using tools collected in the Brain Connectivity Toolbox (www.brain-connectivity-toolbox.net). Detailed descriptions of most network measures and analysis procedures can be found in ref. 12. The complete set of 77 rat cerebral cortical gray matter regions are referred to as the nodes of the RiCNM network.
Optimal module partitions were detected through repeated runs of the Louvain algorithm (33) for modularity maximization (13, 34). As in previous work (12) we used an objective function that included a resolution parameter γ (18) designed to detect modules that range over several spatial scales (or levels of resolution). Here, we varied γ over a range of γ = [0.5–1.5], an interval centered on the commonly used default setting of γ = 1. A given module partition is considered “robust” or “stable” if small variations of the resolution parameter yield identical optimal solutions. Values of γ greater than 1.5 or smaller than 0.5 yielded mostly unstable solutions with unrealistically low or high numbers of modules, and hence were not considered further. We optimized modularity 1,000 times for each setting (0.01 steps) of γ and encountered very little degeneracy among the partitions that were identified. Hence, we selected the partition with the optimal value of the objective function without performing consensus clustering.
Analyses of global network metrics such as clustering, path length and efficiency, and rich club organization were statistically evaluated by comparison with a degree sequence-preserving distribution of null models, as in previous work (6, 14). Rewiring of the networks comprising the random null model followed a commonly used procedure equivalent to a Markov switching algorithm (35) that preserves the number of incoming and outgoing connections on all nodes. Spatial (center-of-mass) coordinates for the 77 regions in our analysis were unavailable and hence could not be incorporated into any of the analyses or null models employed here.
As in previous work (6, 9, 14, 36), network hubs were determined based on aggregated rankings across several distinct nodal centrality measures: the node degree, node strength, node betweenness centrality, and closeness centrality. After ranking nodes on each of the four metrics, an aggregate “hub score” was determined for each node, expressing the number of metrics for which each node appeared in the top 20% (top seven nodes).
Rich club organization (37) refers to the propensity of highly connected nodes (with high degree) also to be densely connected to each other, more so than expected by chance. Chance is defined by an appropriately configured null model, here a degree sequence-preserving rewiring algorithm (described above). In all respects, our analysis proceeded as described in previous work (6, 14).
Supplementary Material
Acknowledgments
This work was supported in part by the Kavli Foundation (L.W.S. and J.D.H.).
Footnotes
The authors declare no conflict of interest.
Data deposition: Network analysis tools are available at the Brain Connectivity Toolbox (www.brain-connectivity-toolbox.net); all connection reports used for this study are available as a Microsoft Office Excel worksheet (Dataset S2) and have been deposited at The Neurome Project (neuromeproject.org).
This article contains supporting information online at www.pnas.org/lookup/suppl/doi:10.1073/pnas.1712928114/-/DCSupplemental.
References
- 1.Sperry RW, Gazzaniga MS, Bogen JE. Interhemispheric relationships: The neocortical commissures; syndromes of hemisphere disconnection. In: Vinken PJ, Bruyn GW, editors. Handbook of Clinical Neurology. North-Holland Publishing Company; Amsterdam: 1969. pp. 177–184. [Google Scholar]
- 2.Reil JC. Untersuchungen über den Bau des grossen Gehirns im Menschen. Arch Physiol. 1809;9:136–208. [Google Scholar]
- 3.Aboitiz F, Montiel J. One hundred million years of interhemispheric communication: The history of the corpus callosum. Braz J Med Biol Res. 2003;36:409–420. doi: 10.1590/s0100-879x2003000400002. [DOI] [PubMed] [Google Scholar]
- 4.Zingg B, et al. Neural networks of the mouse neocortex. Cell. 2014;156:1096–1111. doi: 10.1016/j.cell.2014.02.023. [DOI] [PMC free article] [PubMed] [Google Scholar]
- 5.Oh SW, et al. A mesoscale connectome of the mouse brain. Nature. 2014;508:207–214. doi: 10.1038/nature13186. [DOI] [PMC free article] [PubMed] [Google Scholar]
- 6.Bota M, Sporns O, Swanson LW. Architecture of the cerebral cortical association connectome underlying cognition. Proc Natl Acad Sci USA. 2015;112:E2093–E2101. doi: 10.1073/pnas.1504394112. [DOI] [PMC free article] [PubMed] [Google Scholar]
- 7.Scannell JW, Blakemore C, Young MP. Analysis of connectivity in the cat cerebral cortex. J Neurosci. 1995;15:1463–1483. doi: 10.1523/JNEUROSCI.15-02-01463.1995. [DOI] [PMC free article] [PubMed] [Google Scholar]
- 8.de Reus MA, van den Heuvel MP. Rich club organization and intermodule communication in the cat connectome. J Neurosci. 2013;33:12929–12939. doi: 10.1523/JNEUROSCI.1448-13.2013. [DOI] [PMC free article] [PubMed] [Google Scholar]
- 9.Harriger L, van den Heuvel MP, Sporns O. Rich club organization of macaque cerebral cortex and its role in network communication. PLoS One. 2012;7:e46497. doi: 10.1371/journal.pone.0046497. [DOI] [PMC free article] [PubMed] [Google Scholar]
- 10.Palomero-Gallagher N, Zilles K. Isocortex. In: Paxinos G, editor. The Rat Nervous System. 4th Ed. Elsevier; Amsterdam: 2015. pp. 601–625. [Google Scholar]
- 11.Nieuwenhuys R, Voogd J, van Huijzen C. The Human Central Nervous System. 4th Ed Springer; Berlin: 2008. [Google Scholar]
- 12.Rubinov M, Sporns O. Complex network measures of brain connectivity: Uses and interpretations. Neuroimage. 2010;52:1059–1069. doi: 10.1016/j.neuroimage.2009.10.003. [DOI] [PubMed] [Google Scholar]
- 13.Sporns O, Betzel RF. Modular brain networks. Annu Rev Psychol. 2016;67:613–640. doi: 10.1146/annurev-psych-122414-033634. [DOI] [PMC free article] [PubMed] [Google Scholar]
- 14.Swanson LW, Sporns O, Hahn JD. Network architecture of the cerebral nuclei (basal ganglia) association and commissural connectome. Proc Natl Acad Sci USA. 2016;113:E5972–E5981. doi: 10.1073/pnas.1613184113. [DOI] [PMC free article] [PubMed] [Google Scholar]
- 15.Swanson LW, Bota M. Foundational model of structural connectivity in the nervous system with a schema for wiring diagrams, connectome, and basic plan architecture. Proc Natl Acad Sci USA. 2010;107:20610–20617. doi: 10.1073/pnas.1015128107. [DOI] [PMC free article] [PubMed] [Google Scholar]
- 16.Brown RA, Swanson LW. Neural systems language: A formal modeling language for the systematic description, unambiguous communication, and automated digital curation of neural connectivity. J Comp Neurol. 2013;521:2889–2906. doi: 10.1002/cne.23348. [DOI] [PMC free article] [PubMed] [Google Scholar]
- 17.Swanson LW, Lichtman JW. From Cajal to connectome and beyond. Annu Rev Neurosci. 2016;39:197–216. doi: 10.1146/annurev-neuro-071714-033954. [DOI] [PubMed] [Google Scholar]
- 18.Fortunato S, Barthélemy M. Resolution limit in community detection. Proc Natl Acad Sci USA. 2007;104:36–41. doi: 10.1073/pnas.0605965104. [DOI] [PMC free article] [PubMed] [Google Scholar]
- 19.Krieg WJS. Connections of the cerebral cortex; the albino rat; topography of the cortical areas. J Comp Neurol. 1946;84:221–275. doi: 10.1002/cne.900840205. [DOI] [PubMed] [Google Scholar]
- 20.Lu H, et al. Rat brains also have a default mode network. Proc Natl Acad Sci USA. 2012;109:3979–3984. doi: 10.1073/pnas.1200506109. [DOI] [PMC free article] [PubMed] [Google Scholar]
- 21.Stafford JM, et al. Large-scale topology and the default mode network in the mouse connectome. Proc Natl Acad Sci USA. 2014;111:18745–18750. doi: 10.1073/pnas.1404346111. [DOI] [PMC free article] [PubMed] [Google Scholar]
- 22.Raichle ME. The brain’s default mode network. Annu Rev Neurosci. 2015;38:433–447. doi: 10.1146/annurev-neuro-071013-014030. [DOI] [PubMed] [Google Scholar]
- 23.Broca PP. Anatomie comparée des circonvolutions cérébrales. Le grand lobe limbique et la scissure limbique dans la série des mammifères. Rev Antropol. 1878;1:385–498. [Google Scholar]
- 24.Barbas H, Hilgetag CC, Saha S, Dermon CR, Suski JL. Parallel organization of contralateral and ipsilateral prefrontal cortical projections in the rhesus monkey. BMC Neurosci. 2005;6:32. doi: 10.1186/1471-2202-6-32. [DOI] [PMC free article] [PubMed] [Google Scholar]
- 25.Goulas A, Uylings HBM, Hilgetag CC. Principles of ipsilateral and contralateral cortico-cortical connectivity in the mouse. Brain Struct Funct. 2017;222:1281–1295. doi: 10.1007/s00429-016-1277-y. [DOI] [PubMed] [Google Scholar]
- 26.Rubinov M. Constraints and spandrels of interareal connectomes. Nat Commun. 2016;7:13812. doi: 10.1038/ncomms13812. [DOI] [PMC free article] [PubMed] [Google Scholar]
- 27.Betzel RF, et al. Generative models of the human connectome. Neuroimage. 2016;124:1054–1064. doi: 10.1016/j.neuroimage.2015.09.041. [DOI] [PMC free article] [PubMed] [Google Scholar]
- 28.Swanson LW. Brain Maps: Structure of the Rat Brain. A Laboratory Guide with Printed and Electronic Templates for Data, Models and Schematics. 3rd Ed Elsevier; Amsterdam: 2004. [Google Scholar]
- 29.Swanson LW. Cerebral hemisphere regulation of motivated behavior. Brain Res. 2000;886:113–164. doi: 10.1016/s0006-8993(00)02905-x. [DOI] [PubMed] [Google Scholar]
- 30.Swanson LW. Neuroanatomical Terminology: A Lexicon of Classical Origins and Historical Foundations. Oxford Univ Press; Oxford: 2015. [Google Scholar]
- 31.Swanson LW. Brain Architecture: Understanding the Basic Plan. Oxford Univ Press; Oxford: 2003. [Google Scholar]
- 32.International Commission on Zoological Nomenclature . International Code of Zoological Nomenclature. International Trust for Zoological Nomenclature; London: 1999. [DOI] [PMC free article] [PubMed] [Google Scholar]
- 33.Blondel V, Guillaume JL, Lambiotte R, Lefebvre E. Fast unfolding of communities in large networks. J Stat Mech. 2008;2008:P10008. [Google Scholar]
- 34.Newman MEJ, Girvan M. Finding and evaluating community structure in networks. Phys Rev E Stat Nonlin Soft Matter Phys. 2004;69:026113. doi: 10.1103/PhysRevE.69.026113. [DOI] [PubMed] [Google Scholar]
- 35.Maslov S, Sneppen K. Specificity and stability in topology of protein networks. Science. 2002;296:910–913. doi: 10.1126/science.1065103. [DOI] [PubMed] [Google Scholar]
- 36.Sporns O, Honey CJ, Kötter R. Identification and classification of hubs in brain networks. PLoS One. 2007;2:e1049. doi: 10.1371/journal.pone.0001049. [DOI] [PMC free article] [PubMed] [Google Scholar]
- 37.Colizza V, Flammini A, Serrano MA, Vespignani A. Detecting rich-club ordering in complex networks. Nat Phys. 2006;2:110–115. [Google Scholar]
Associated Data
This section collects any data citations, data availability statements, or supplementary materials included in this article.


