IMMUNOLOGY AND INFLAMMATION Correction for “IgH isotype-specific B cell receptor expression influences B cell fate,” by Pei Tong, Alessandra Granato, Teng Zuo, Neha Chaudhary, Adam Zuiani, Seung Seok Han, Rakesh Donthula, Akritee Shrestha, Debattama Sen, Jennifer M. Magee, Michael P. Gallagher, Cees E. van der Poel, Michael C. Carroll, and Duane R. Wesemann, which was first published September 18, 2017; 10.1073/pnas.1704962114 (Proc Natl Acad Sci USA 114:E8411–E8420).
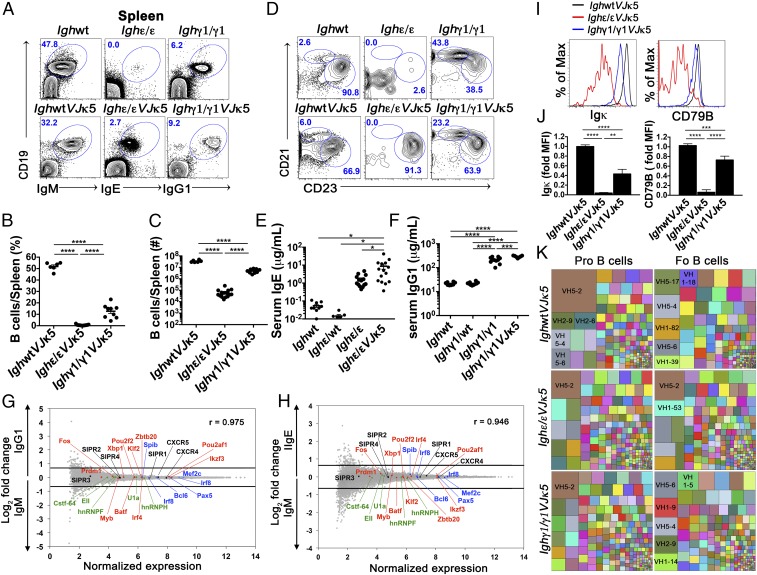
The authors note that Fig. 2 appeared incorrectly. The corrected figure and its legend appear below.
Fig. 2.
Development and characteristics of IgE+ and IgG1+ mature B cells with the introduction of a prerearranged Igκ (VJκ5). (A) FACS plots show splenic lymphocytes of the indicated mice. Numbers in the plots indicate percentage of gated live CD19+ BCR+ cells (n = 6). (B and C) Dot graphs showing percentage (B) and absolute number (C) of splenic B cells of indicated mice. (D) FACS plots of live CD19+ B220+ CD93− gated lymphocytes from spleens of the indicated mice to identify splenic marginal zone (CD21hi CD23lo) and follicular (CD21int CD23hi) B cells (n = 6). Because Ighε/εVJκ5 and Ighγ1/γ1VJκ5 mice appear to express higher levels of CD23, the gating is relative within each mouse to identify CD23hi CD21int follicular B cells. Numbers in the plots indicate percentages. (E and F) Total serum IgE (E) and IgG1 (F) concentration measured by ELISA from the indicated mice. Each dot represents individual mice. (G and H) Naïve splenic IgE+ and IgG1+ B cells show similar gene expression pattern to WT naïve IgM B cells. Microarray analysis of sorted B220+ CD93− CD23hi CD21int (follicular) splenic B cells from IghWTVJκ5 (IgM) versus Ighγ1/γ1VJκ5 (IgG1) mice (G), and IghWTVJκ5 (IgM) versus Ighε/εVJκ5 (IgE) mice (H). Selected chemokine receptor genes (black), splicing factors (green), as well as positive (red) and negative (blue) regulators of plasma cell differentiation are shown. Lines represent cutoffs for genes up- or down-regulated by a fold-change of at least 0.67 (log2). The Pearson correlation coefficient (r) between gene expression levels is given for respective plots (n = 3). (I and J) Flow cytometric histogram plots (I) and summary bar graphs (J) of live BCR+ follicular B cells from the indicated mice analyzed for surface Igκ expression (Left of I and J) and CD79B expression (Right of I and J). Fold median fluorescence intensity (MFI) was calculated by dividing MFI values by the average MFI from IgM+ from IghWTVJκ5 mice for each given subset (n = 4–5). *P < 0.05, **P < 0.01, ***P < 0.001, ****P < 0.0001; one-way ANOVA followed by Tukey’s post hoc test. Data are mean values ± SEM. (K) Treemaps showing VH gene segment frequencies in pro- and follicular (Fo) B cells from IghWTVJκ5, Ighε/εVJκ5, and Ighγ1/γ1VJκ5 mice. Each block represents combined data from all biologic repeats (n = 5–6). Within a block, each colored box represents one VH segment. The size of the box is directly proportional to the percentage of sequences, which belongs to the VH segment. The same VH segment has the same color in all of the treemaps and the largest boxes contain the VH name. PCR repeats were removed via unique molecular indexing. See also SI Appendix, Figs. S3–S6.


